Since plunging to its year-to-date low of $1.61 on April 7, XRP holders have taken full advantage of the dip, ramping up accumulation efforts. This buying pressure has steadily increased the asset’s value over the past week.
At press time, XRP trades at a seven-day high of $2.19 and technical indicators show that it’s positioned to extend the gains.
XRP Golden Cross Drives Bullish Momentum
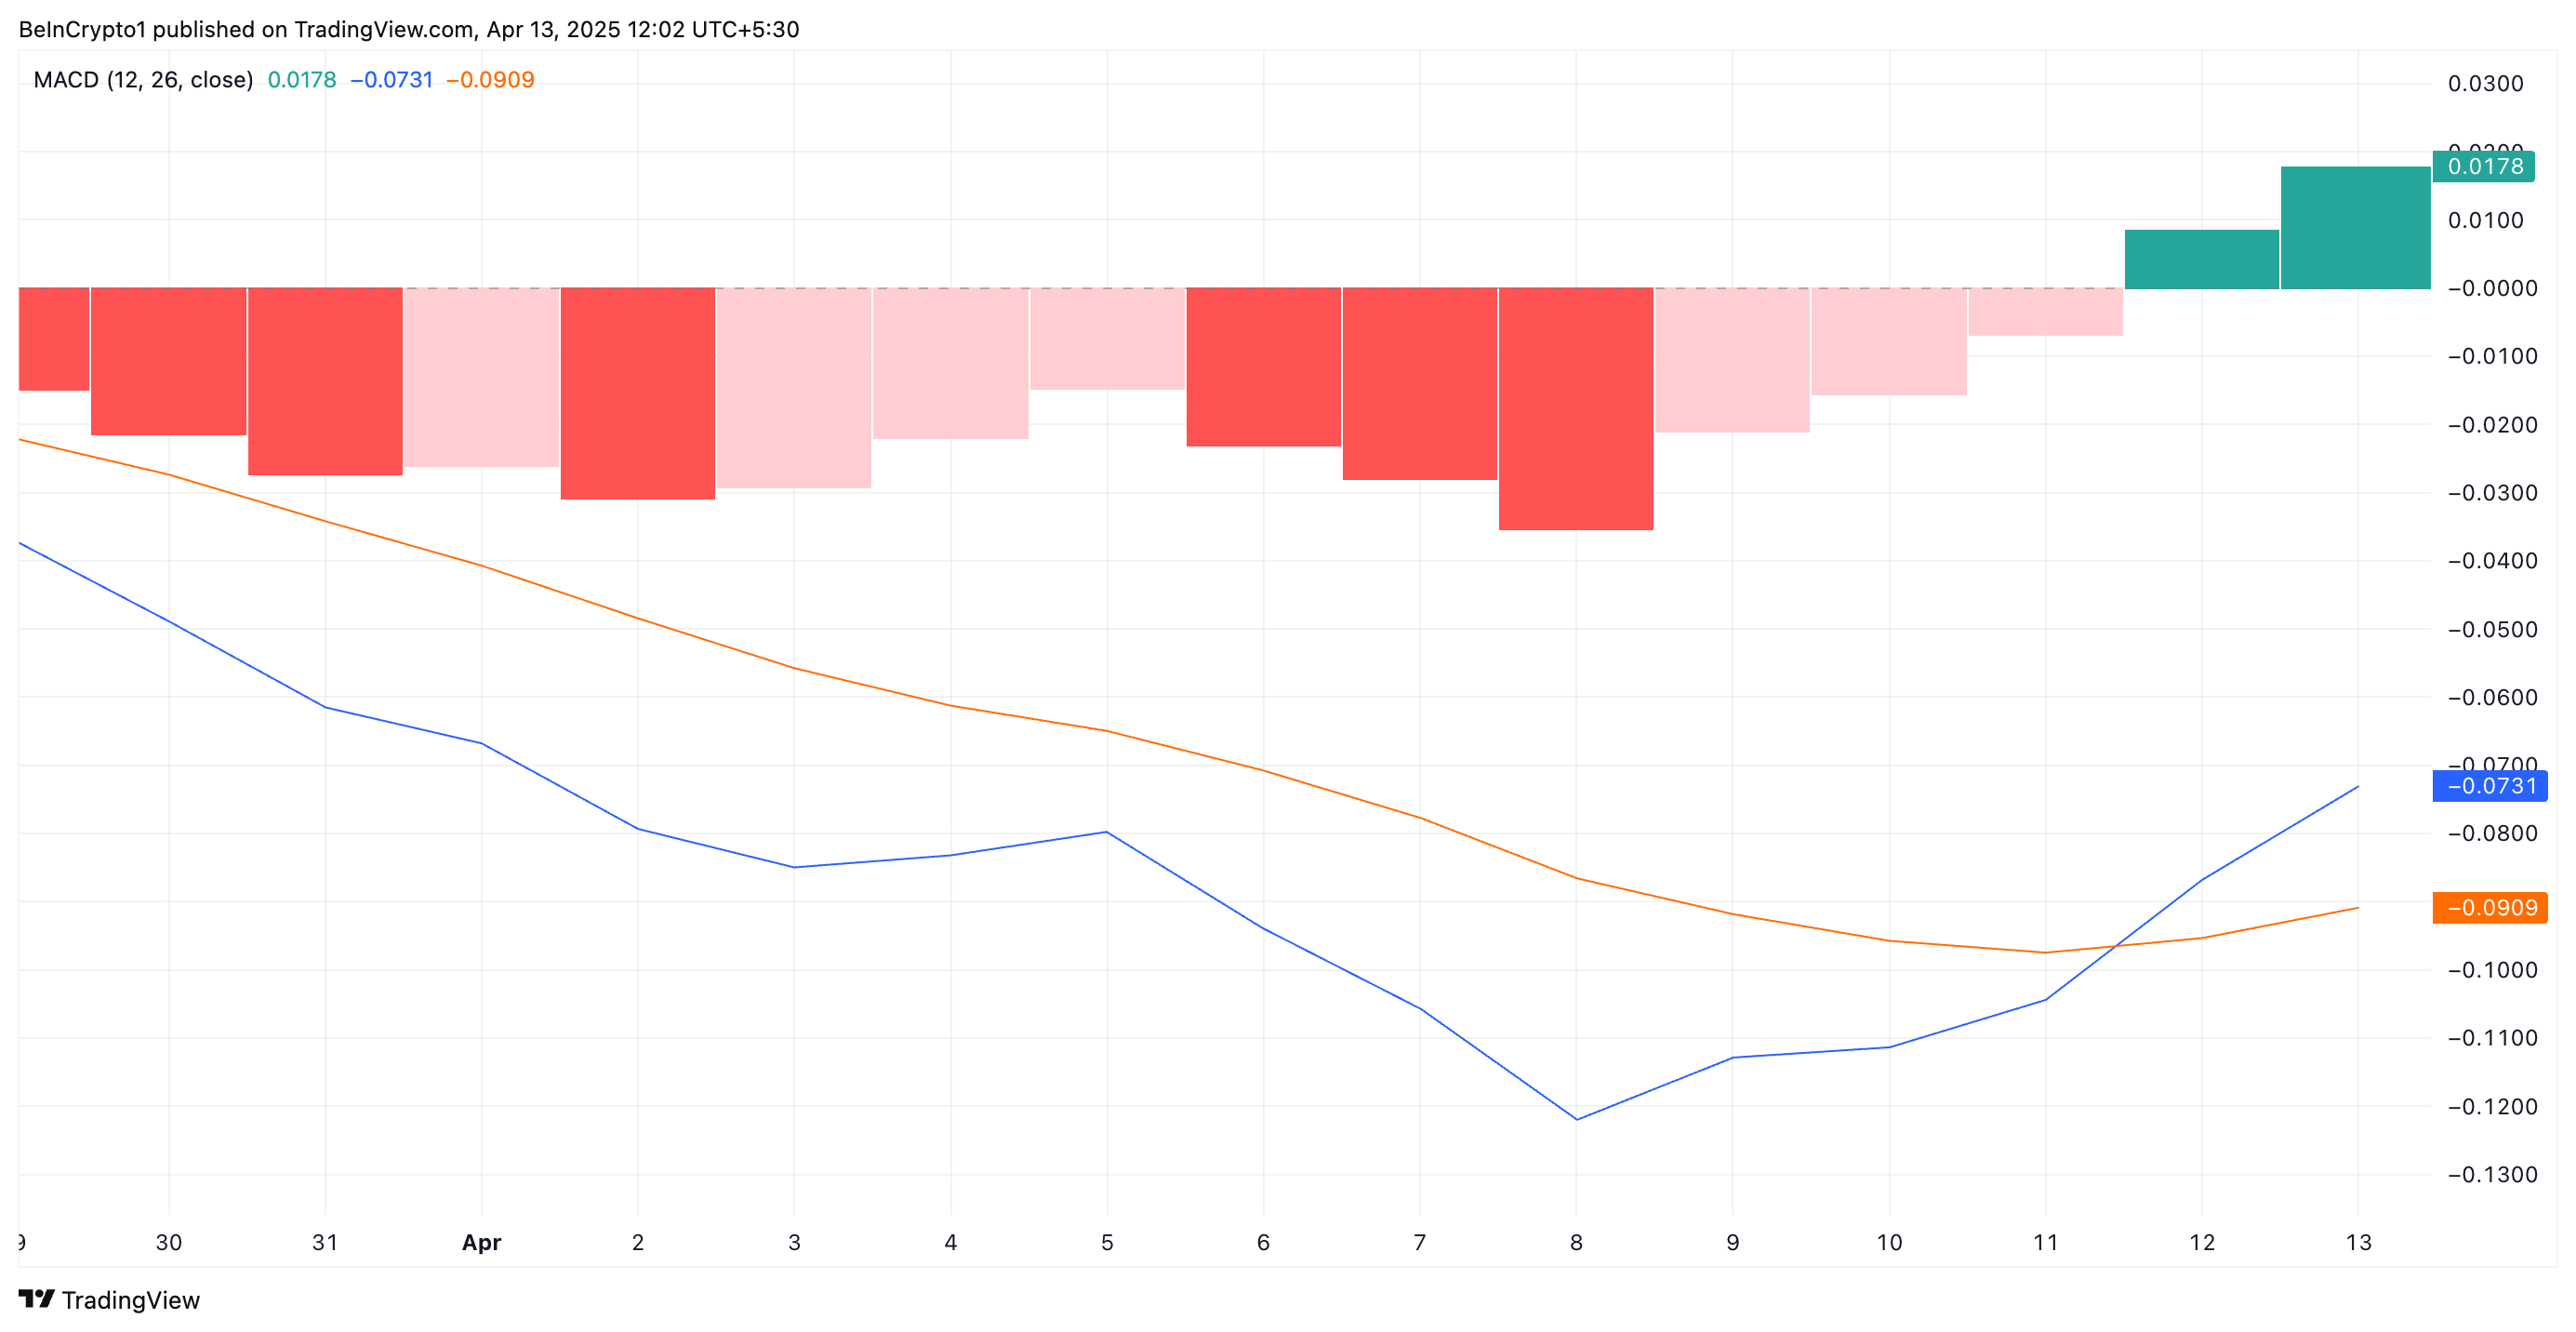
On the daily chart, a golden cross has formed on XRP’s Moving Average Convergence Divergence (MACD) indicator, which is often viewed as a key signal of a shift toward long-term upside.
When a golden cross emerges like this, it signals a positive shift in investor sentiment. Traders interpret it as a cue that buying pressure outpaces selling activity, which can attract even more inflows and drive the price higher.
For XRP, this golden cross occurred on April 11, reinforcing the growing bullish sentiment surrounding the asset. This pattern confirms that the altcoin’s recent price rebound is not just a short-lived reaction but may mark the beginning of a more sustained uptrend.
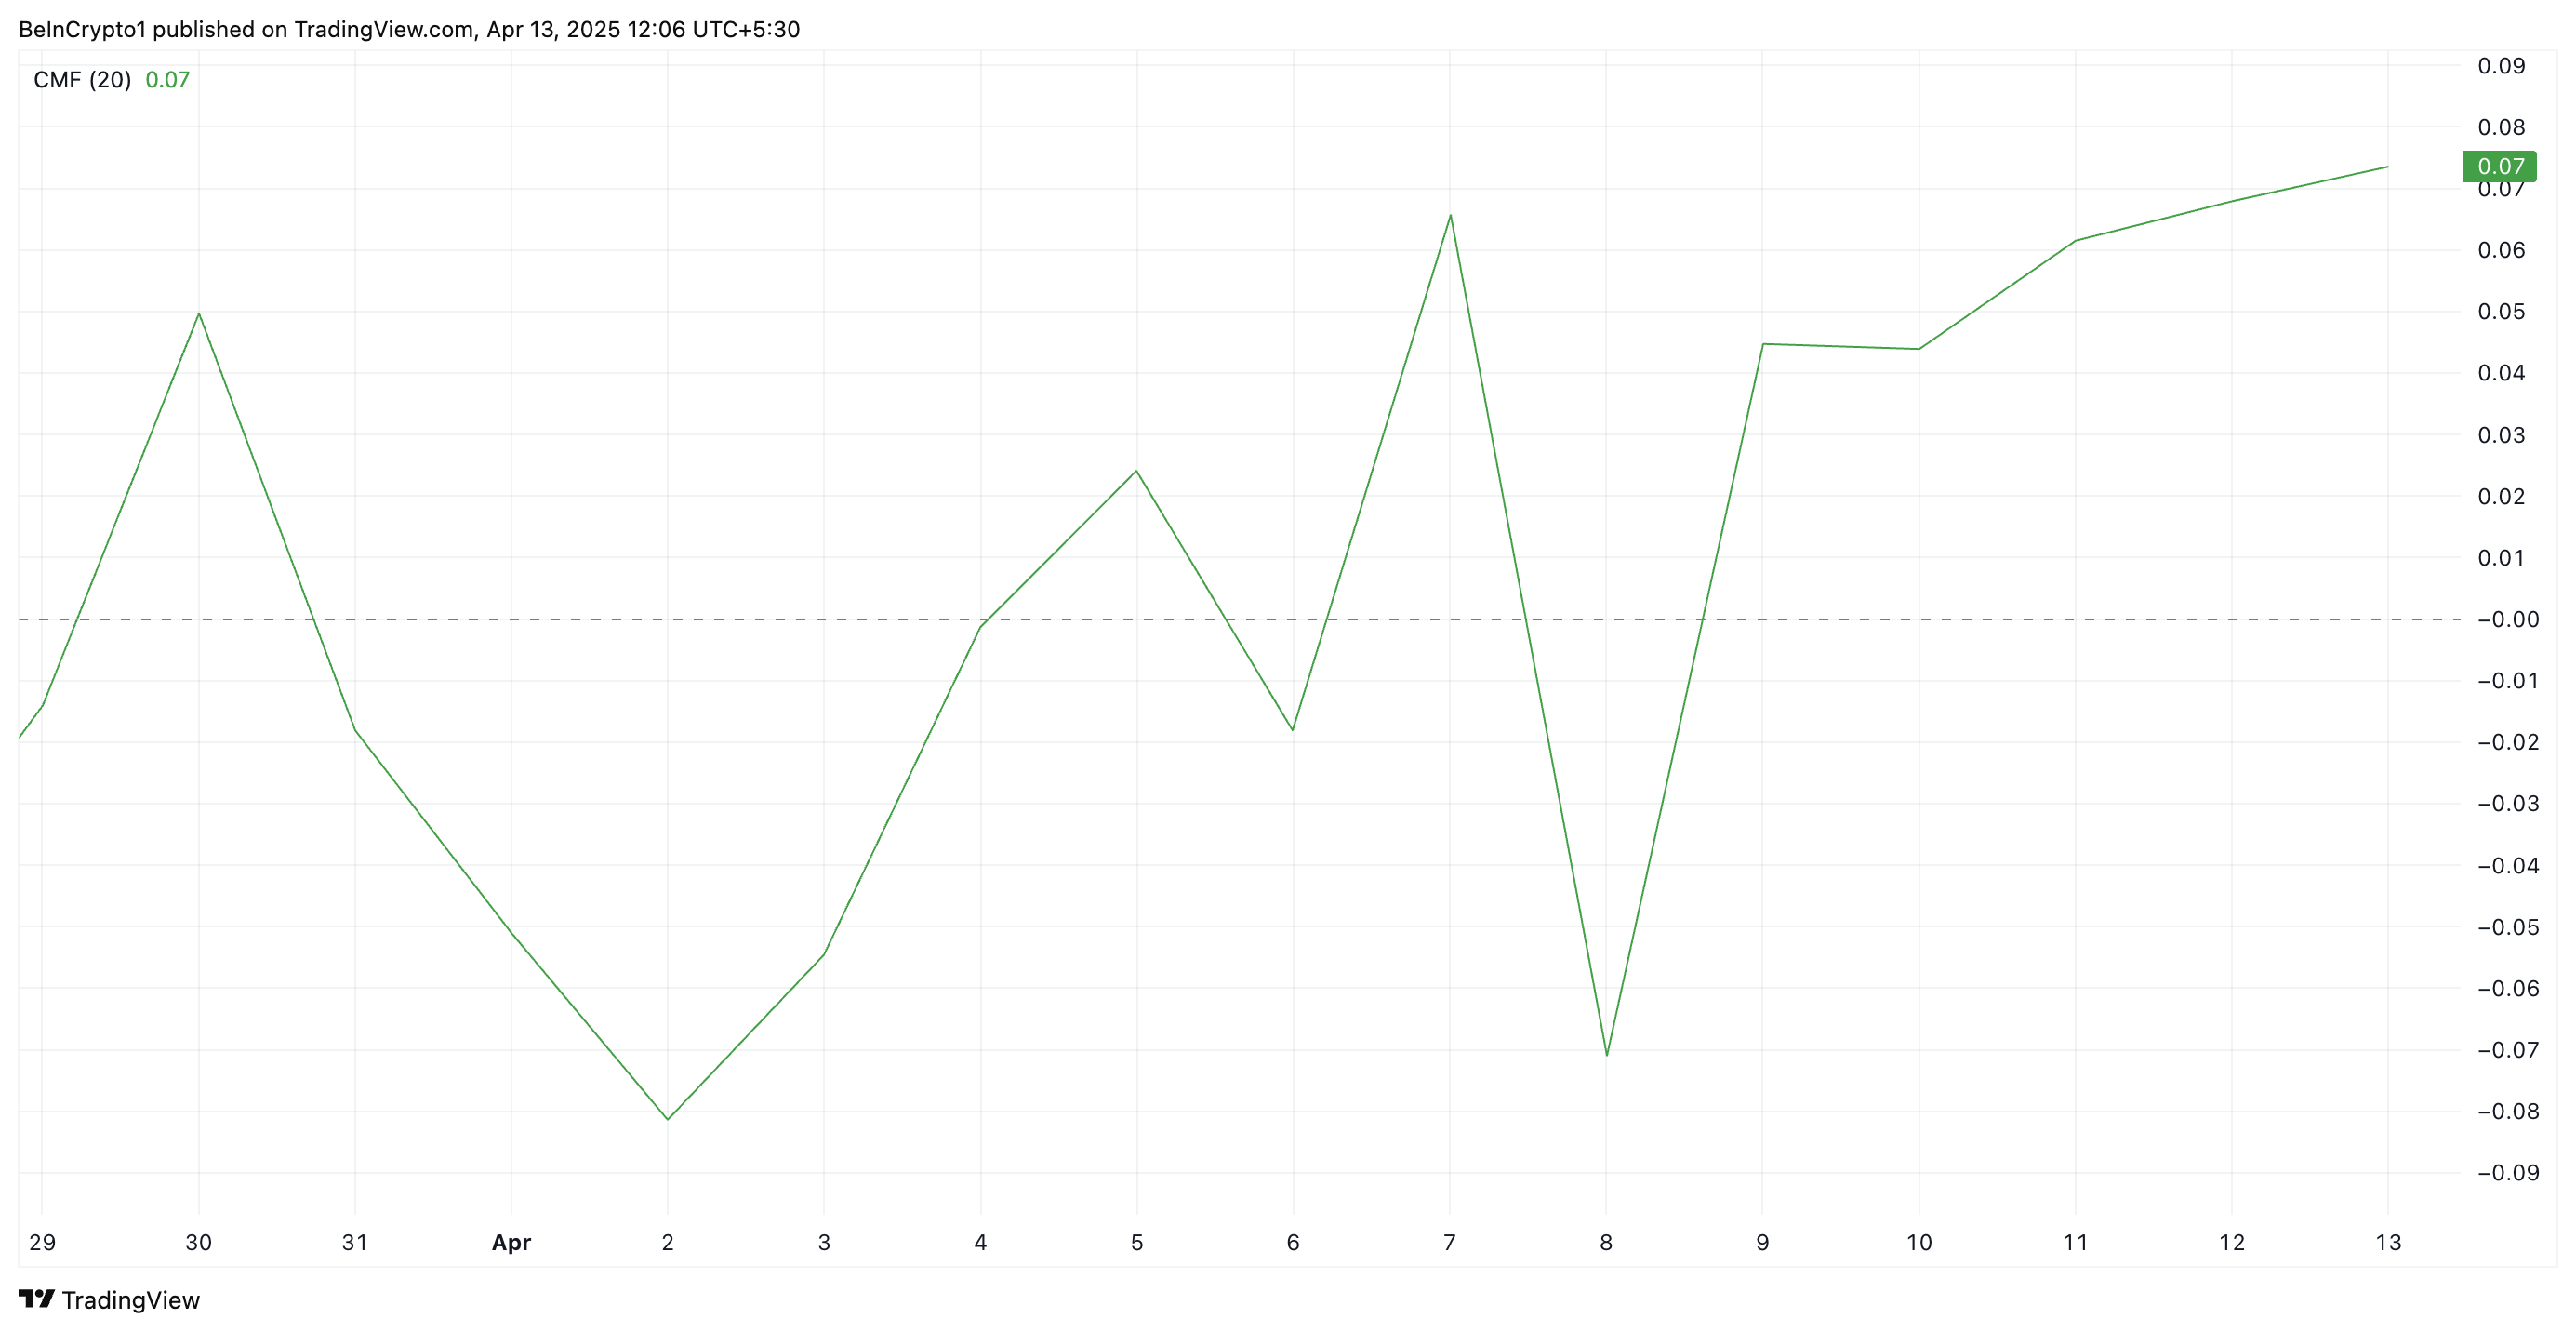
Further, the token’s positive Chaikin Money Flow (CMF) supports this bullish outlook. At press time, it rests above the center line and in an uptrend at 0.07.
The CMF indicator measures how money flows into and out of an asset. A positive CMF reading, as with XRP, means buying pressure is stronger than selling pressure over a given period. It suggests capital is flowing into the token, signaling accumulation and potential price growth.
XRP Maintains Uptrend—Next Stop: $2.50 or Back to $1.99?
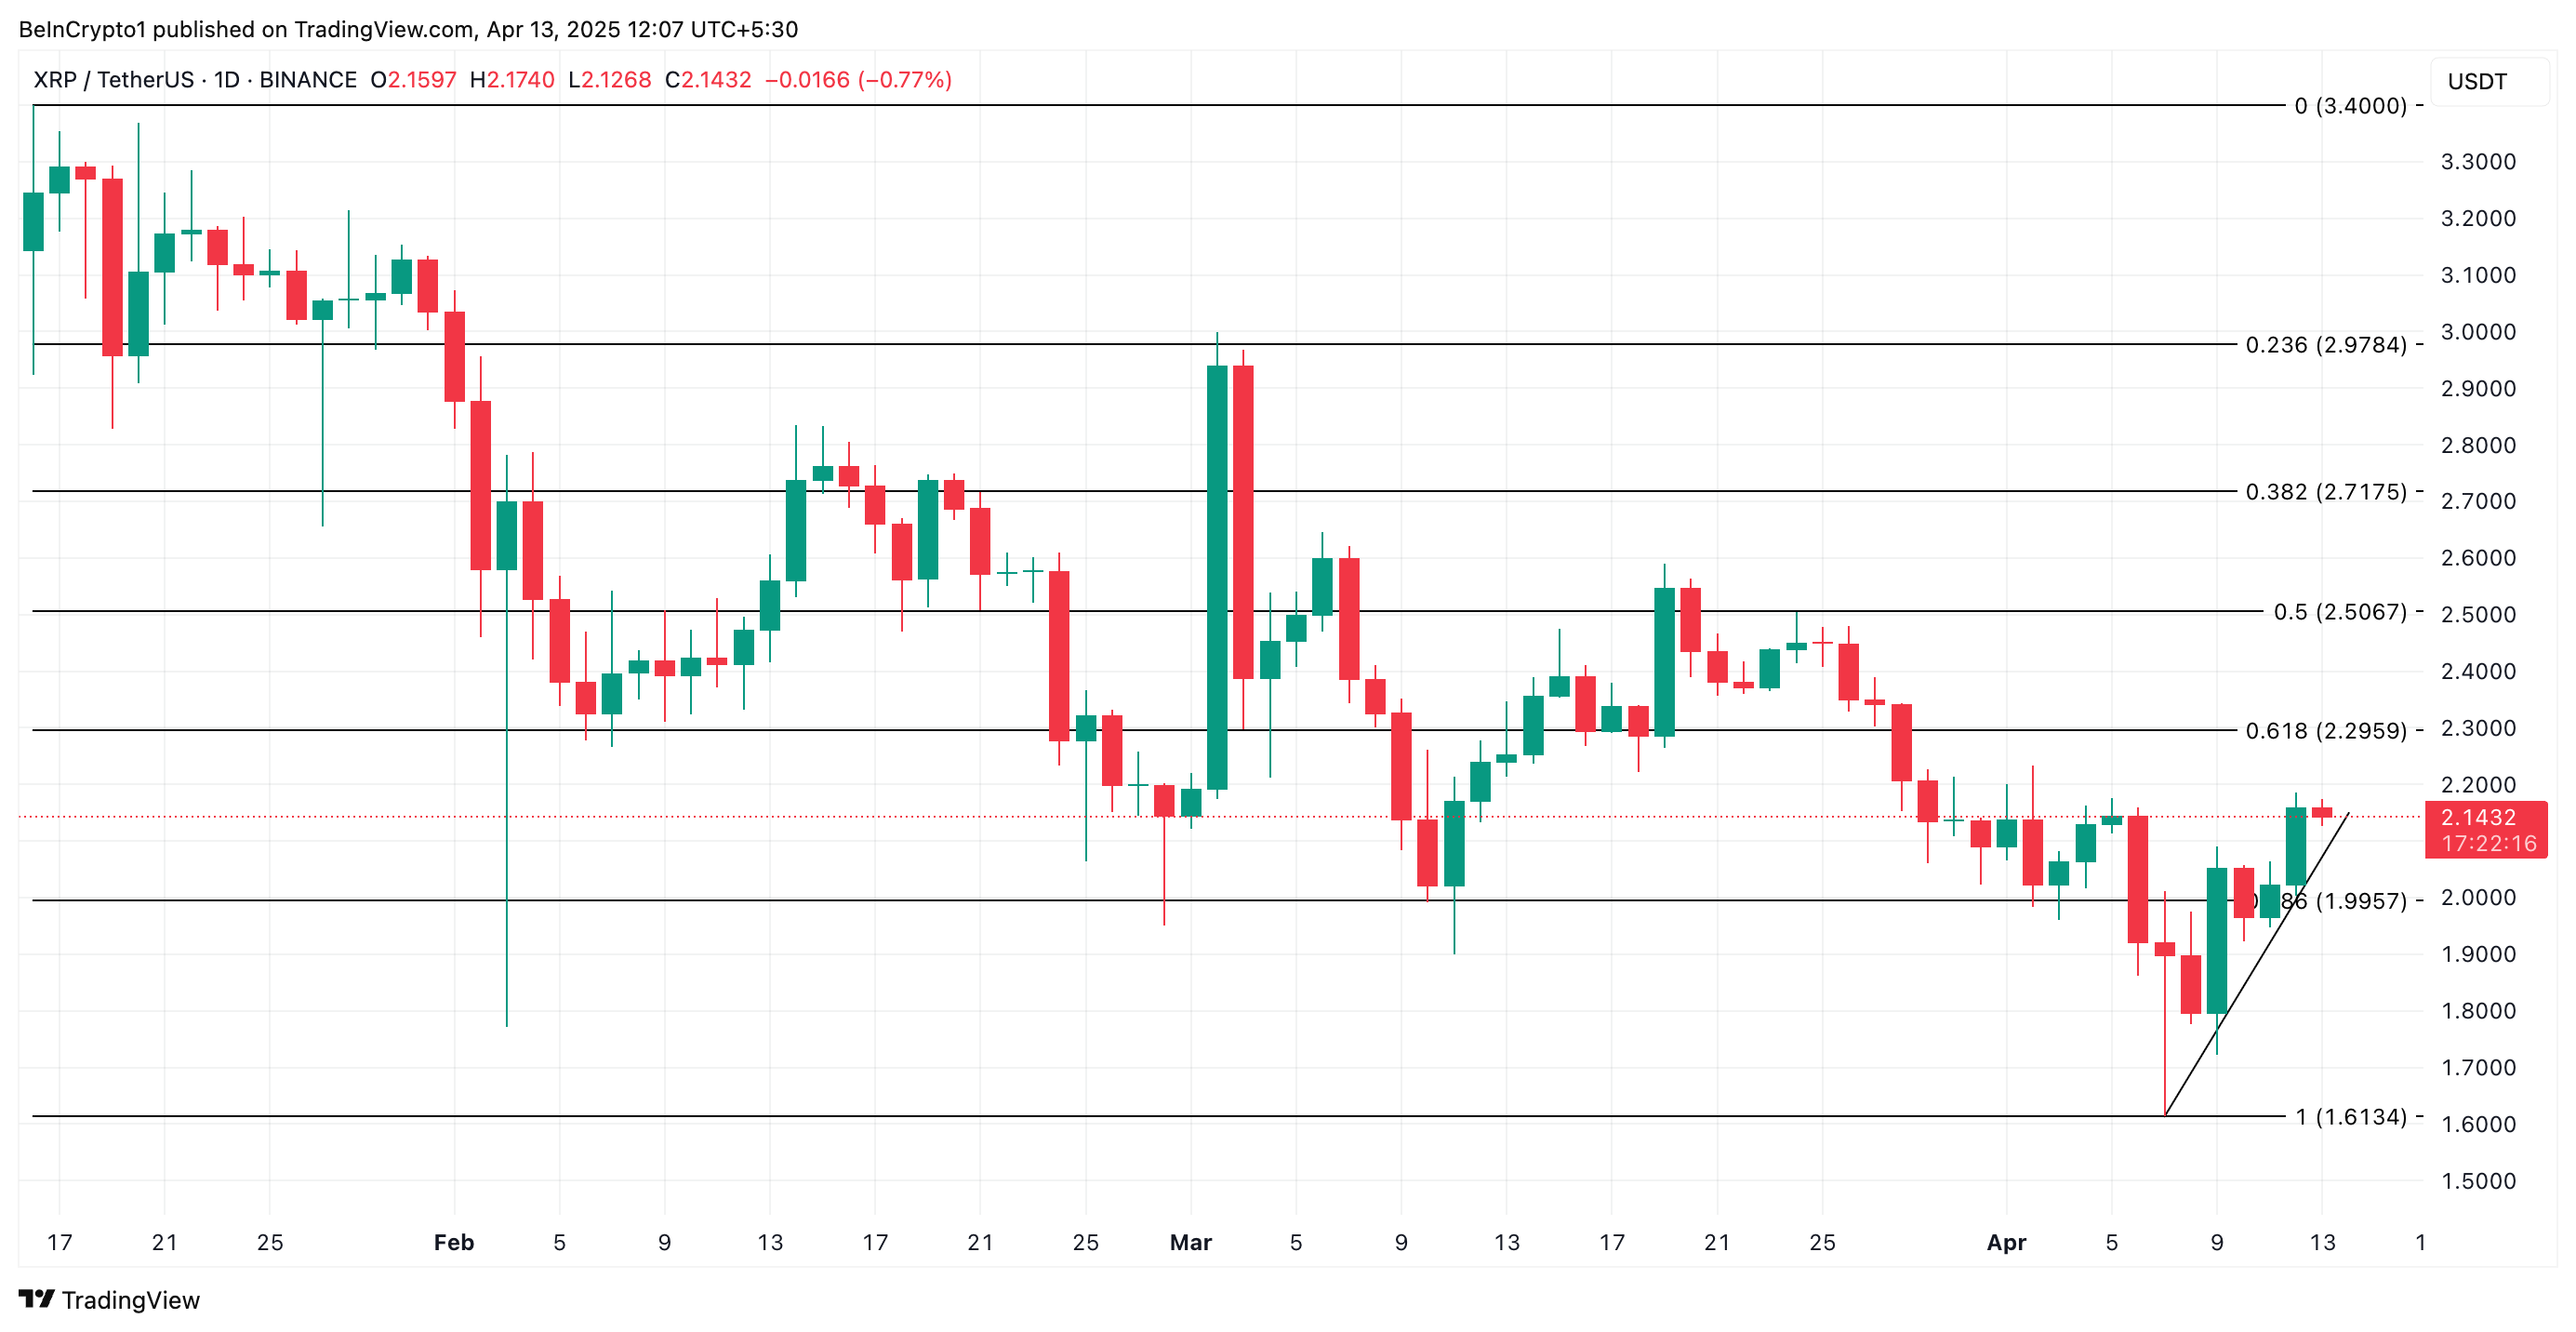
Since its rally began on April 7, XRP has traded above an ascending trend line. This bullish pattern emerges when an asset forms higher lows over time, creating an upward-sloping support line.
It signals sustained buying interest in XRP and suggests that momentum is building in favor of the bulls as the token’s price continues to climb.
If demand soars, XRP could extend its gains and climb to $2.29. A successful flip of this resistance into a support floor could propel XRP to $2.50.
Bitcoin (BTC) enters the second week of May trading in a fragile but critical zone, with conflicting technical signals and growing macro uncertainty shaping short-term expectations. While the ADX from the Directional Movement Index is rising, bearish pressure still dominates, and momentum remains weak across multiple indicators.
Although the price continues to hold above the $92,900 support level, weakening EMAs and the looming FOMC meeting leave Bitcoin’s $100,000 recovery path uncertain, but not out of reach.
BTC Trend Strength Rises, but Bears Still in Control
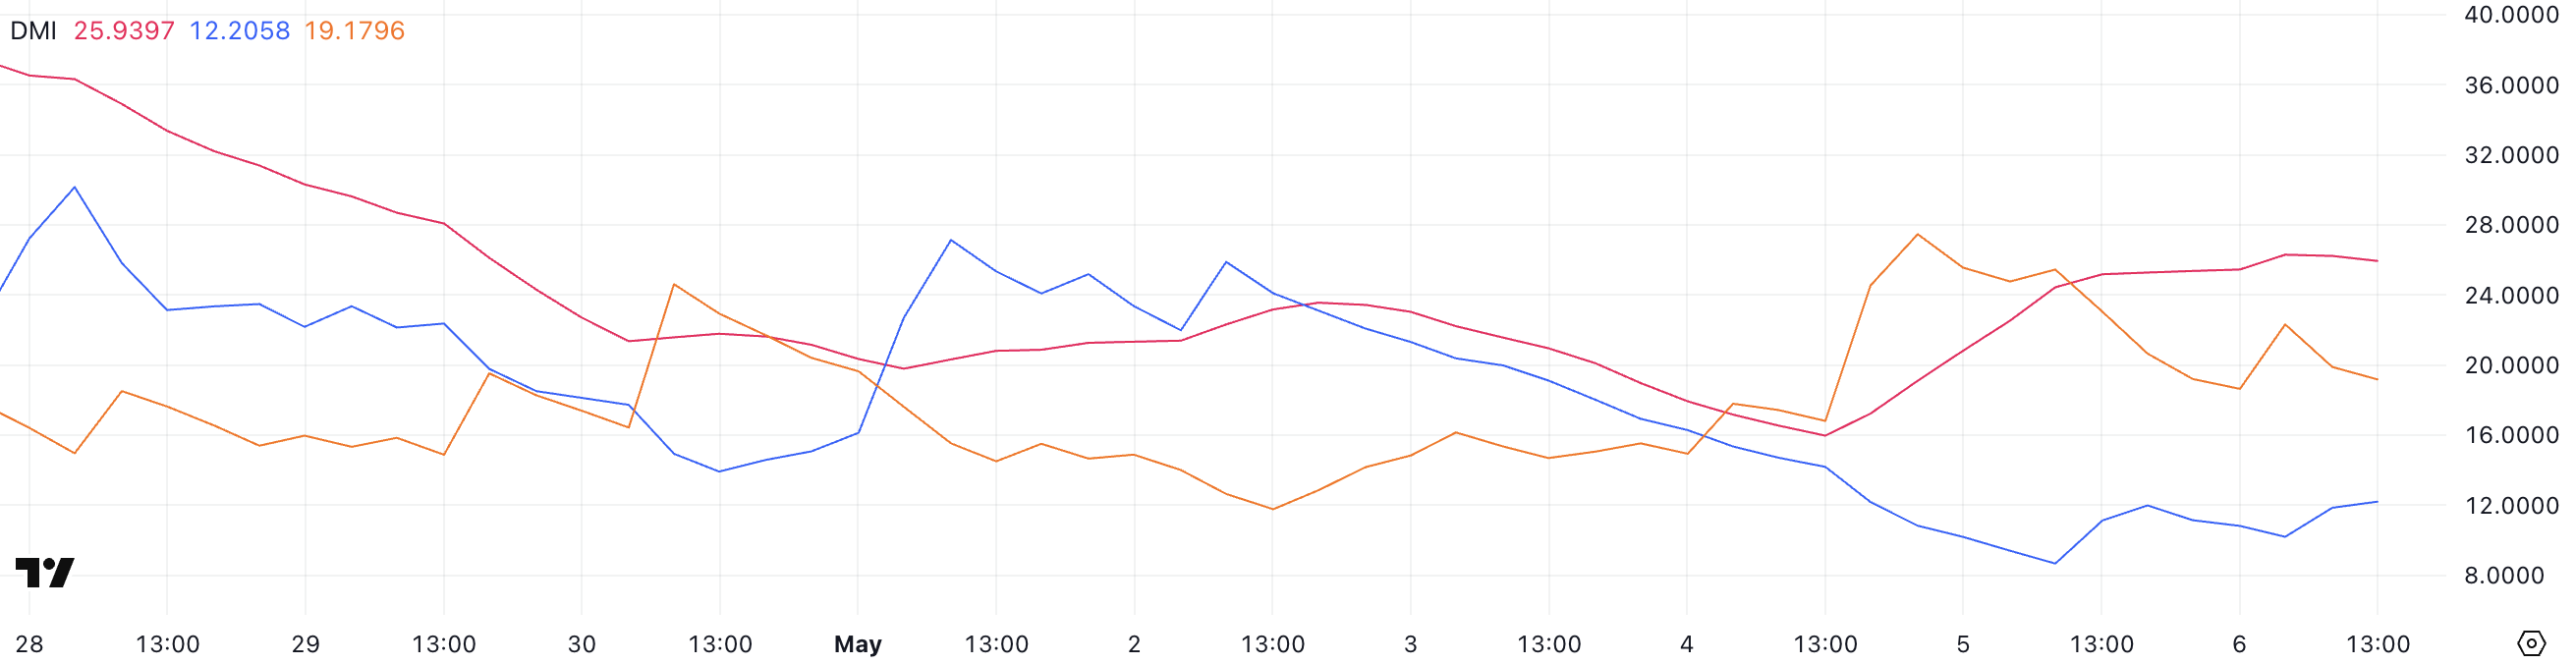
Bitcoin’s Directional Movement Index (DMI) is showing a notable shift.
The ADX, which measures the strength of a trend regardless of direction, has climbed sharply to 25.93, up from 15.97 just two days ago—crossing the key 25 threshold that signals a trend is starting to gain traction.
This rising ADX suggests that volatility is returning and a new directional move may be forming, even if the direction itself is still unclear.
Looking at the components of the DMI, +DI (bullish strength) has bounced to 12.2, up slightly from yesterday’s low of 8.67 but still down significantly from 21.31 three days ago.
Meanwhile, -DI (bearish strength) is at 19.17, slightly off its peak of 25.44 but still higher than three days ago. This indicates that although the recent bearish momentum has cooled somewhat, sellers still have the upper hand.
With ADX rising and -DI leading, Bitcoin could remain under pressure unless +DI recovers sharply in the coming days.
Bitcoin Trapped Below the Cloud as Momentum Stalls
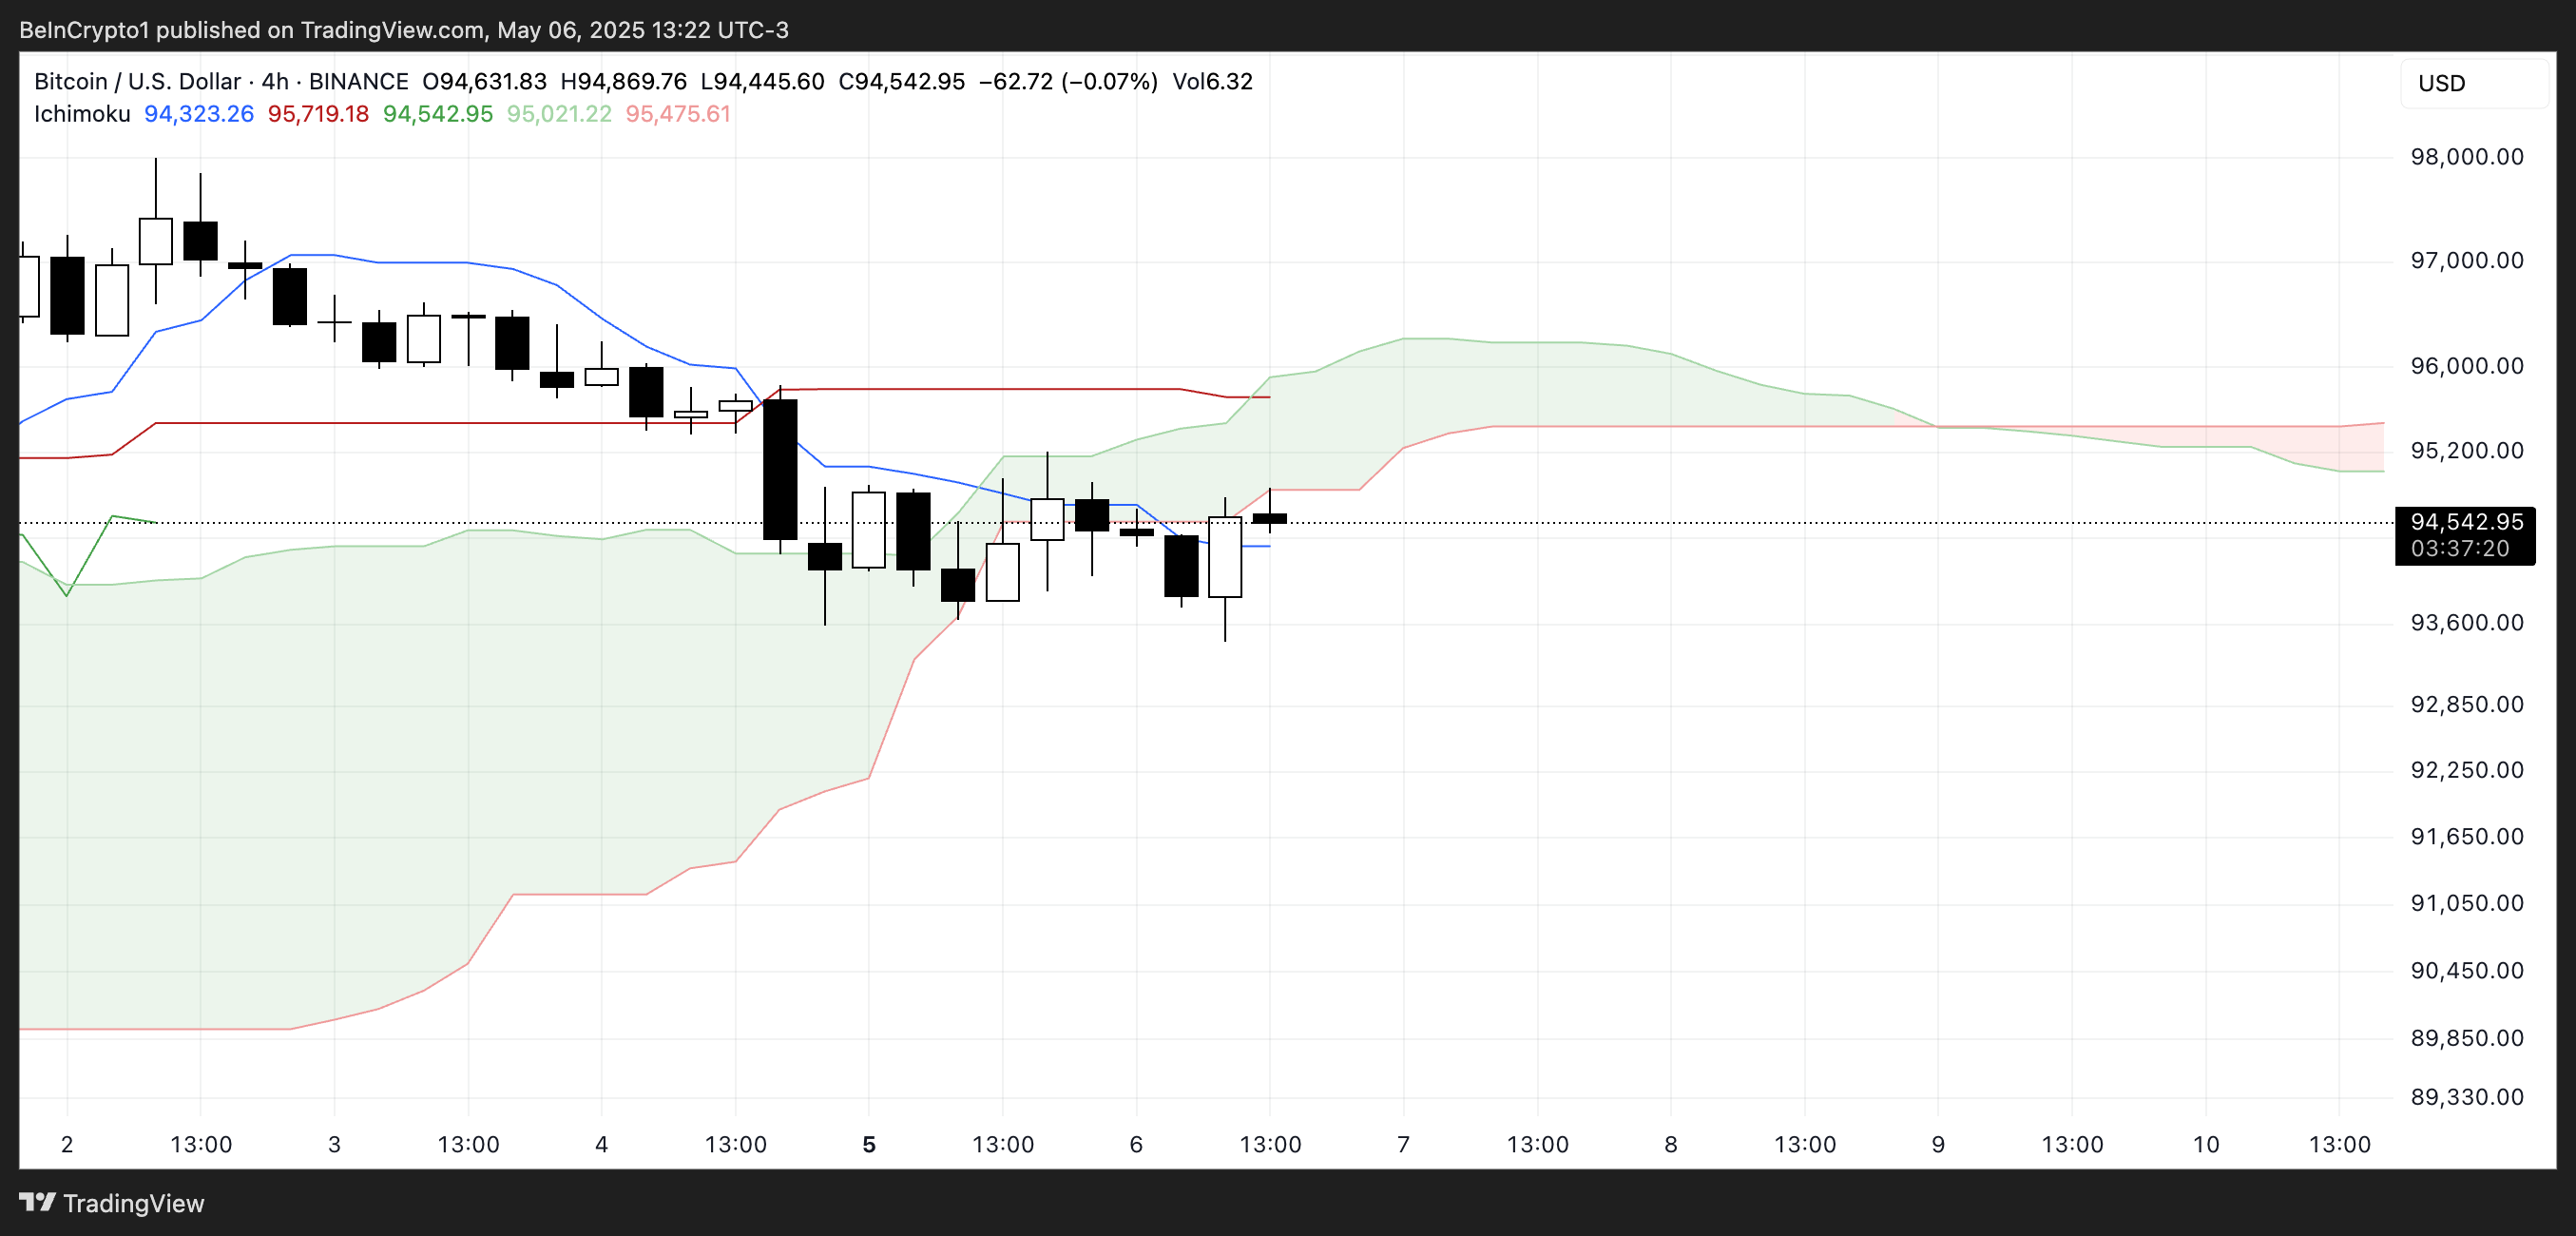
The current Ichimoku Cloud chart for Bitcoin reflects a market in consolidation, with a slight bearish undertone. Price action is sitting very close to the blue Kijun-sen (baseline), which typically represents medium-term trend momentum.
Trading beneath this line suggests that BTC lacks the strength to reclaim bullish momentum in the short term. The white candlesticks hovering near the cloud’s lower boundary indicate indecision among traders, with no clear breakout in sight.
The green Kumo (cloud) itself is relatively thin at this stage, hinting at a fragile support zone that could easily be broken if bearish pressure returns.
Looking ahead, the red Senkou Span B—the top of the projected cloud—is acting as dynamic resistance, capping any upward attempts. For a stronger bullish signal, BTC would need to close decisively above both the Kijun-sen and the entire cloud.
Complicating matters further, the Tenkan-sen (conversion line) is flat and overlapping with the Kijun-sen, signaling weak momentum and a lack of direction. Flat Tenkan and Kijun lines often precede sideways movement or delayed trend development.
Until Bitcoin breaks convincingly above the cloud with rising volume, the current setup leans neutral to bearish, with price trapped in a zone of low conviction and limited momentum.
Bitcoin Holds Key Support as $100,000 Reclaim Hangs in the Balance
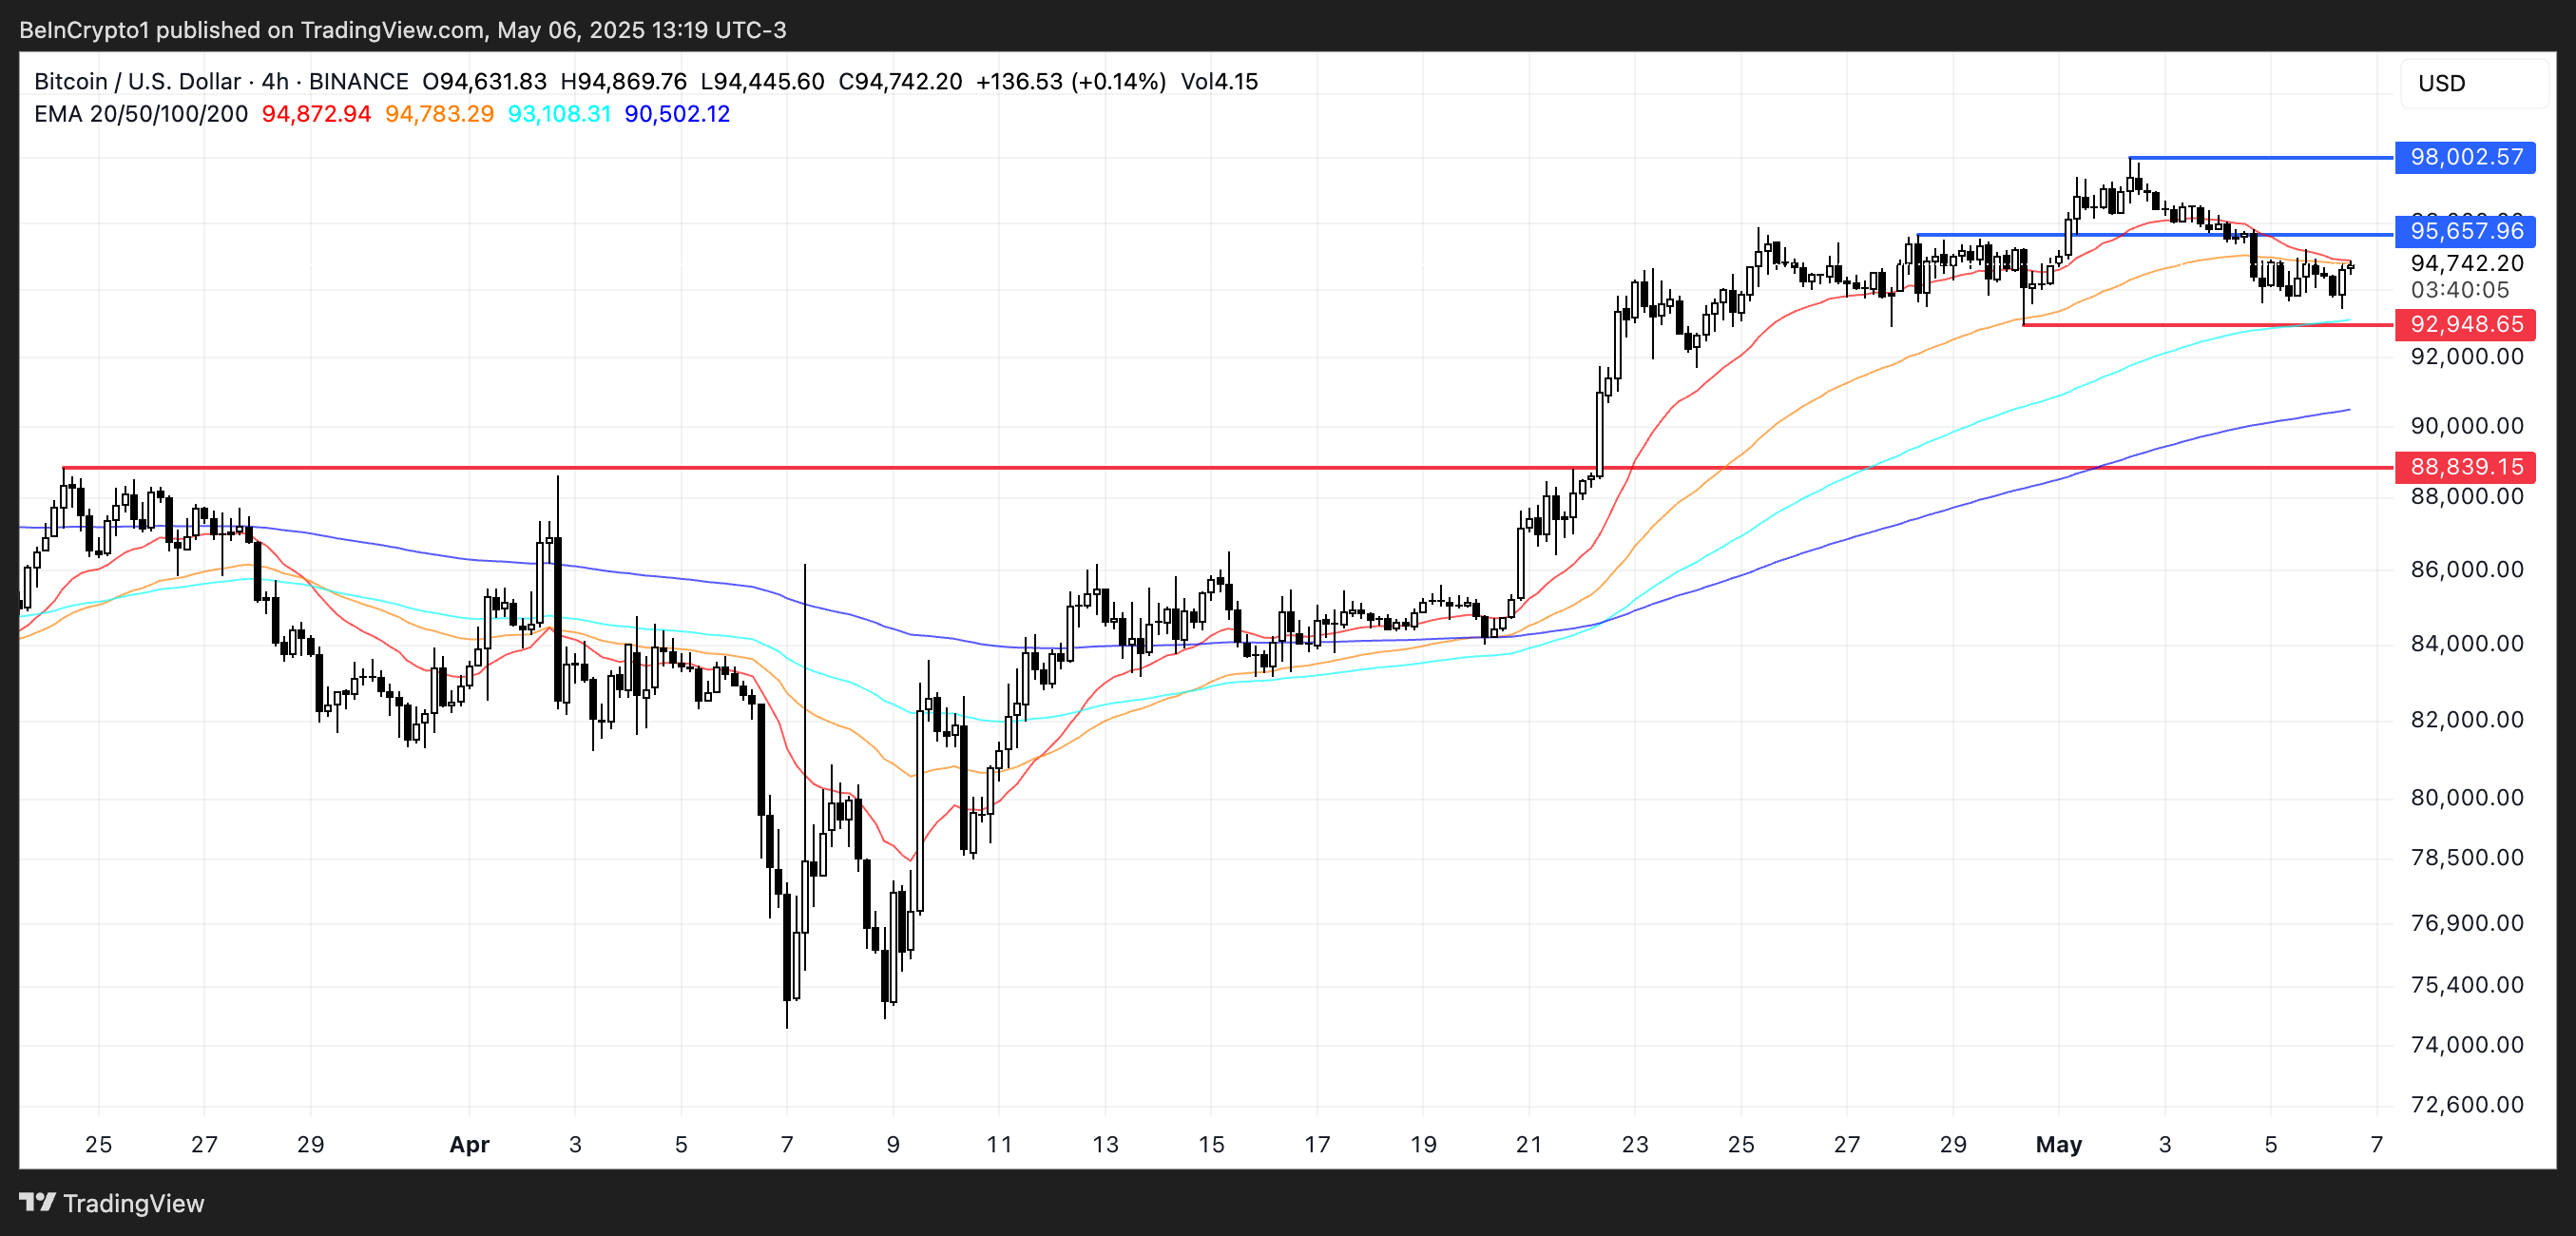
Bitcoin price has remained resilient above the $90,000 level since April 22, repeatedly holding support near $92,945 despite broader market uncertainty. The exponential moving averages (EMAs) still reflect a bullish structure, with short-term averages positioned above long-term ones.
However, there are early signs of weakening momentum, as the short-term EMAs have begun to slope downward—an indication that buyers may be losing strength soon.
If BTC fails to hold its key support, a drop toward $88,839 could follow, breaking the structure that has held for over two weeks.
Still, some analysts remain confident. Nick Purin, founder of The Coin Bureau, believes Bitcoin is well-positioned to reclaim the $100,000 mark, even as markets brace for volatility surrounding the upcoming FOMC meeting:
“It will be a volatile week. Firstly, we have the FOMC meeting tomorrow. While it’s pretty clear there will be no rate cuts, it’s what Chair Powell says that could move the markets. On top of that, trading volume is low and the long/short ratio is sitting at 50/50, which means that, yet again, BTC can swing in either direction from here. The good news is that there’s a great deal of buying interest around the $90,000-$93,000 range, so a dip to those levels is nothing to be concerned about – it will likely bounce back. And overall, the BTC/USD chart is looking strong as it continues to print higher lows.” – Purin told BeInCrypto.
Nick states how Fed next decisions could influence the market in the next months:
“If the Fed surprises with some dovish tones as well as guidance for rate cuts in June, there’s room for Bitcoin to rally all the way back up to that $100,000 level, which remains a liquidity magnet. But even if Powell strikes a hawkish tone, the impact on BTC will likely be minimal. There’s simply too much positive momentum – spot BTC ETFs are hoovering up assets, corporates are building up BTC treasuries and the correlation between Bitcoin and stocks is breaking down. On top of this, historic data shows that BTC has posted gains during nine out of the last 12 Mays. So, despite the likelihood of heightened volatility, the near future is looking promising. As such, following the old adage of ‘sell in May’ would be madness at this point.” – Purin told BeInCrypto.
A recovery in momentum could first drive BTC to retest resistance at $95,657, with a breakout potentially leading to $98,002 and eventually a challenge of the psychological $100,000 level.
With macro headwinds and technical crossroads converging this week, the next move will likely hinge on how BTC responds to its support zone and how broader market sentiment reacts to Fed commentary.
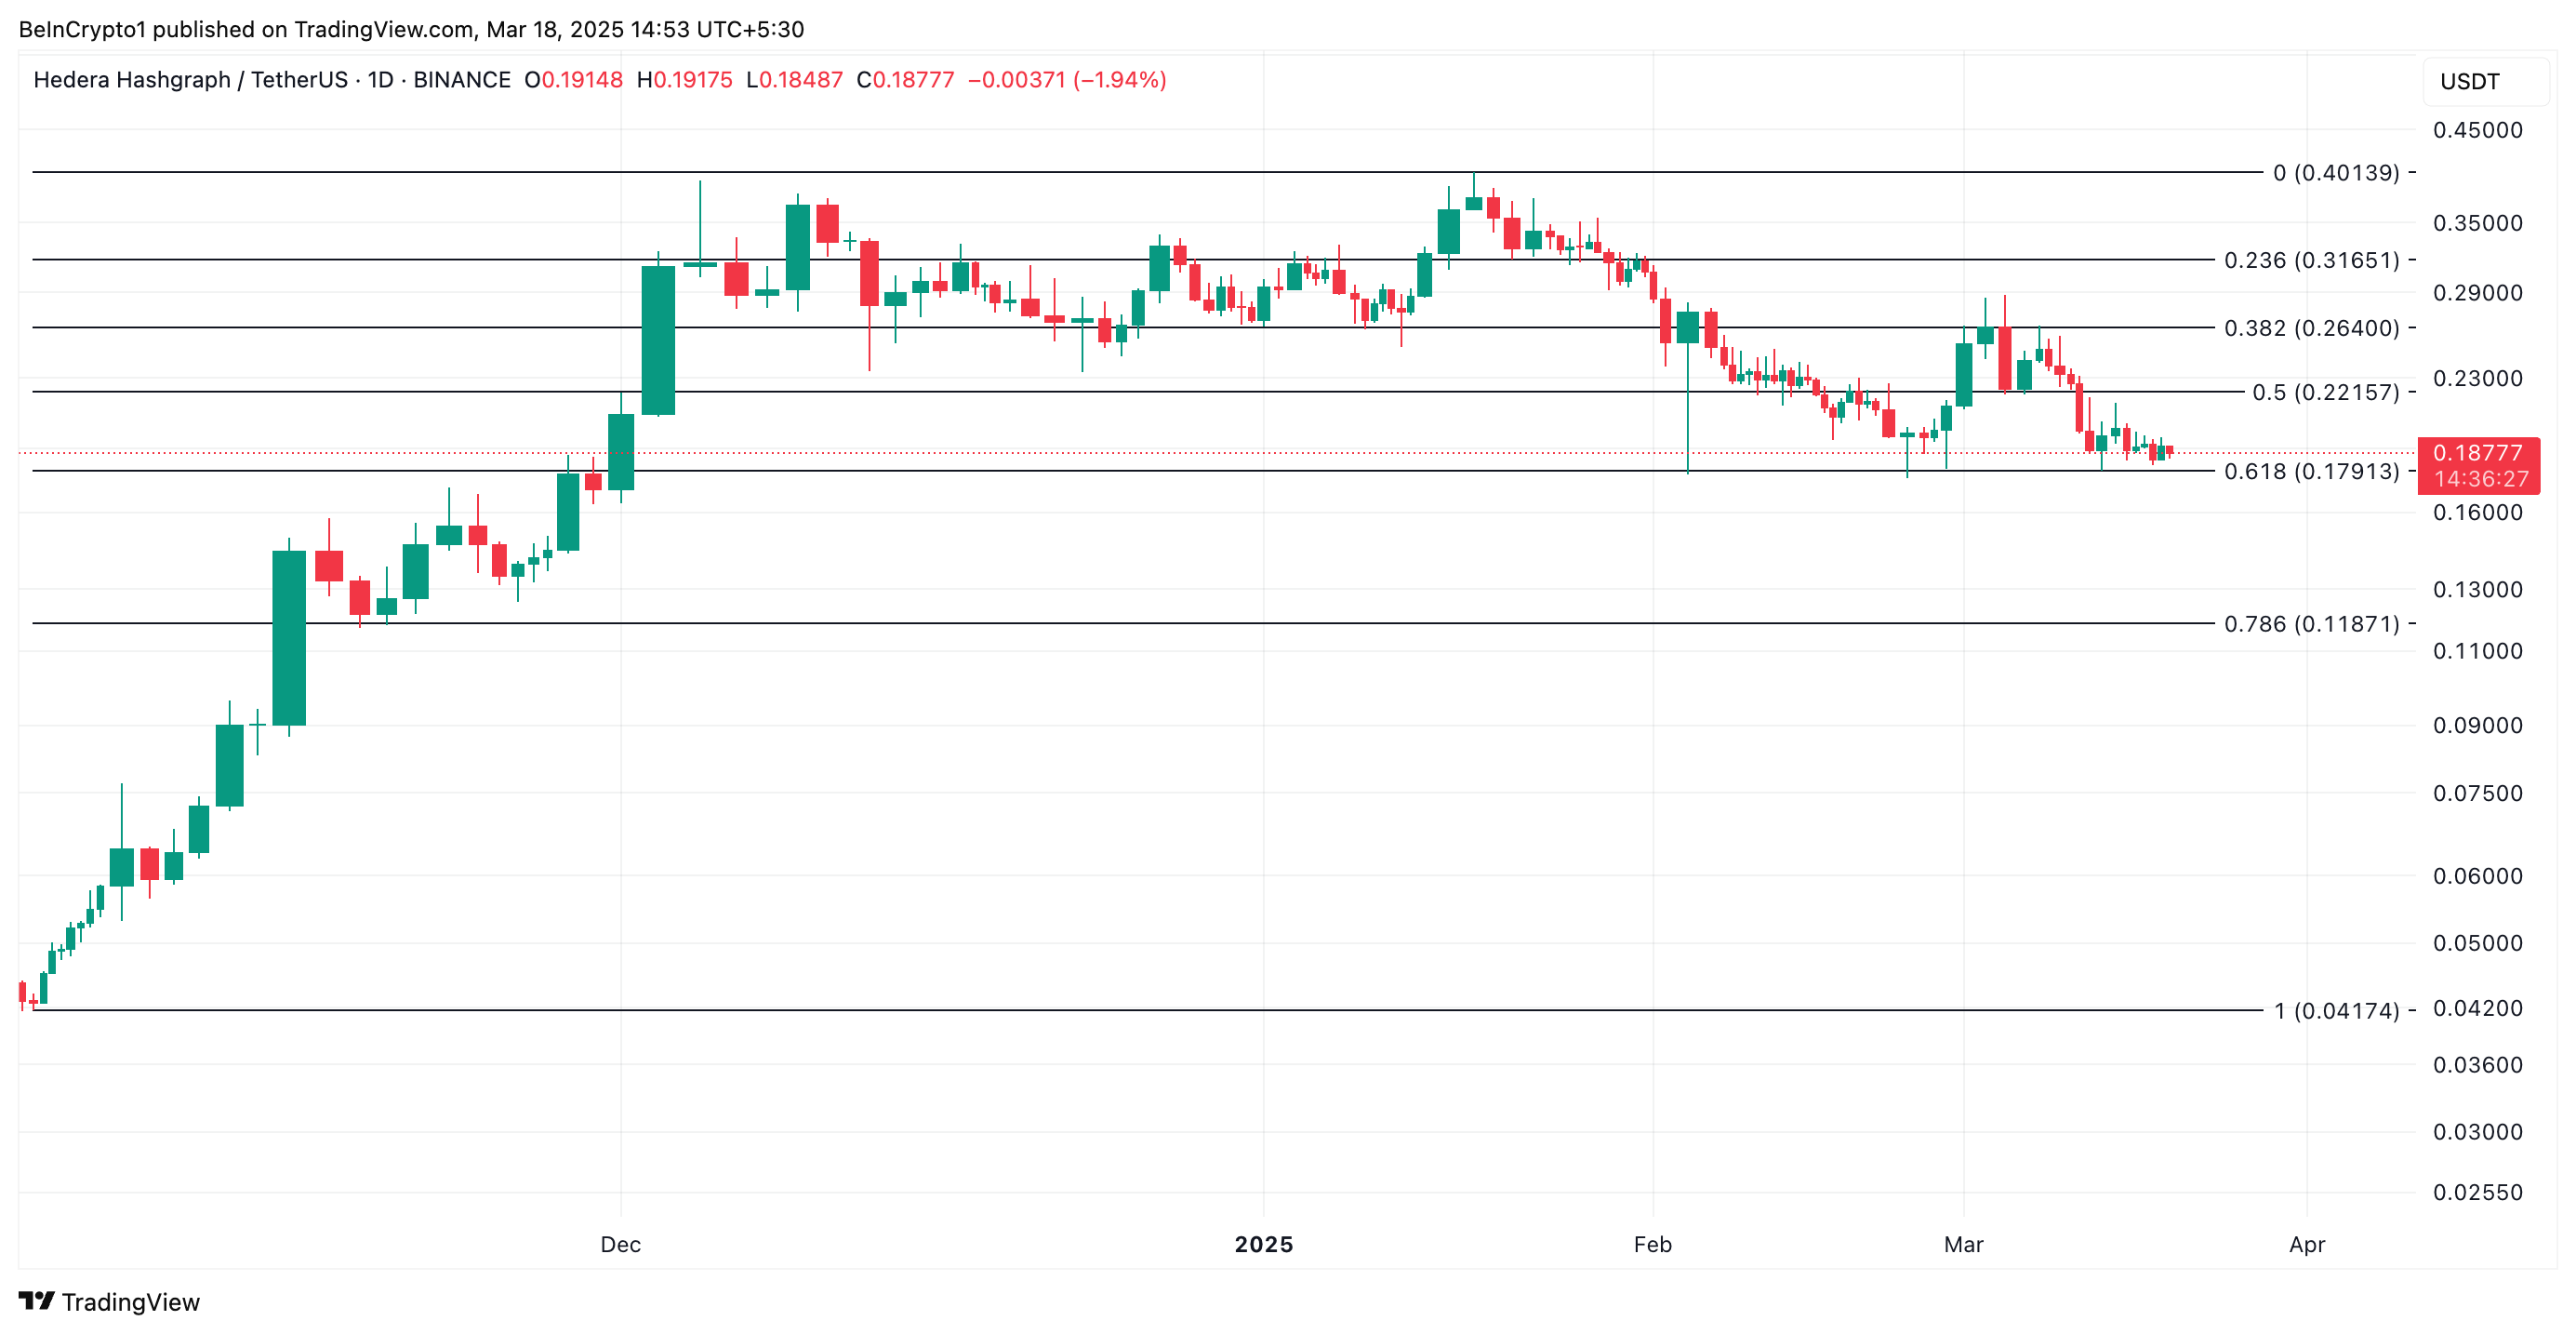
Hedera remains under heavy pressure, marking yet another day of decline as traders continue to bet against the altcoin. It trades at $0.18 at press time, noting a 2% price drop over the past 24 hours.
With its long/short ratio signaling a surge in short interest, market sentiment has turned increasingly pessimistic.
Short Sellers Tighten Grip on HBAR
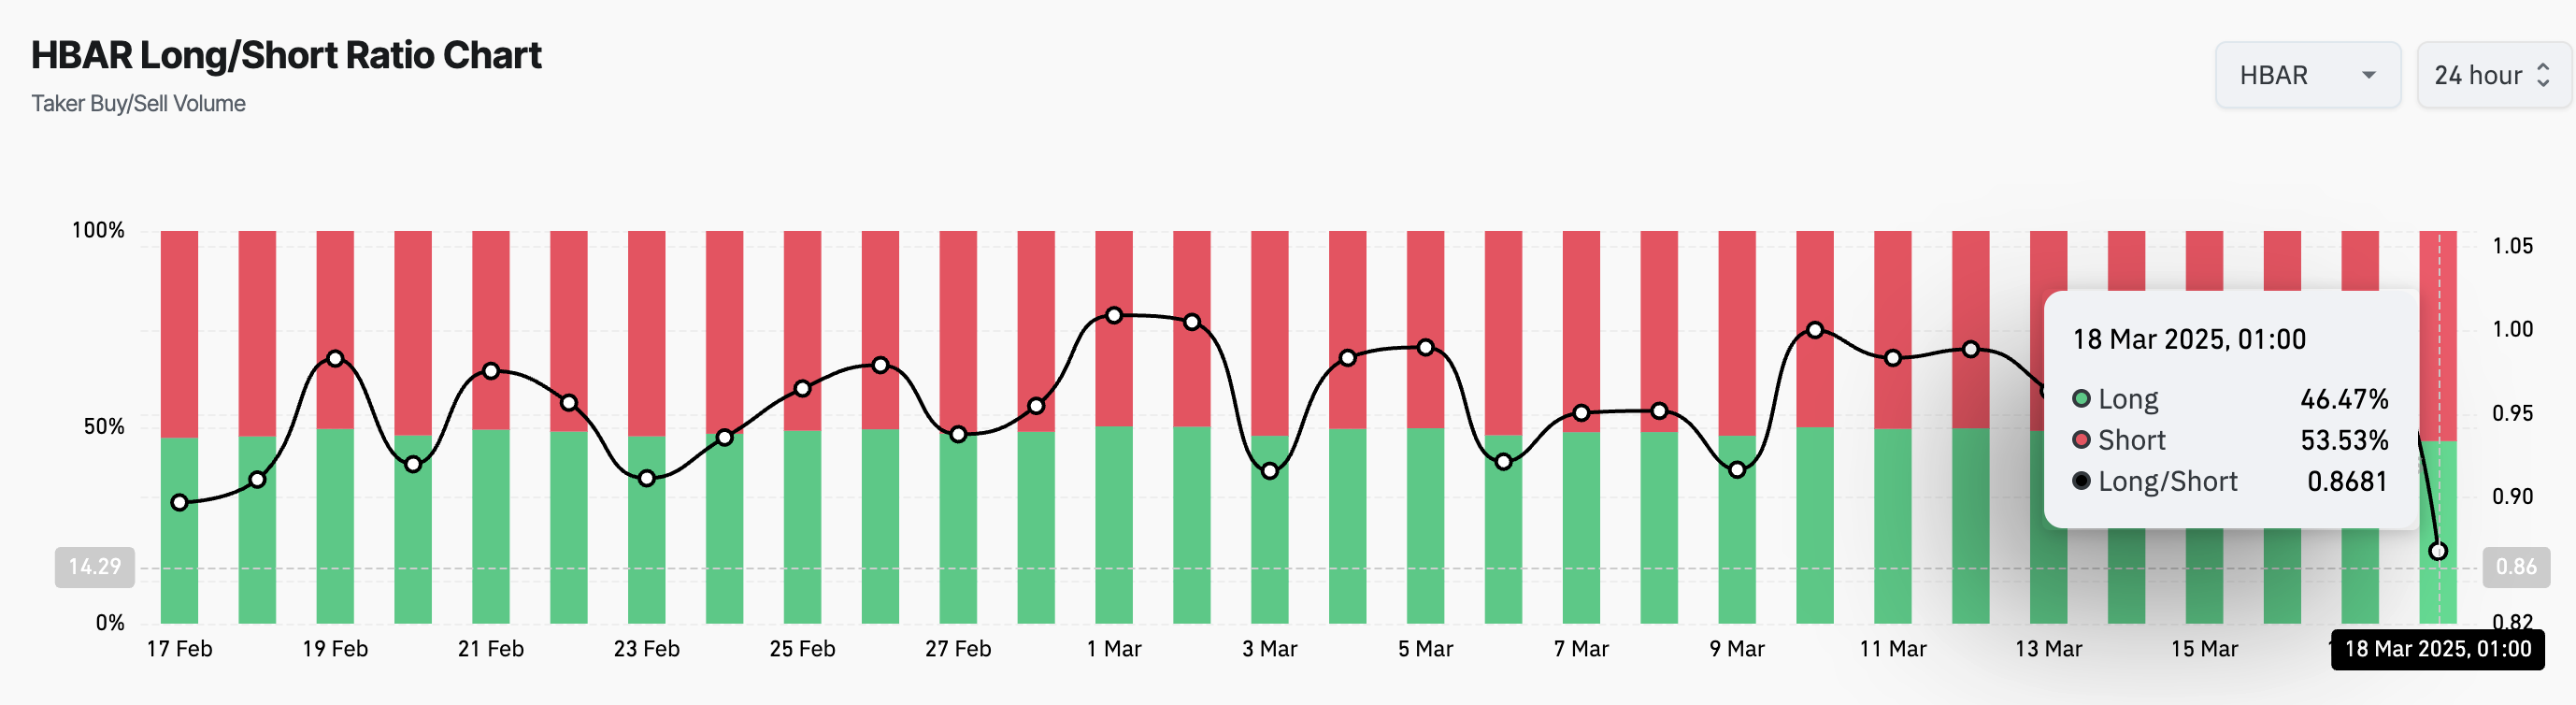
HBAR’s long/short ratio has dropped to 0.86, its lowest level in a month. This reflects a sharp increase in short positions among derivatives traders.
The long/short ratio measures the proportion of long positions (bets on price increases) to short positions (bets on price declines) in the market. A ratio below one means there are more short positions than long ones. This indicates that traders are predominantly bearish on HBAR and hints at a higher likelihood of continued downside movement.
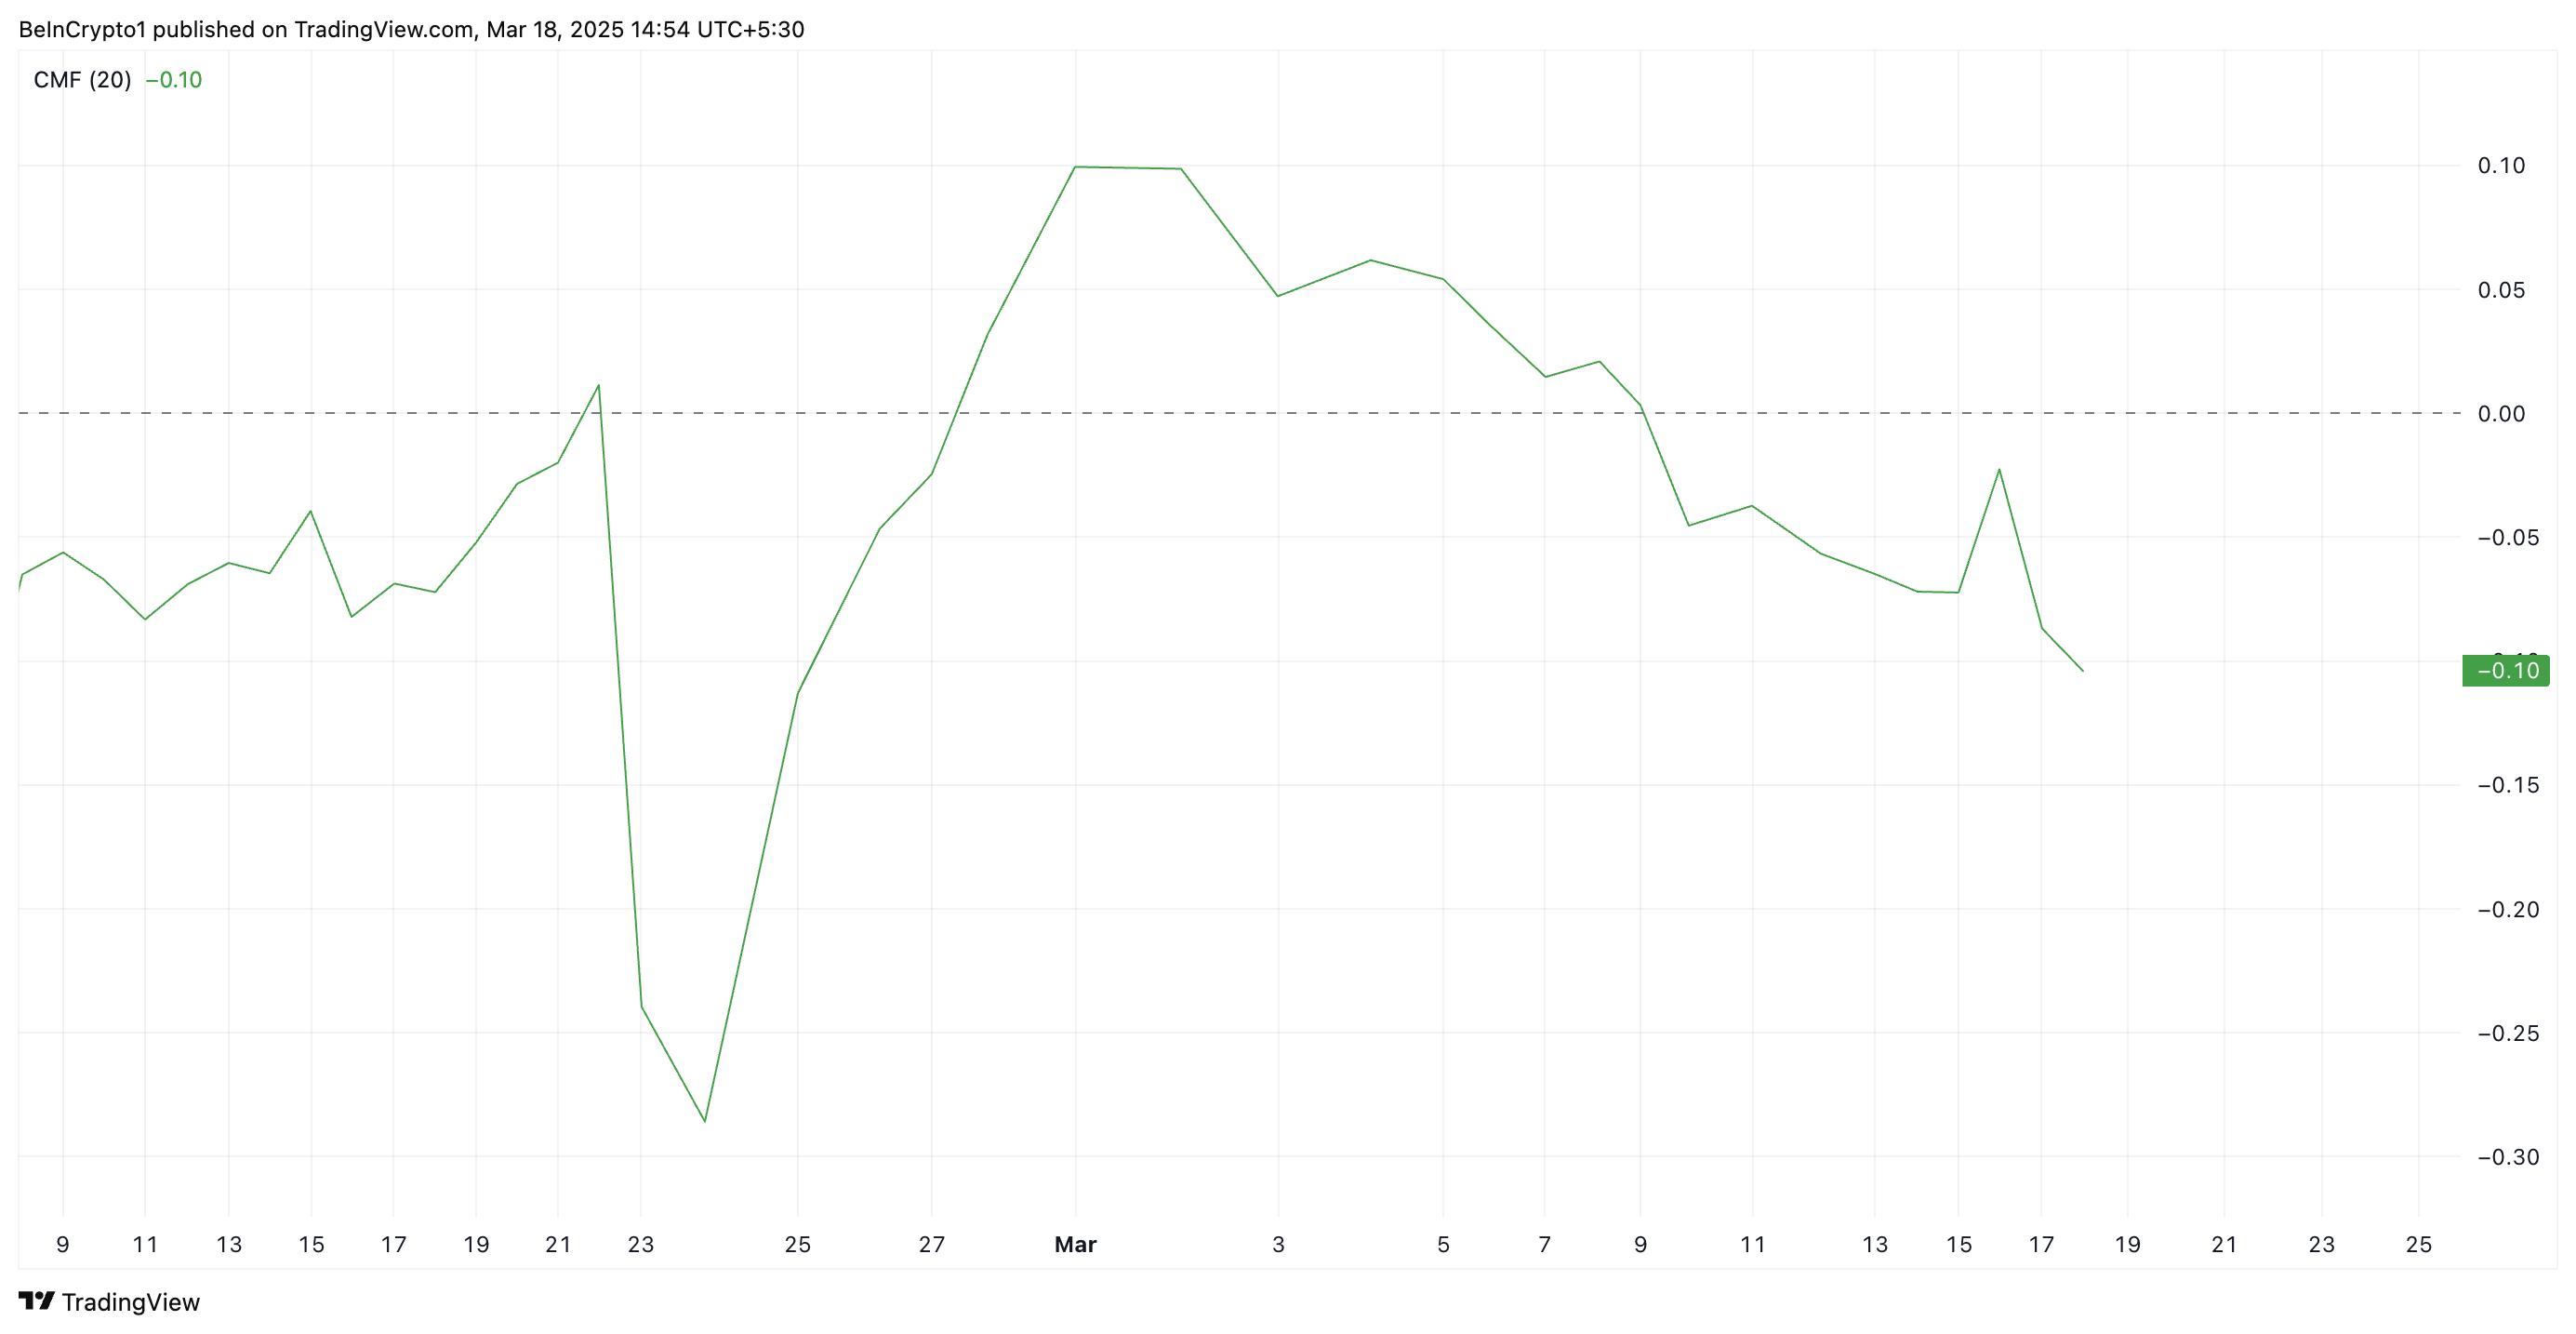
Further, HBAR’s negative Chaikin Money Flow (CMF) on the daily chart supports this bearish outlook. This indicator, which measures how money flows into and out of the asset, is below zero at -0.10 when writing.
HBAR’s negative CMF reading suggests high selling activity, with its sellers dominating the market and looking to push prices lower.
HBAR Traders Brace for Volatility as Price Flirts with Key Support Levels
The growing demand for short positions highlights investors’ expectations of further downside, raising concerns about HBAR’s ability to hold above the critical support level formed at $0.17.
If it fails to hold, the token’s price could plummet to a multi-month low of $0.11, which it last traded at in November.
However, a resurgence in demand for the altcoin could invalidate this bearish projection. If buyers regain market dominance and increase demand, HBAR could rebound toward $0.22.
Ethena Labs is officially closing its German branch and EU operations after a previous MiCA application rejection. For the past month, the firm has been preparing to withdraw from this market.
Although the exit was anticipated, ENA reacted notably, with the altcoin falling over 7% after today’s announcement.
At the time, the firm suggested that this was a minor setback and that it would focus on other markets. Today, it announced that its German branch is winding down altogether.
“We have agreed with BaFin to wind down all activities of Ethena GmbH and will no longer be pursuing the MiCAR authorization in Germany. All whitelisted… users previously interacting with Ethena GmbH have at their request been onboarded with Ethena (BVI) Limited instead. As a result, Ethena GmbH no longer has any direct customers,” it claimed.
The statement further claimed that Ethena GmbH, the German branch, “has not conducted any mint or redeem activity” since the regulators’ MiCA ruling.
Specifically, regulators banned all sales of the USDe stablecoin, putting serious restrictions on the firm. In other words, this outcome is fairly expected. Ethena (BVI) Limited has taken over the German branch’s users.
The network’s governance token, ENA, has seen notable price swings around its MiCA efforts. In Early March, when Ethena Labs was reportedly on track to receive regulatory approval, ENA broke out of multi-month lows and nearly reached $2.5 billion in mark cap.
However, since the rejection, ENA saw continued bearish pressure, which was exacerbated by the macroeconomic conditions across the market. Today’s announcement drove further decline.