XRP is showing strength after breaking above a key Fibonacci resistance area earlier this week. This upward move followed positive market sentiment, likely driven by recent developments around crypto-based ETFs. While the structure of the rally remains complex, analysts are closely watching several important price levels for signs of continued bullish rally.
Short-Term Structure Supports Further Upside
XRP has continued to form higher highs and higher lows, a classic sign of upward momentum. Price action is currently following a diagonal wave pattern, a type of bullish structure that is less powerful than a strong impulsive trend but can still support further gains.
The recent swing low at $2.11–$2.12 (April 24) now serves as a critical support level. As long as XRP stays above this range, the bullish scenario remains intact. A drop below this level would call for a re-evaluation of the short-term structure.
The next upside targets are in the $2.46 to $2.55 range. This area aligns with the 138% Fibonacci extension level, which is often considered a key milestone in wave-based analysis. Reaching this zone would complete a larger third wave in the current five-wave pattern.
Larger Structure Still Unclear, But Bullish Signs Emerging
XRP is still trading within a long-term descending parallel channel on the daily timeframe, meaning the broader trend remains bearish for now. However, there are growing signs that this trend may be losing strength.
On the 3-day chart, the bearish divergence in the RSI—active since earlier in the year—is close to being invalidated. If the RSI moves above its previous high, and the price breaks out above the $2.50 level, that would serve as a strong signal of a trend reversal.
This would shift XRP out of short-term relief rallies and into a more defined bullish trend.
Pi Network price has fallen by 48% in one month, but the Pi Coin community remains optimistic that a surge in utility and institutional adoption from top banks will fuel a recovery. So far, Pi Coin has been adopted as a means of payment by multiple businesses. This has fuelled speculation that major banks on Wall Street will adopt Pi Network. If this happens, what will happen to PI price? Let’s explore.
Pi Network Price Analysis If Top Banks Start Using Pi Network
Pi Network price has struggled under bearish headwinds in recent weeks. Factors such as token unlocks and concerns about transparency have impacted investor confidence and caused a lack of fresh interest from buyers.
However, Pi Network has also expanded its presence in the US after being named an affiliate member of Stanford. Pi Coin also entered the trillion-dollar US real estate market after being adopted by Florida-based Zito Realty.
These instances have fuelled speculation that the Pi Network token will receive the attention of leading US banks, including JPMorgan and Bank of America. If these banks adopt Pi Network to integrate blockchain in services like payments and remittances, Pi Coin price will surge.
Grok3 also estimates that if top banks start using Pi Network, the price will soar to as high as $30. It stated,
“A moderate estimate of $10–$30 is plausible if banks integrate PI for significant use cases, aligning with some analyst predictions.”
This bullish Pi Network price prediction is achievable as the project is quickly gaining adoption across the Web3 industry after the recent partnership with Banxa and integration with Chainlink Data Streams.
Meanwhile, popular analyst Dr Altcoin recently stated that one of the main factors that will prevent Pi Coin price from falling is institutional adoption. However, he also opined that the blockchain would have to undergo upgrades for this to happen.
Pi Coin Price Defends Support, Eyes Recovery
The one-hour Pi Network price chart shows that the token is defending support at $0.60. Looking at past performance, this support level is crucial to the performance of the token. If Pi Coin can make a decisive close above this support level, it may record a relief rally. Conversely, if it breaches this support, it will cause a downswing.
If Pi Coin extends its rally above this support level, it faces the next resistance at $0.64. Moving above this level will place the next target price for the token at $0.73.
Meanwhile, the MACD line is rising, despite remaining in the negative region. This suggests that the downtrend is weakening. The MACD line needs to cross above the zero line to confirm that the trend has changed to bullish.
PI/USDT: 1-Hour Chart
Considering the speculation that the Pi Network token may receive adoption from top US banks, bullish momentum is surging around it, which may spark a rebound. At the same time, the one-hour Pi Coin chart indicates the altcoin may be poised for a recovery after the recent dip.
Corporate Bitcoin adoption continues its proliferation as more companies pursue accumulation strategies for their treasuries. Firms can benefit from capital appreciation, diversification, and an inflation hedge if executed properly.
However, not all Bitcoin acquisition strategies are created equal. If a company’s sole purpose is to hold BTC without sufficient resources or scale, it can risk total collapse during extended bear market periods. A chain reaction could further amplify downward pressure that could prove catastrophic.
Varying Approaches to Corporate Bitcoin Holdings
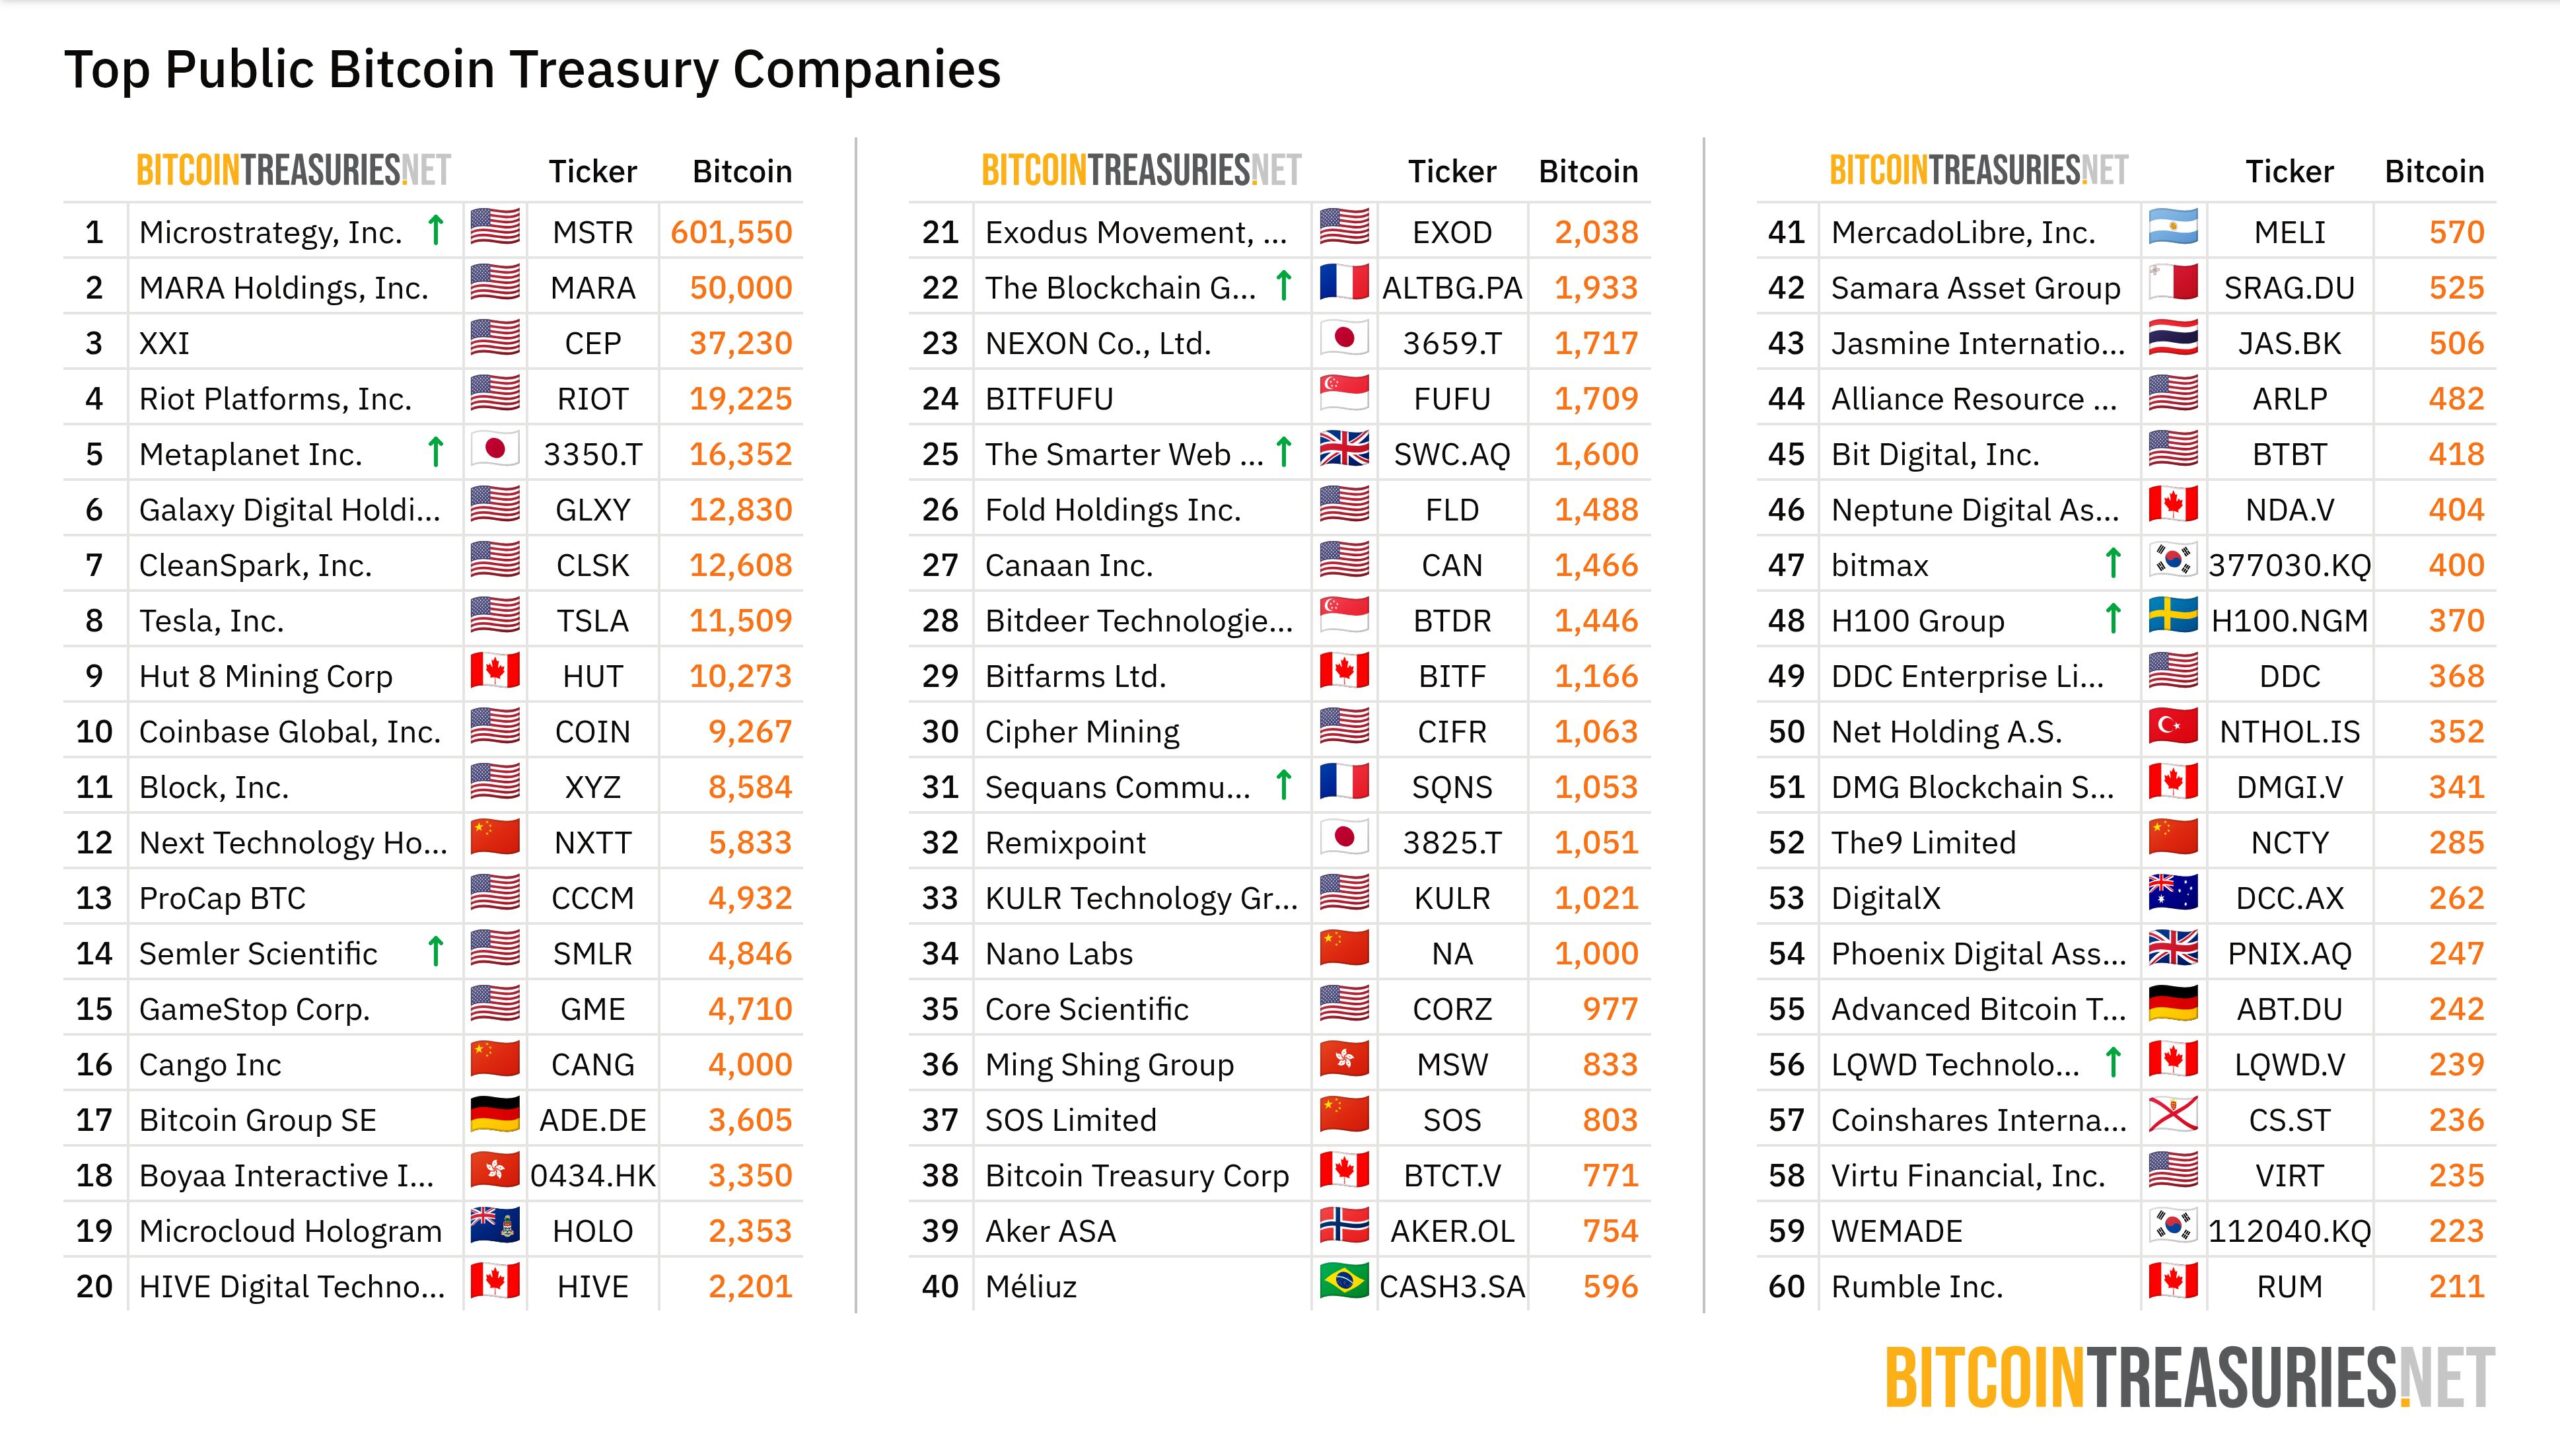
Institutional Bitcoin adoption is rising worldwide, with Bitcoin Treasuries data indicating that holdings have doubled since 2024. Public companies now collectively own over 4% of the total Bitcoin supply.
Interestingly, this increase in volume also represents a broadening range of reasons for doing so.
Some companies, most notably Strategy (formerly MicroStrategy), intentionally pursue such a playbook to become a Bitcoin treasury holding company. The move worked well for Strategy, whose supply accounts for 53% of total company holdings with over 580,000 BTC.
Other firms, like GameStop or PublicSquare, have taken a different approach, prioritizing exposure over aggressive accumulation. This scenario is optimal for firms that simply want to add BTC to their balance sheets while continuing to focus on their core businesses.
Initiatives like this carry far less risk than companies whose core business solely holds Bitcoin.
However, the increasing trend of companies adding Bitcoin to their financial reserves solely to dedicate themselves to holding Bitcoin carries profound implications for their businesses and Bitcoin’s future.
How Do Bitcoin-Focused Companies Attract Investors?
Building a successful Bitcoin treasury holding company involves much more than just aggressively buying Bitcoin. When a business’s sole purpose becomes Bitcoin holding, it will be exclusively valued based on the Bitcoin it holds.
To attract investors to buy their stock rather than just holding Bitcoin directly, these companies must outperform Bitcoin itself, reaching a premium known as Multiple on Net Asset Value (MNAV).
In other words, they must convince the market that their stock is worth more than the sum of its Bitcoin holdings.
Strategy implements this, for example, by convincing investors that by buying MSTR stock, they aren’t just purchasing a fixed amount of Bitcoin. Instead, they’re investing in a strategy where management actively works to increase the amount of Bitcoin attributed to each share.
If investors believe MicroStrategy can consistently grow its Bitcoin per share, they will pay a premium for that dual ability.
However, that’s just one part of the equation. If investors buy into that promise, Strategy has to deliver by raising capital to buy more Bitcoin.
The MNAV Premium: How It’s Built, How It Breaks
A company can only deliver an MNAV premium if it increases the total amount of Bitcoin it holds. Strategy does this by issuing convertible debt, which allows it to borrow funds at low interest rates.
It also leverages At-The-Market (ATM) equity offerings by selling new shares when their stock trades at a premium to its underlying Bitcoin value. Such a move enables Strategy to acquire more Bitcoin per dollar raised than existing shares, increasing Bitcoin per share for current holders.
This self-reinforcing cycle—where a premium allows efficient capital raises, which fund more Bitcoin, strengthening the narrative—helps sustain the elevated stock valuation beyond Strategy’s direct Bitcoin holdings.
However, such a process involves several risks. For many companies, the model is directly unsustainable. Even a pioneer like Strategy endured heightened stress when Bitcoin’s price dropped.
Nonetheless, over 60 companies have already adopted a Bitcoin-accumulating playbook during the first half of 2025. As that number grows, new treasury companies will face the associated risks even more acutely.
Aggressive BTC Accumulation Risks for Small Players
Unlike Strategy, most companies lack scale, an established reputation, and the “guru status” of a leader like Michael Saylor. These characteristics are crucial for attracting and retaining the investor confidence needed for a premium.
They also don’t generally have the same creditworthiness or market power. Knowing this, smaller players will likely incur higher interest rates on their debt and face more restrictive covenants, making the debt more expensive and harder to manage.
If their debt is collateralized by Bitcoin in a bear market, a price drop can quickly trigger margin calls. During an extended period of downward pressure, refinancing maturing debt becomes extremely difficult and costly for already overburdened companies.
To make matters worse, if these companies have shifted their core operations to focus solely on Bitcoin acquisition, they have no alternative business cushion that generates a stable and separate cash flow. They become entirely dependent on capital raises and Bitcoin’s price appreciation.
When several companies take such a move simultaneously, the consequences for the greater market can go south dramatically.
Does Corporate Bitcoin Adoption Risk a “Death Spiral”?
If many smaller firms pursue a Bitcoin accumulation strategy, the market consequences during a downturn can be severe. If Bitcoin’s price falls, these companies may run out of options and be forced to sell their holdings.
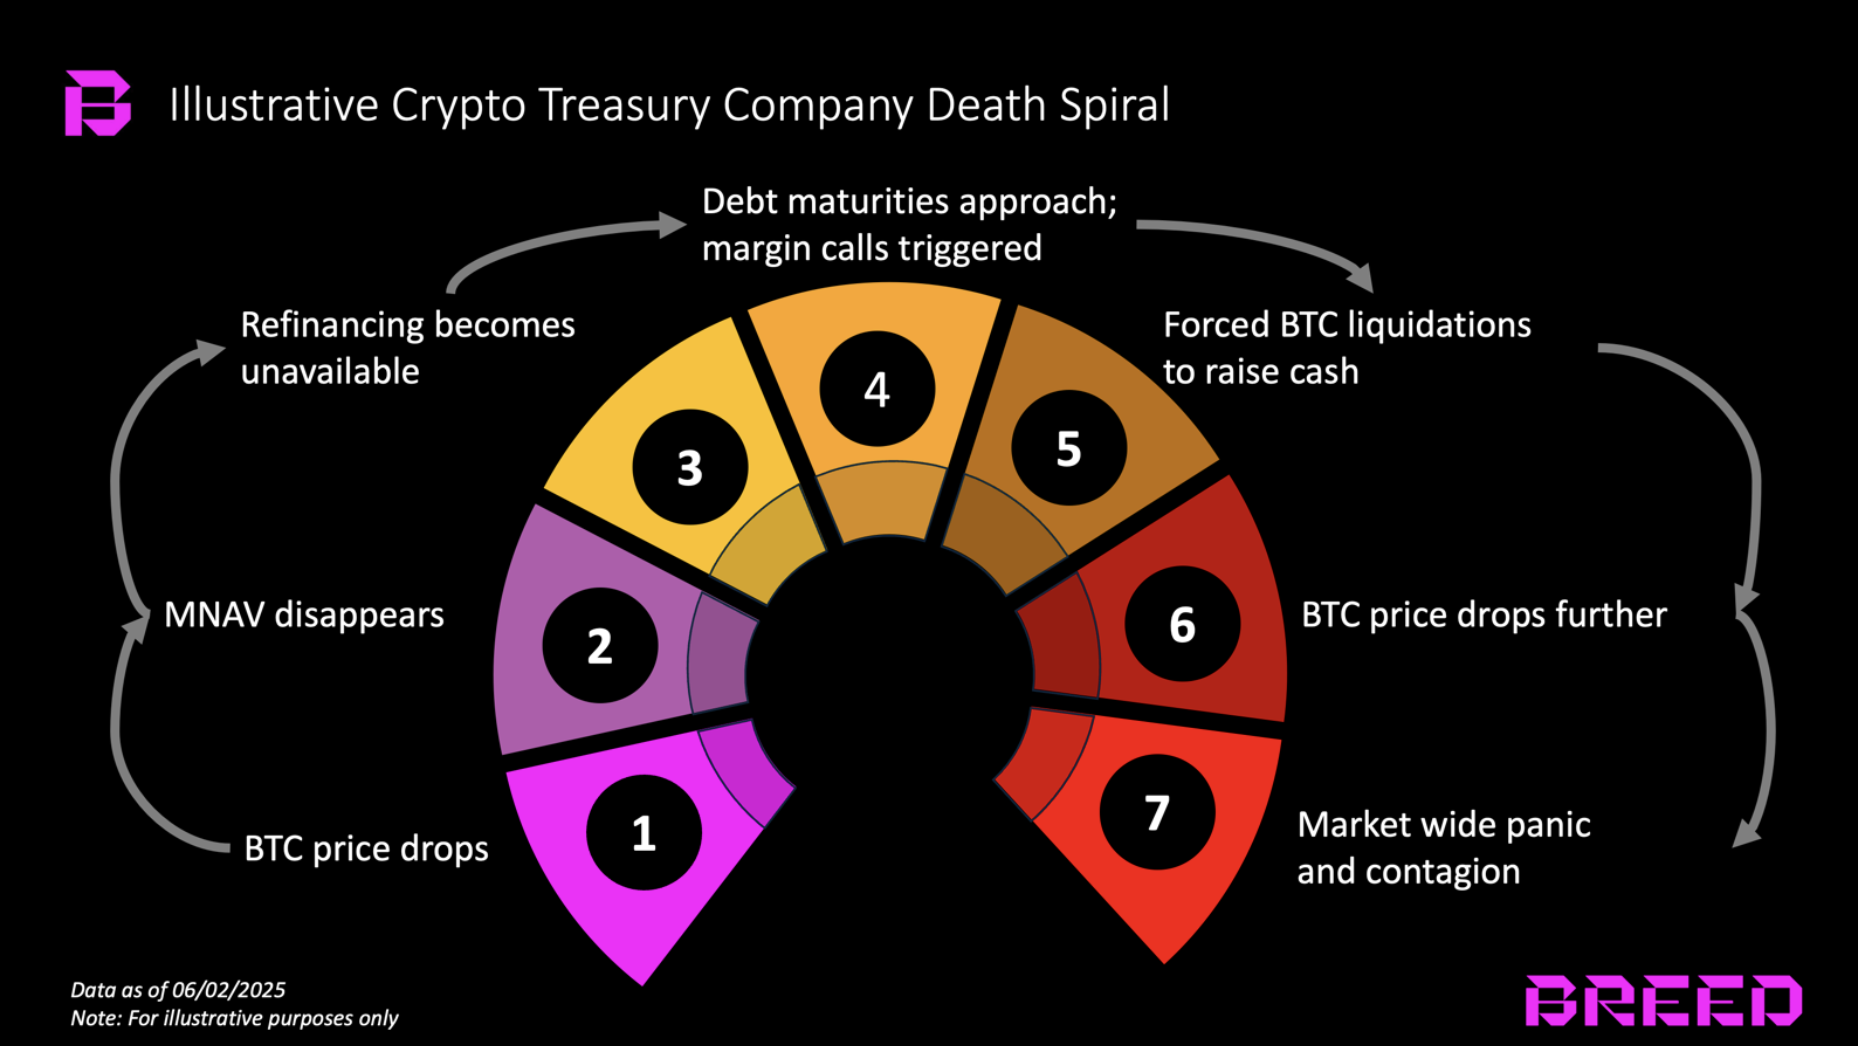
This widespread, distressed selling would inject an enormous supply into the market, significantly amplifying downward pressure. As seen during the 2022 crypto winter, such events can trigger a “reflexive death spiral.”
The different stages of a Bitcoin death spiral. Source: Breed VC.
The forced selling by one distressed company can further drive Bitcoin’s price down, triggering forced liquidations for other firms in a similar position. Such a negative feedback loop can provoke an accelerated market decline.
In turn, highly publicized failures could damage broader investor confidence. This “risk-off” sentiment could lead to widespread selling across other cryptocurrencies due to market correlations and a general flight to safety.
Such a move would also inevitably put regulators on high alert and spook off investors who may have considered investing in Bitcoin at one point.
Beyond Strategy: The Risks of Going “All-In” on Bitcoin
Strategy’s position as a Bitcoin treasury holding company is unique because it was a first mover. Only a handful of companies match Saylor’s resources, market influence, and competitive advantage.
The risks associated with such a playbook are various and, if proliferated, can be detrimental to the greater market. As more public companies move to add Bitcoin to their balance sheets, they must carefully decide between getting some exposure or going all-in.
If they choose the latter, they must cautiously and thoroughly weigh the consequences. Though Bitcoin is currently at all-time highs, a bear market is never entirely out of the question.
A new report from Solidus Labs has revealed that 98.6% of tokens issued on Pump.fun, a popular token creation platform on Solana, are considered scams or involved in fraudulent trading.
Additionally, similar issues have been identified on Raydium, a major decentralized exchange (DEX) on Solana.
Report Reveals Massive Scam Rate on Pump.fun
Solidus Labs, a company specializing in blockchain risk monitoring, released a detailed report on the state of certain platforms on the Solana blockchain. According to the report, Pump.fun has issued over 7 million tokens since its launch in January 2024.
However, only 97,000 of these tokens have maintained a liquidity of at least $1,000, which is less than 1.4% of the total tokens.
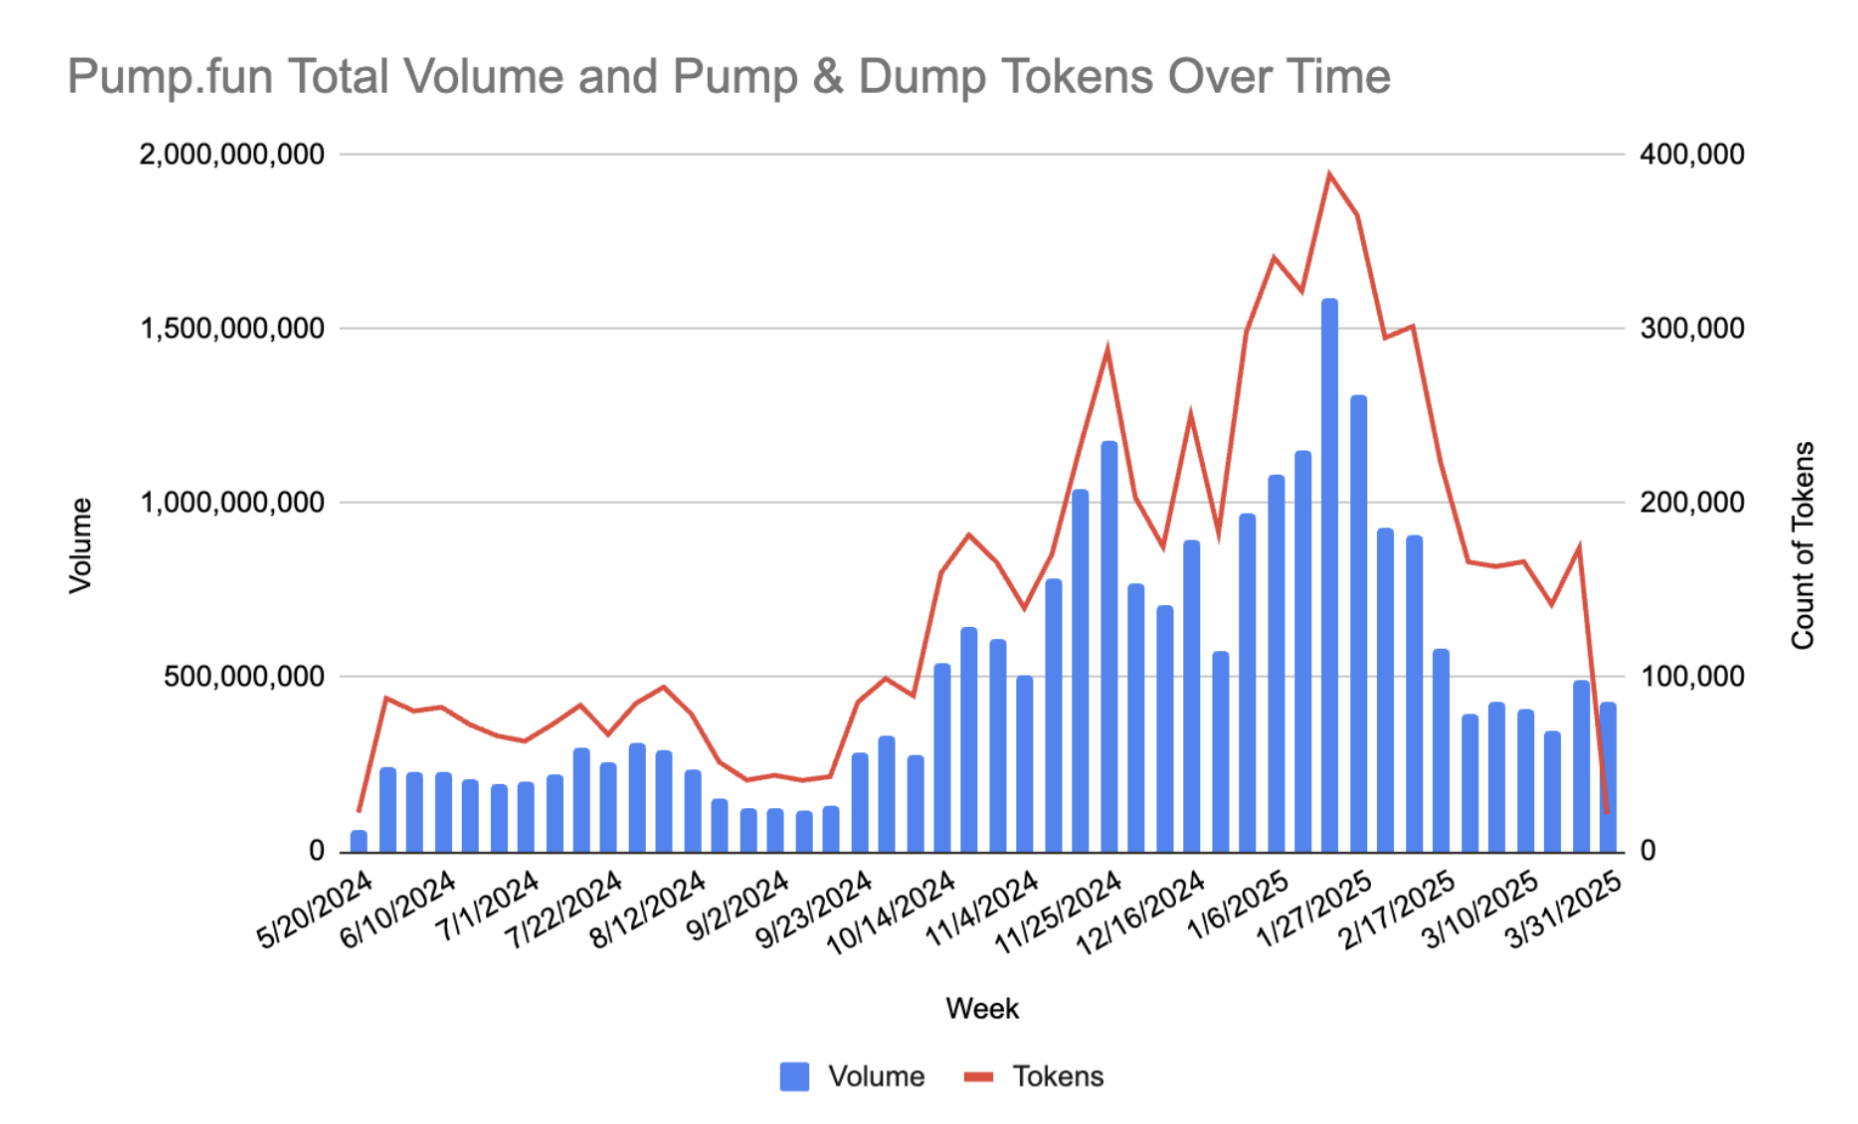
Pump & Dump tokens on Pump.fun. Source: Solidus Labs
More alarmingly, 98.6% of tokens issued on the platform have been identified as scams or show signs of fraudulent trading. One of the largest scams uncovered by Solidus Labs involved MToken, resulting in losses of up to $1.9 million.
“good (in different ways): railgun, farcaster, polymarket, signal. bad (in different ways): pump.fun, Terra/Luna, FTX. The differences in what the app does stem from differences in beliefs in developers’ heads about what they are here to accomplish,” shared Buterin
93% of Liquidity Pools on Raydium Show Signs of “Soft Rug Pull”
About 25% of these scams involved amounts less than $732. However, the median rug pull involved about $2,832, while the largest detected rug pull totaled $1.9 million.
Though the amounts look relatively small compared to multi-million-dollar scams, the sheer number of affected pools shows the prevalence of this issue.
A common thread between the two platforms is that both are built on the Solana blockchain. Solana is known for its high transaction speeds, processing thousands of transactions per second, and low costs, averaging just $0.00025 per transaction. Because of its technical advantages, Solana has become a prime target for criminals and scammers.
Despite these challenges, Solana remains a promising blockchain with many legitimate and interesting projects. Platforms like Raydium are vital in Solana’s DeFi ecosystem, with monthly trading volumes reaching billions of dollars.