XRP has been experiencing fluctuating price action recently. Currently trading at around $2.50, XRP saw a major drop after an initial price spike. However, it’s now back on an upward trajectory, hinting at a potential bullish trend. This movement suggests that XRP is following a slow, steady climb, with hopes of developing into a larger upward pattern. Analysts are watching for the possibility of an extended bull run, similar to what occurred in 2021.
Since the U.S. election, XRP has surged by 375%. The altcoin is significantly outperforming the broader market, with increasing interest from new buyers, as active XRP wallets have jumped by 620% in the past week.
The market’s fear and greed index is improving, moving up to 30, signaling a shift toward a more optimistic outlook. Bitcoin dominance remains steady at 60%, and the overall market cap has risen to $3 trillion, with altcoins also gaining momentum.
Bearish Divergence on 3-Day Chart
According to analyst Josh of Crypto World, XRP continues to show a bearish divergence on the 3-day timeframe. This suggests that while short-term movements may fluctuate, we shouldn’t expect any major bullish momentum similar to the rise seen in November last year.
Short-Term Support and Resistance Levels
XRP is bouncing from a key support area between $2.25 to $2.30. The next resistance levels to watch are between $2.65 and $2.80, with additional resistance at $3 and $3.20.
RSI Indicators and Market Movement
The RSI has recently bounced into overbought territory, but has since reset after a pullback. At the moment, the RSI is neutral, which suggests that XRP’s price may remain in a sideways range for the short term. If Bitcoin and other major altcoins stay neutral, XRP is likely to follow suit with some choppy price action.
With several impressive milestones, the TRON network continues to assert its dominance in the stablecoin payment sector. Recently, the amount of USDT (Tether) circulating on TRON reached a new all-time high.
Meanwhile, the number of long-term holders on TRON has exceeded 2.66 million addresses. This reflects retail investors’ strong confidence and long-term commitment to this layer-1 blockchain.
Can USDT Supply on TRON Surpass Ethereum?
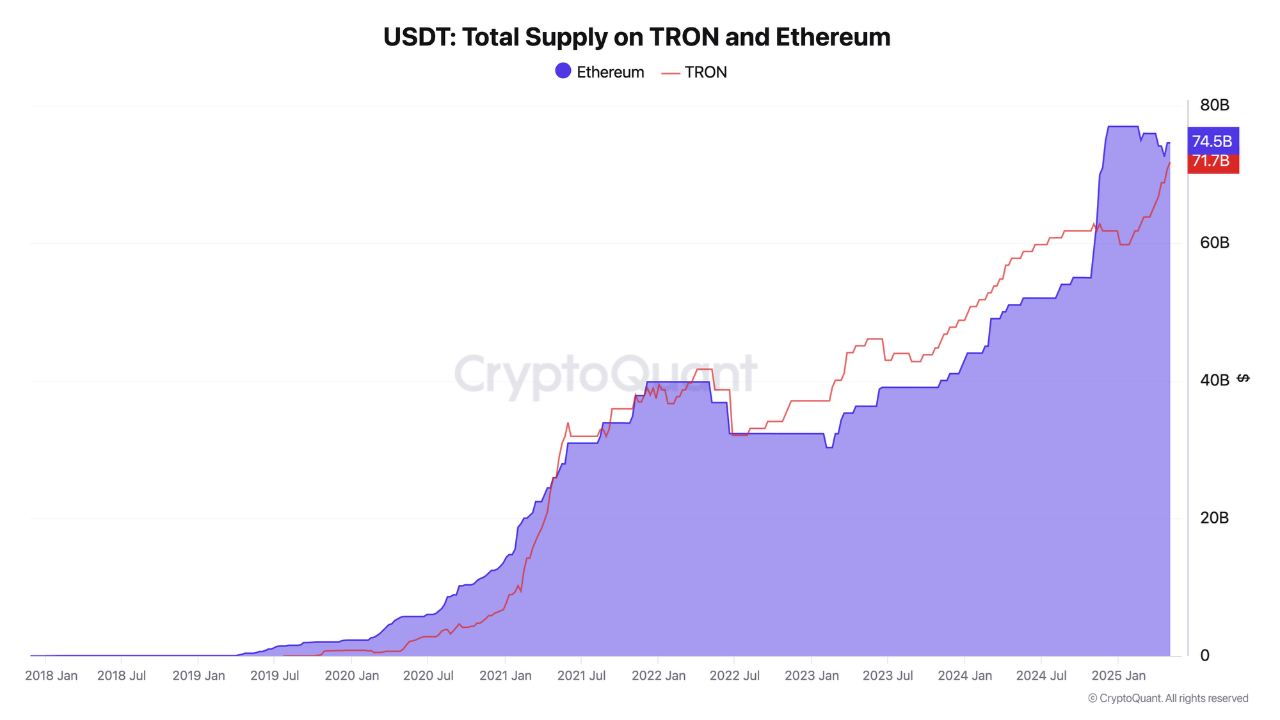
Data from CryptoQuant shows that the USDT supply of TRON has grown steadily over recent years. Currently, the market cap of USDT on TRON has hit a record high, with over $71 billion USDT in circulation.
Meanwhile, Ethereum hosts $74.5 billion USDT in circulation. TRON is narrowing the gap with ETH in terms of traders’ USDT usage.
USDT Total Supply on TRON and Ethereum. Source: CryptoQuant
“This milestone cements TRON’s position as one of the major blockchains in the DeFi space, and it may even surpass the adoption of some major chain competitors in the future,” Analyst Darkfost commented.
For context, the total stablecoin market capitalization is $242 billion, and Tether (USDT) alone accounts for $149 billion. That means TRON facilitates smooth transactions for 29% of the stablecoin market cap and 47% of USDT’s market cap.
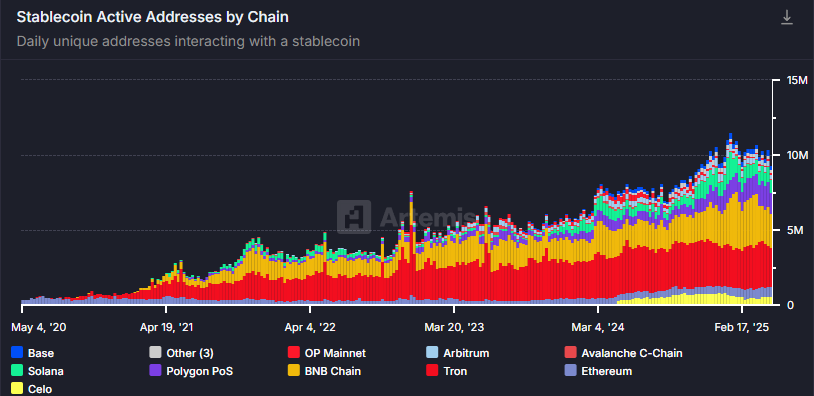
Additionally, data from Artemis shows that TRON accounts for 28% of all active stablecoin wallet addresses, more than any other blockchain tracked. This makes TRON the top chain in terms of fee revenue.
Stablecoin Active Address by Chain. Source: Artemis
A recent report from BeInCrypto reveals that experts predict stablecoins will attract strong VC interest in the future. The number of issuers could grow tenfold. New issuers may choose TRON, which would benefit a blockchain capable of handling $150 billion in weekly stablecoin transaction volume.
Tron (TRX) Backed by Loyal Long-Term Holders
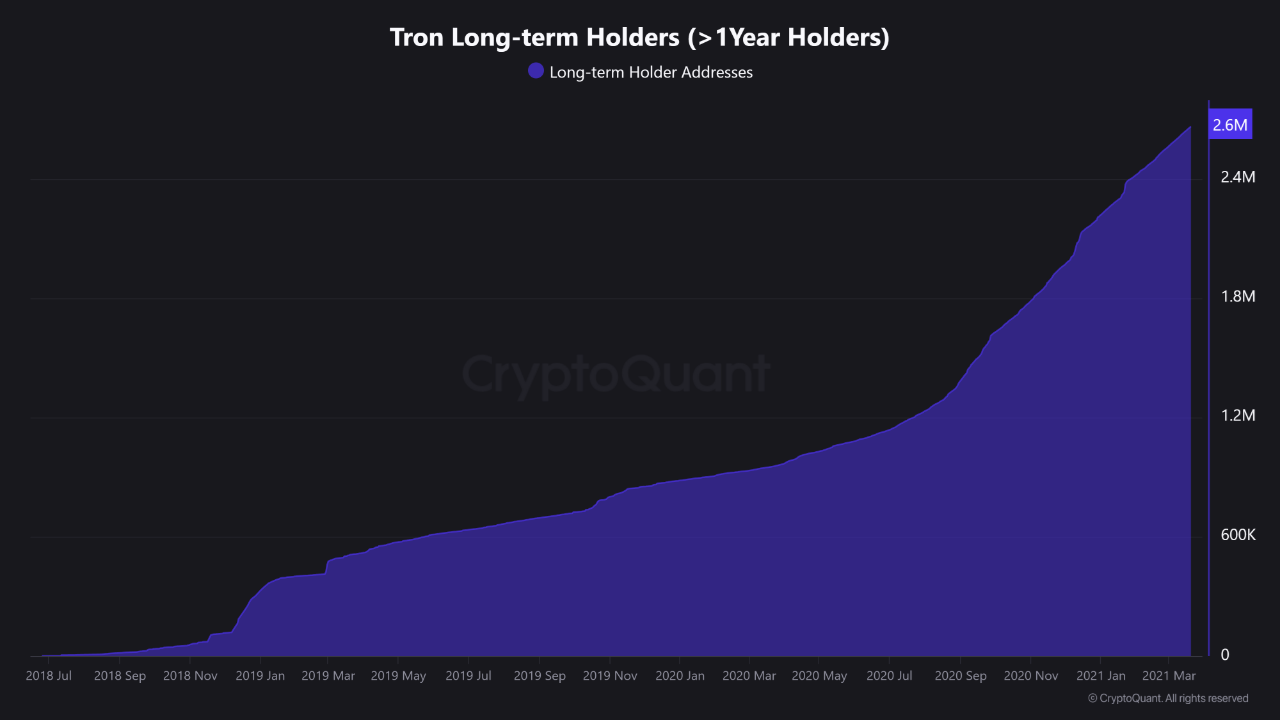
CryptoQuant also reports that 2.66 million TRX addresses have held their tokens for over one year without spending them. These wallets maintain balances of at least 10 TRX. While 10 TRX is worth only a few dollars, many retail investors choose to hold TRON long-term, even with small amounts of capital.
Analyst Crazzyblockk believes this metric indicates strong user loyalty and sustained engagement, which can support TRX’s price in the long run.
Tron Long-term Holders (> 1 Year Holders). Source: CryptoQuant.
“Increased long-term holding is often linked to higher confidence in the underlying network and potential for liquidity resilience,” Crazzyblockk said.
However, some investors argue that TRON’s vitality relies too heavily on USDT transactions. Data from Dune shows over 3 million TRON wallets are active daily, but most only transact USDT. Therefore, any strategic changes in the TRON–Tether relationship could significantly impact the network and the price of TRX.
This dependency highlights TRON’s weak utility outside the USDT space. For example, TRON lags far behind Solana in meme coin deployment and is significantly behind other chains in decentralized exchange (DEX) trading volume. Moreover, TRON appears nearly absent from the real-world asset (RWA) market share.
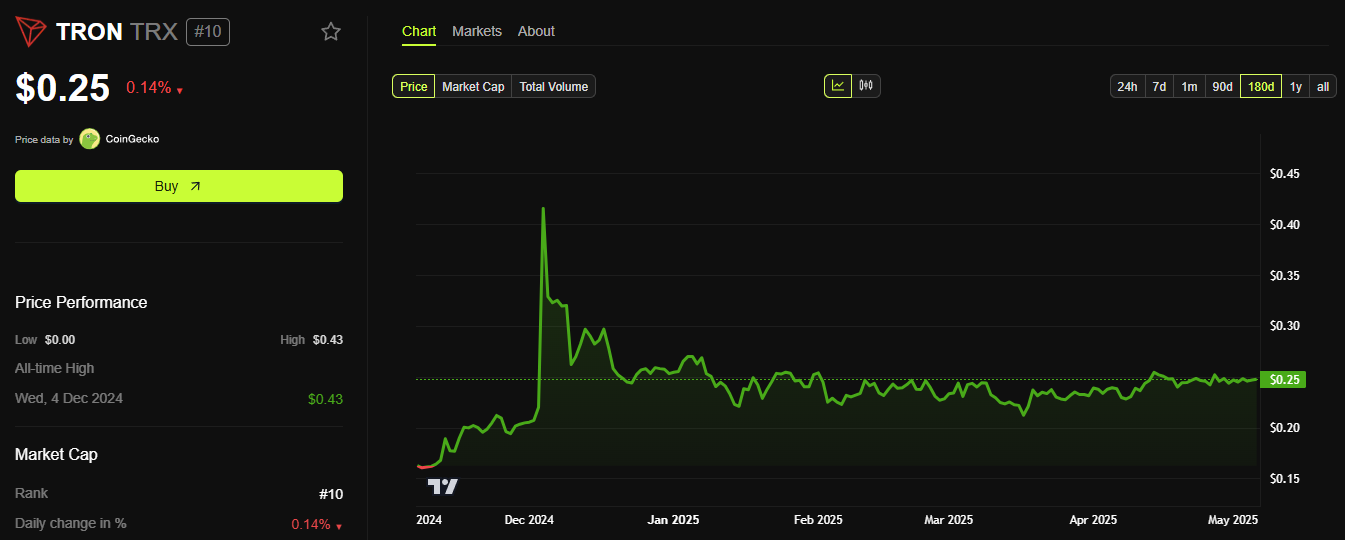
Tron (TRX) Price Performance Chart. Source: BeInCrypto.
At the time of writing, TRX is trading around $0.25, showing little movement after falling from a high of $0.45 late last year.
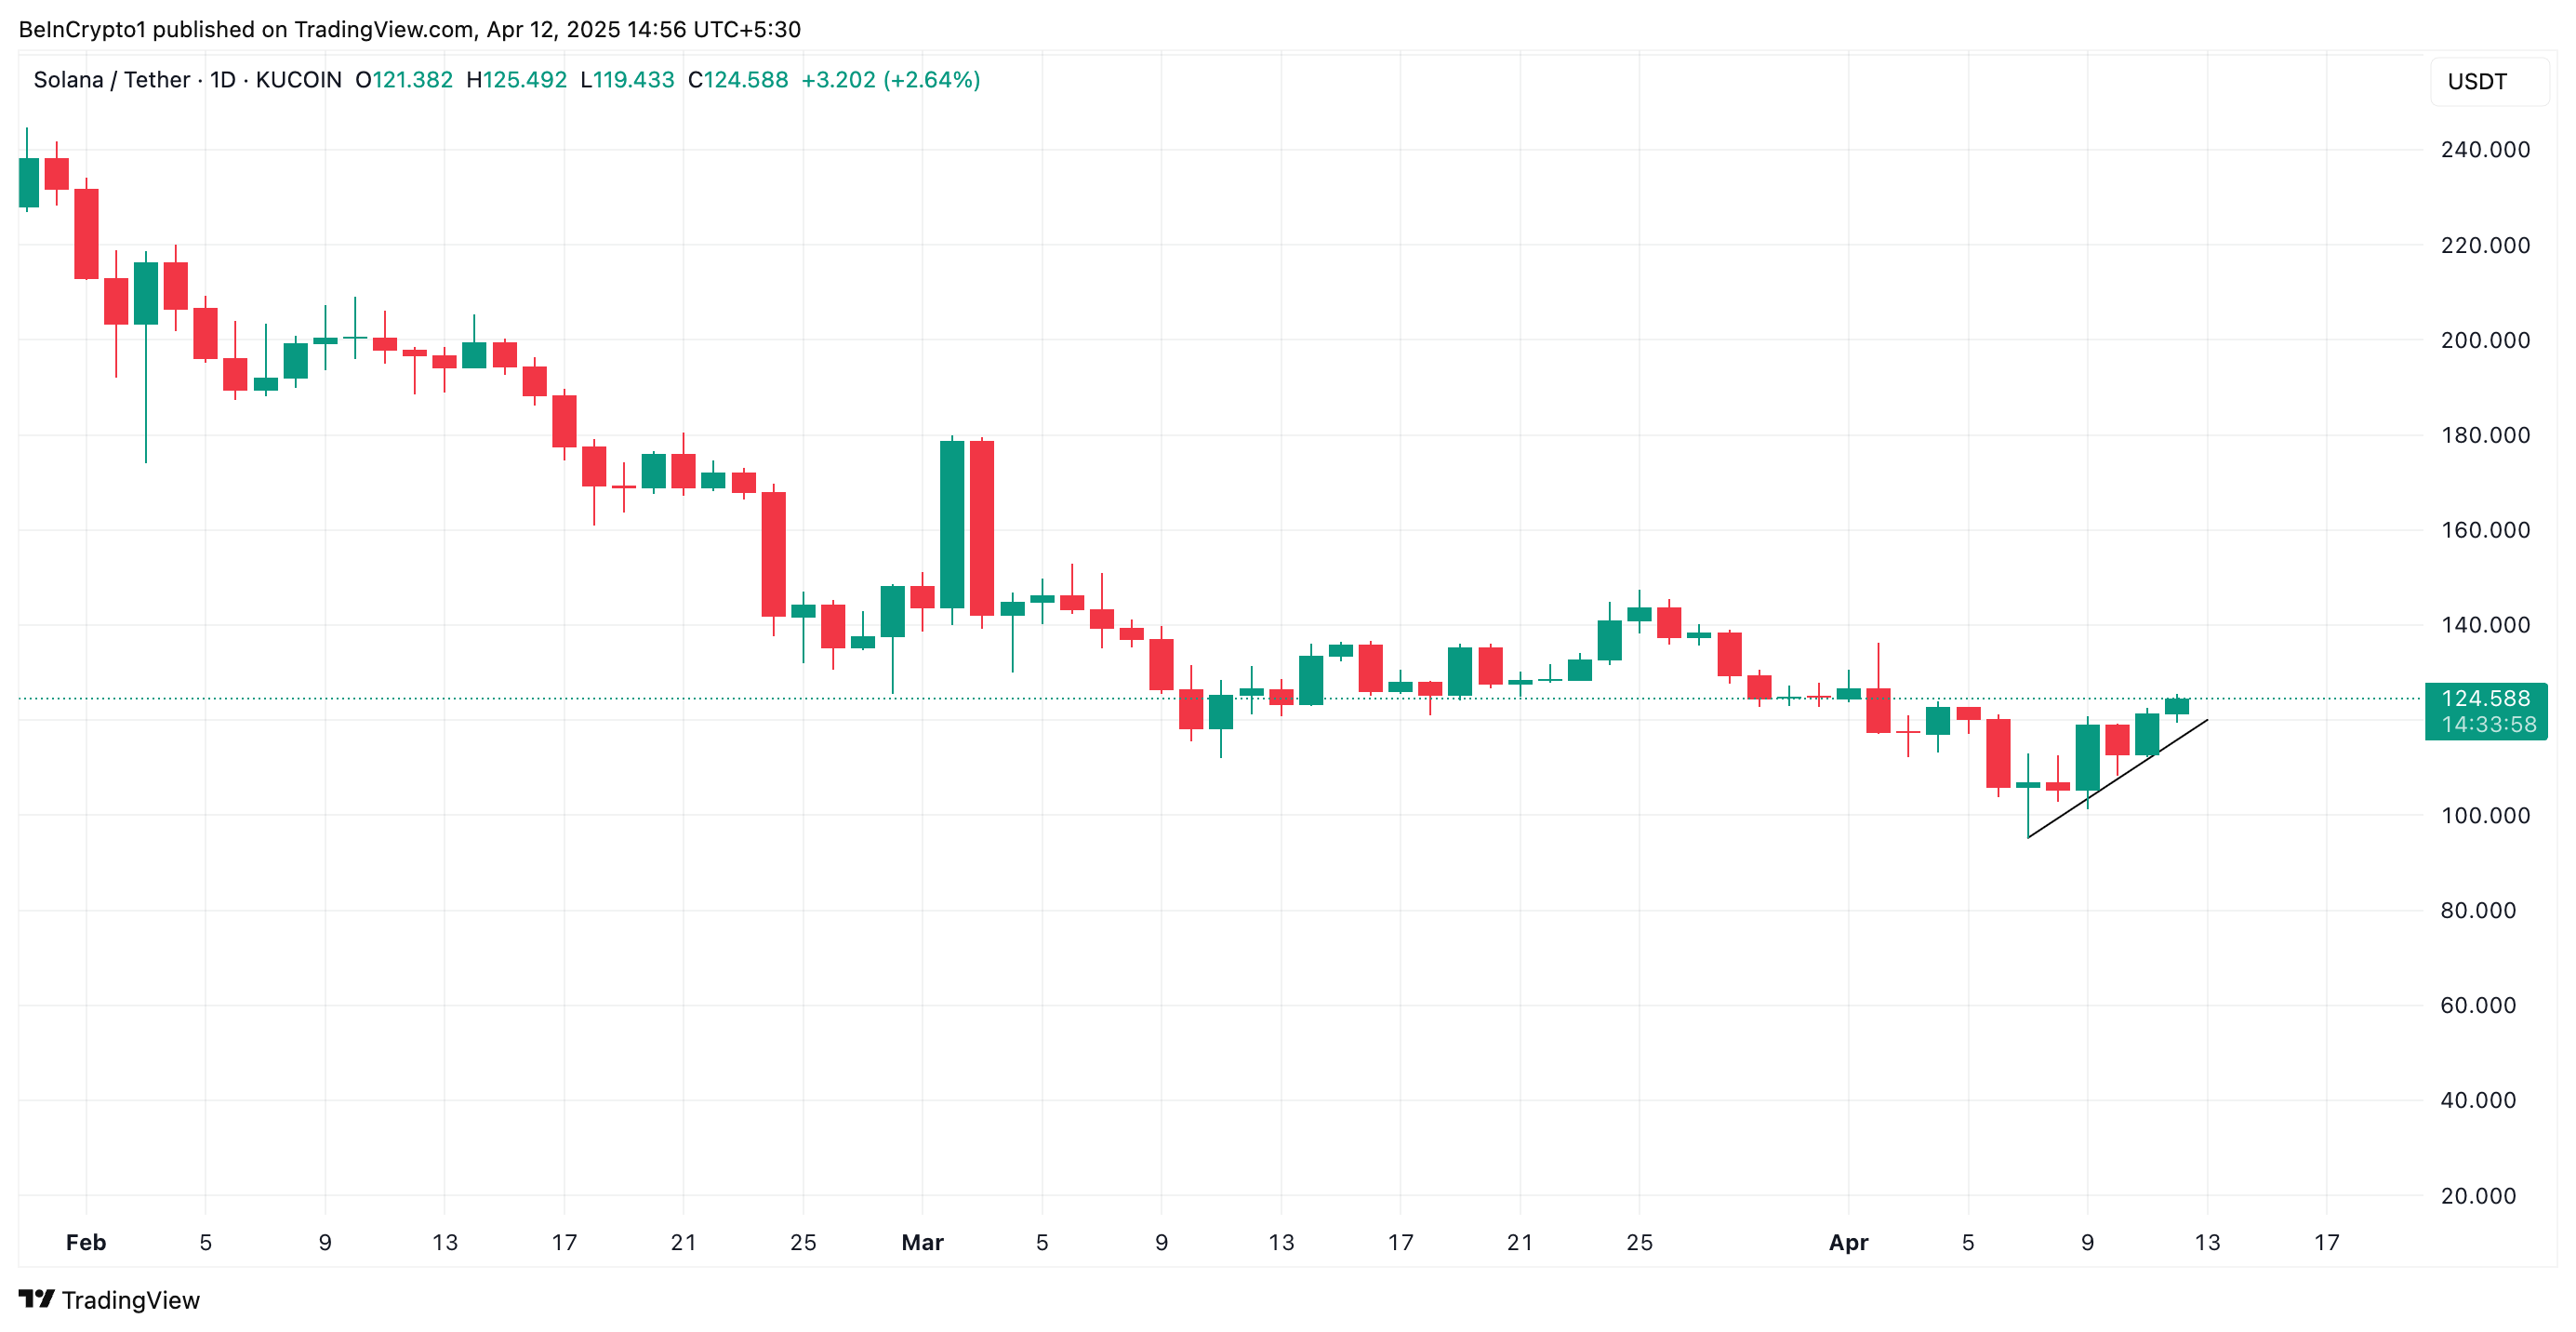
This pattern emerges when the price of an asset consistently makes higher lows over a period of time. It represents an uptrend, indicating that SOL demand is gradually increasing, driving its prices higher. It suggests that the coin buyers are willing to pay more, and it serves as a support level during price corrections.
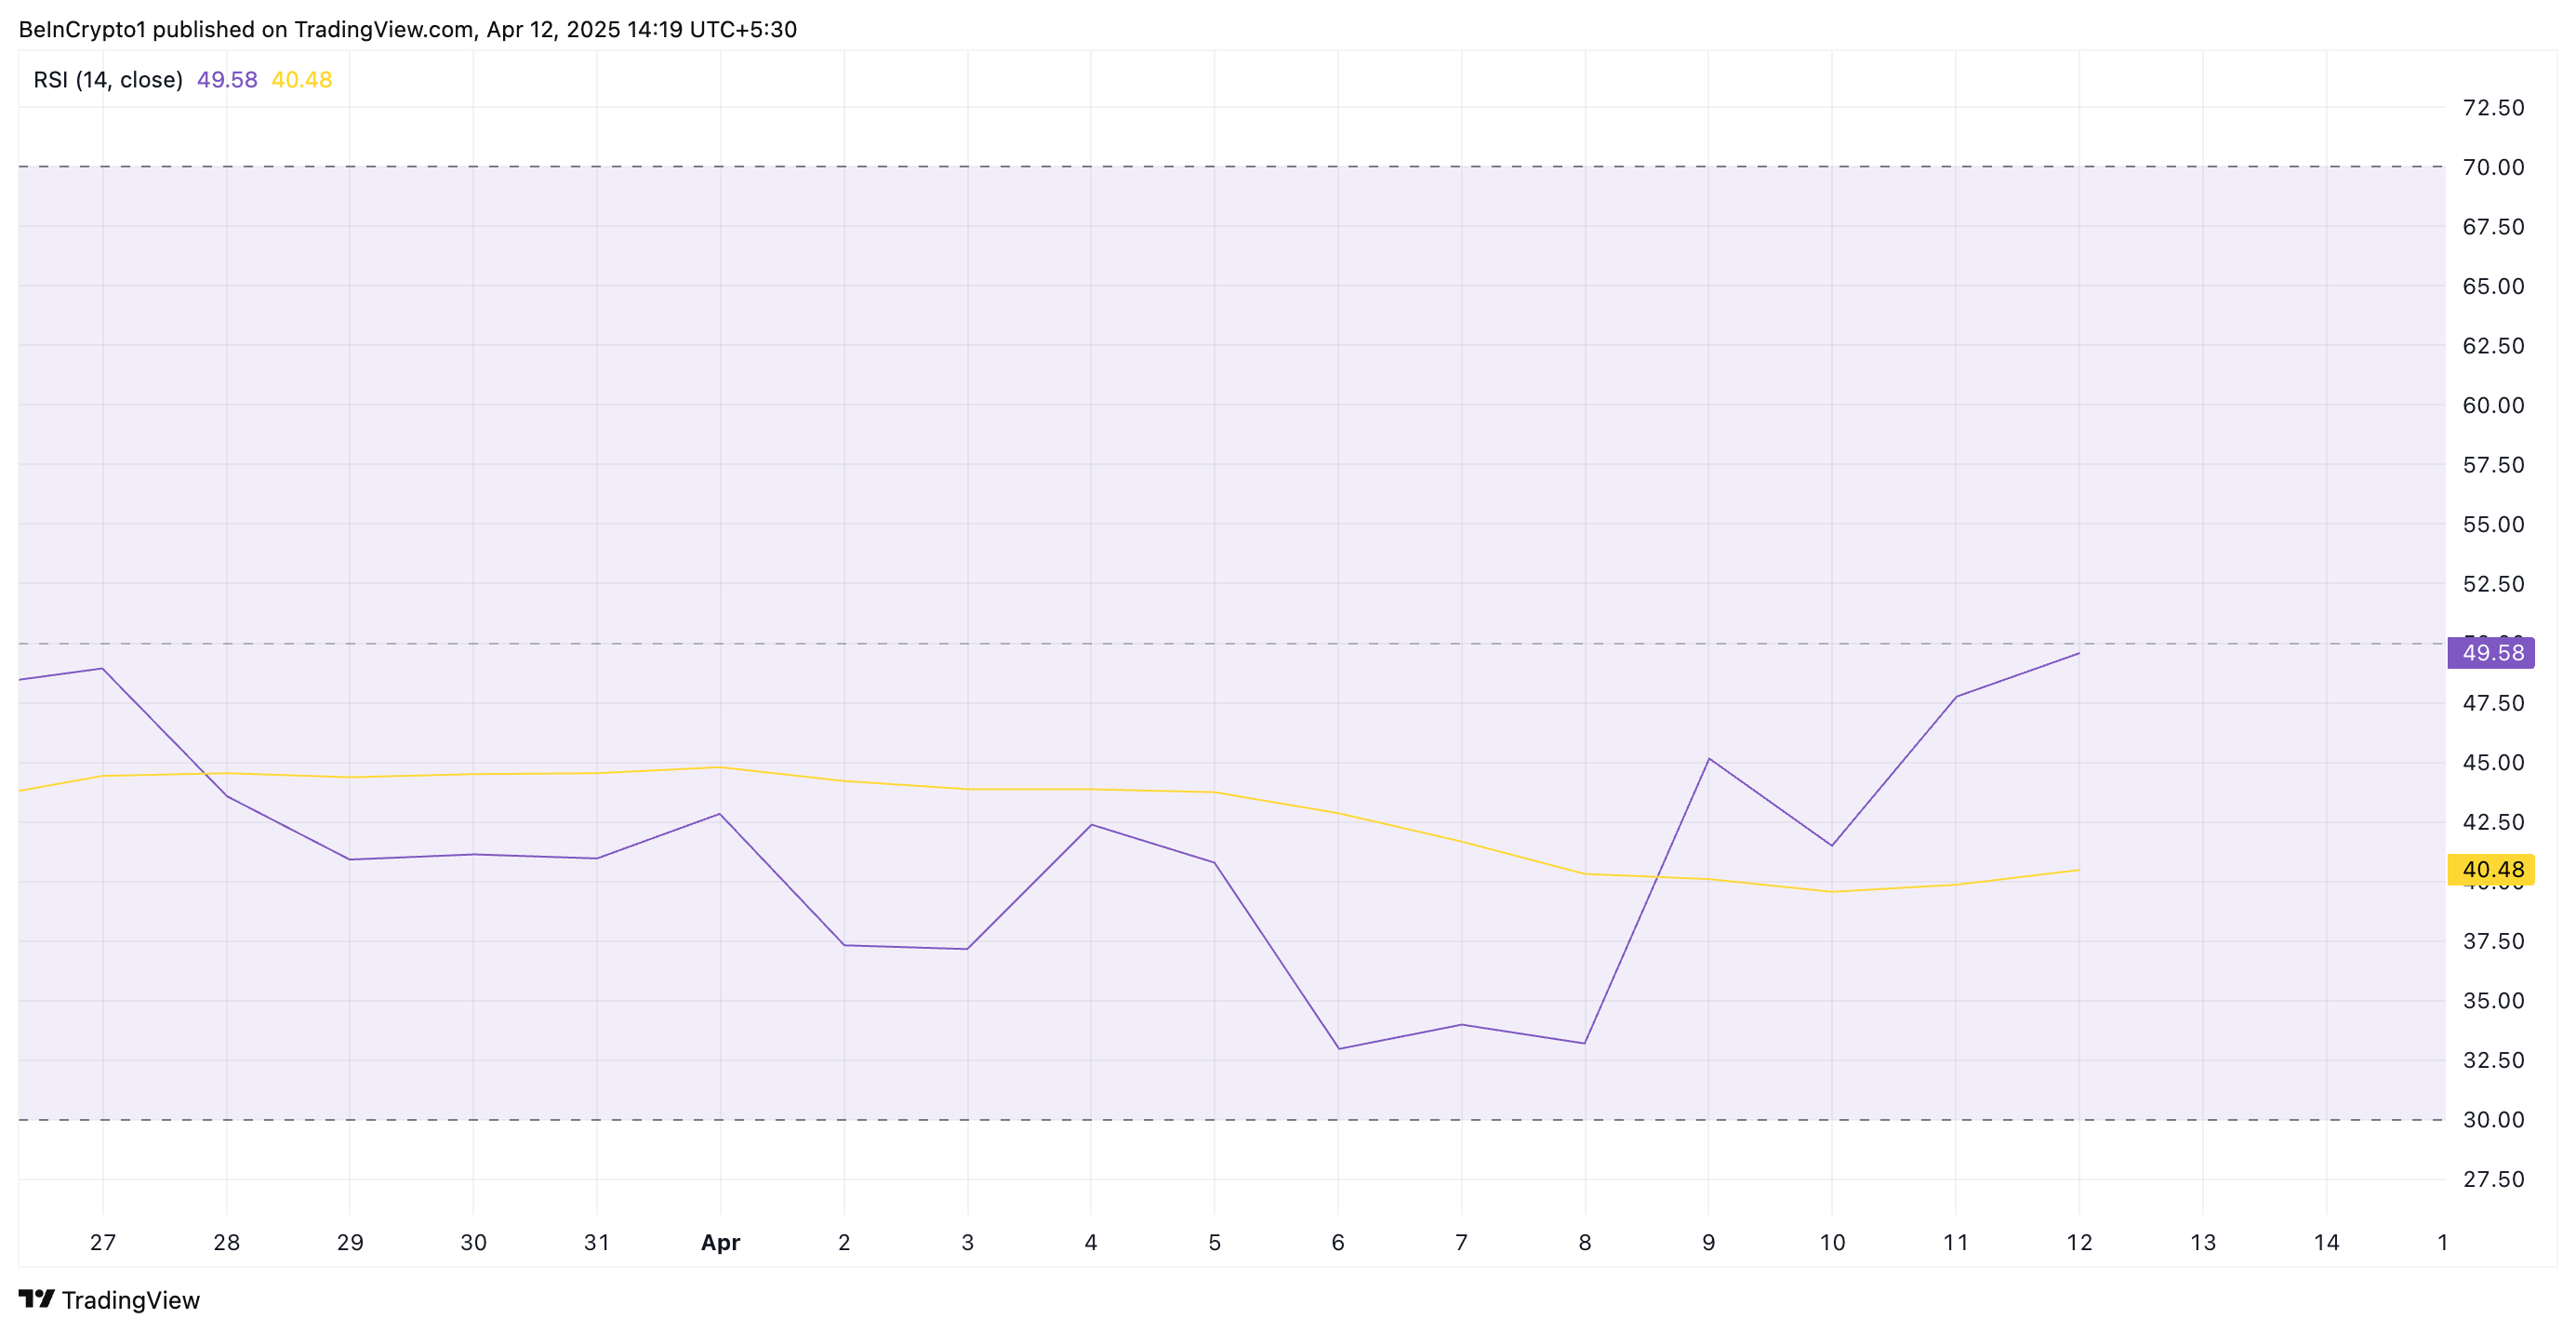
SOL’s recovery is further supported by its rising Relative Strength Index (RSI), indicating increasing buying interest. This momentum indicator is at 49.58 at press time, poised to break above the 50-neutral line.
The RSI indicator measures an asset’s overbought and oversold market conditions. It ranges between 0 and 100. Values above 70 suggest that the asset is overbought and due for a price decline, while values under 30 indicate that the asset is oversold and may witness a rebound.
At 49.50 and climbing, SOL’s RSI signals a steady shift in momentum from bearish to bullish. A rise above 50 would confirm increasing buying pressure and a potential for a sustained upward price movement.
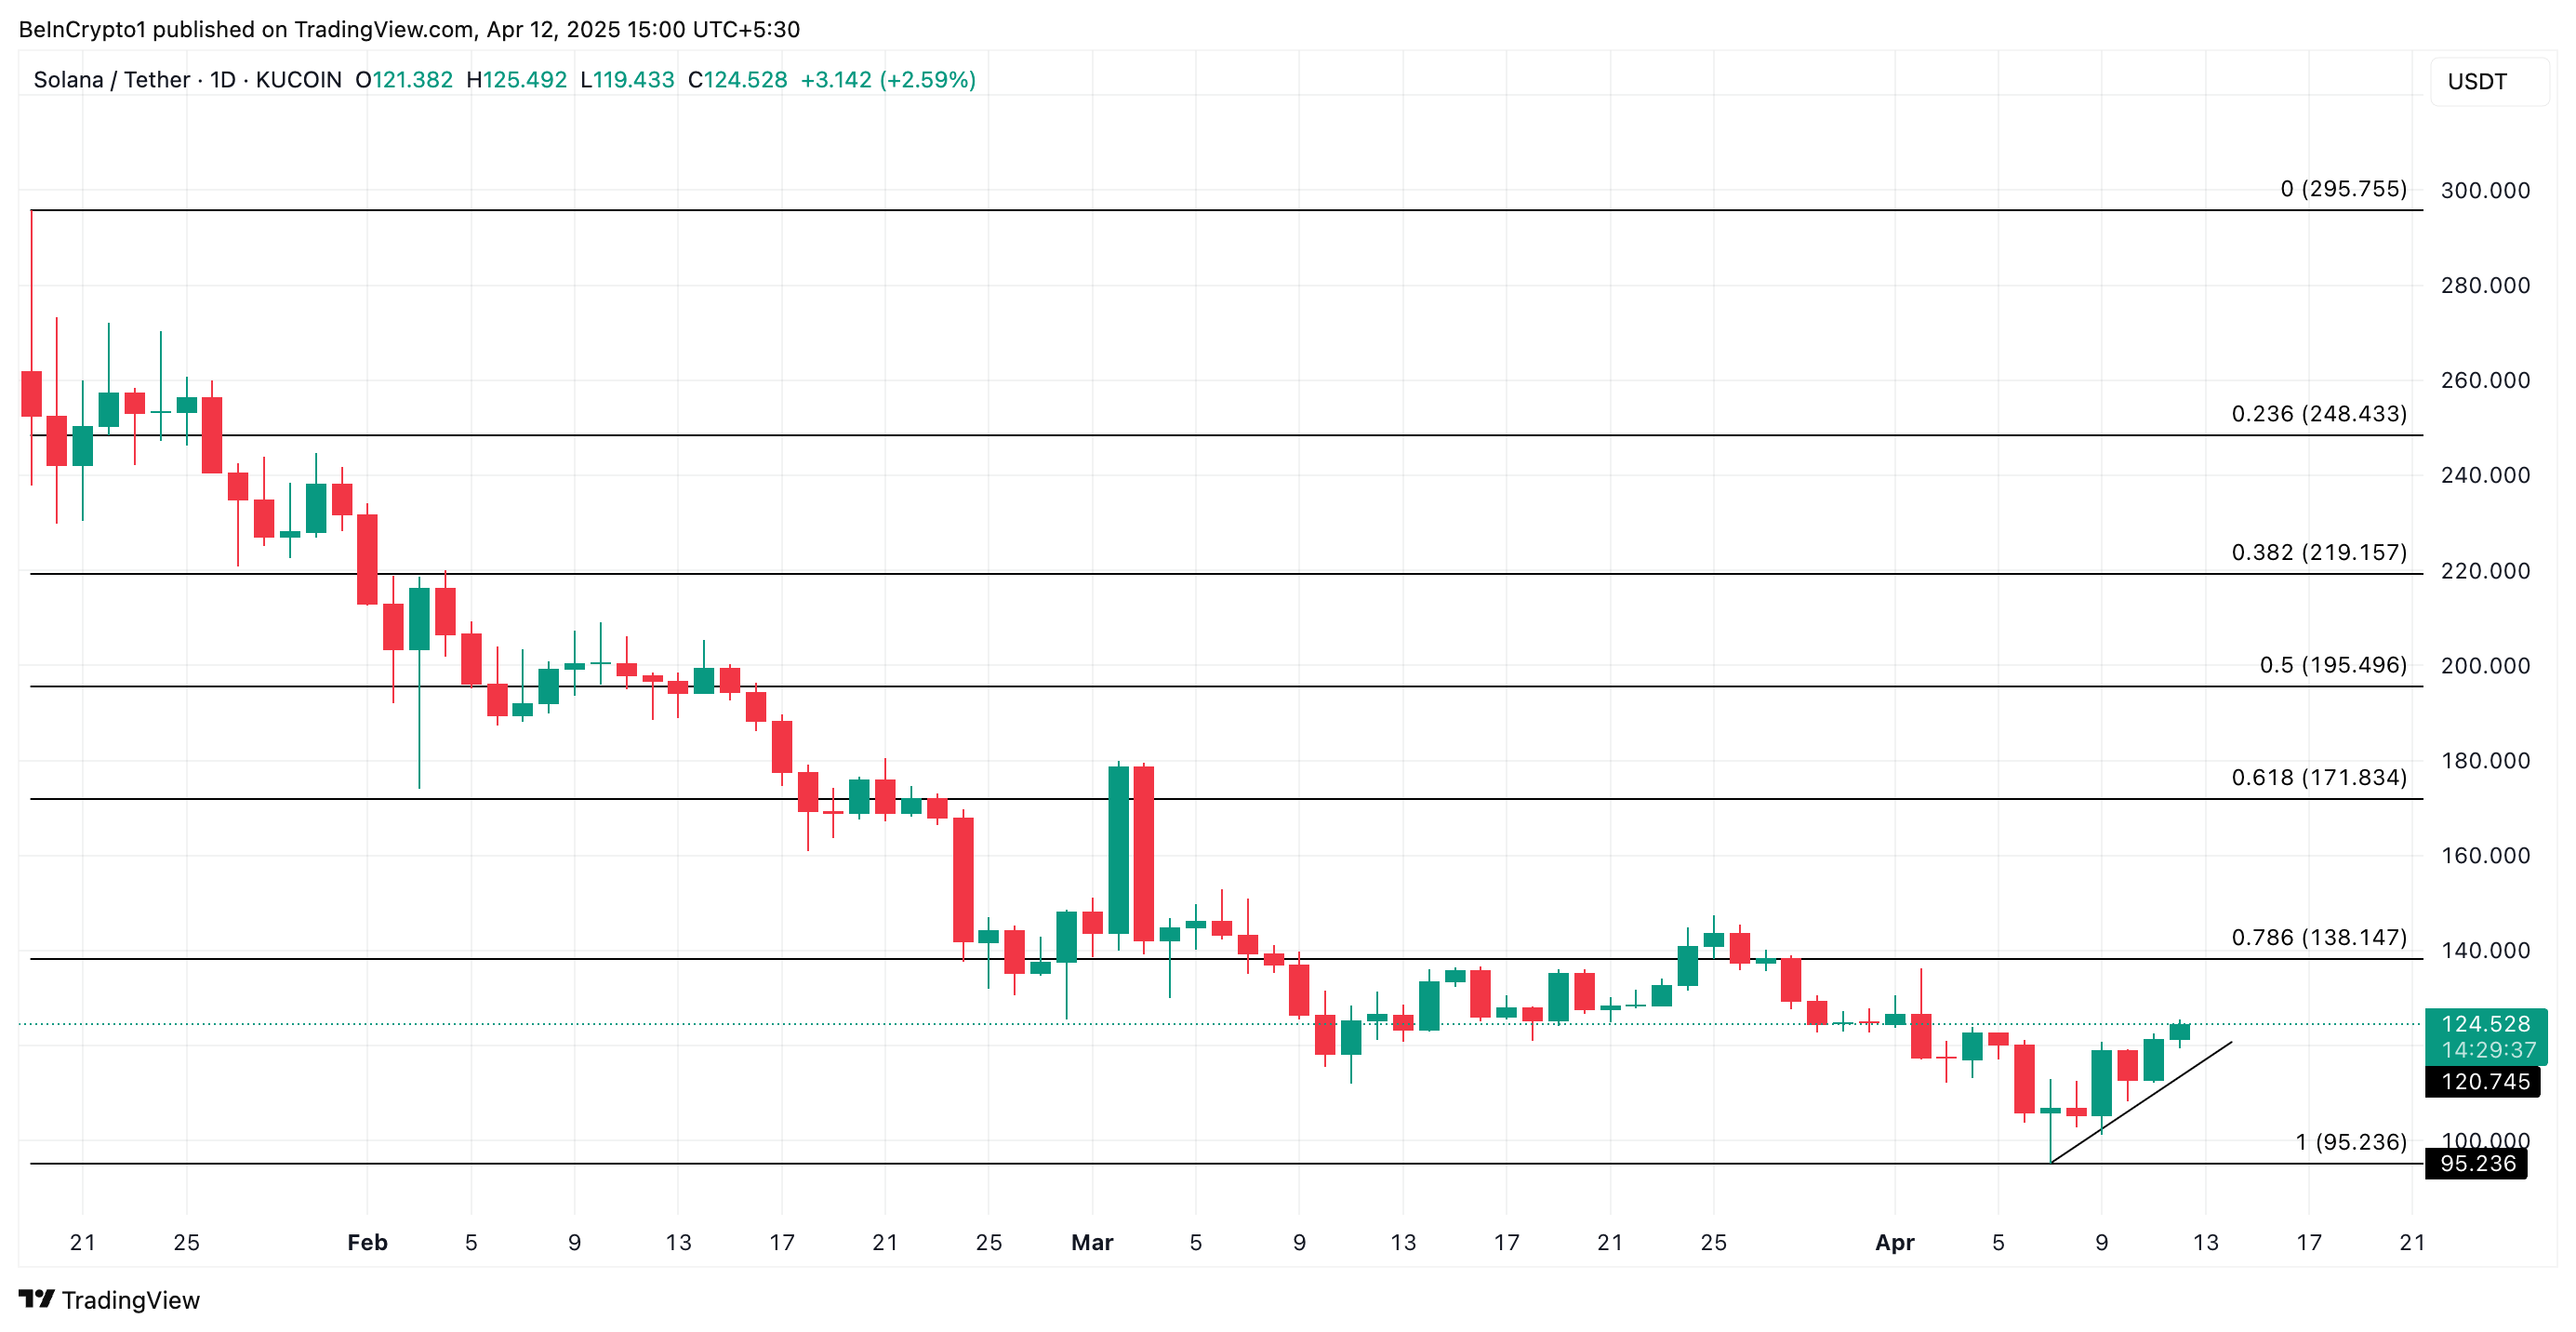
Solana Bulls Eye $138
SOL’s ascending trend line forms a solid support floor below its price at $120.74. If demand soars and the bullish presence with the SOL spot markets strengthens, the coin could continue its rally and climb to $138.41.
Today, approximately $8.05 billion worth of Bitcoin (BTC) and Ethereum (ETH) options expire, prompting crypto market participants to brace for volatility.
Traders and investors should be particularly attentive to today’s options expiry due to its volume and notional value, increasing the odds of potential influence on short-term trends. However, the put-to-call ratios and maximum pain points provide insight into what can be expected and the possible market directions.
Insights on Today’s Expiring Bitcoin and Ethereum Options
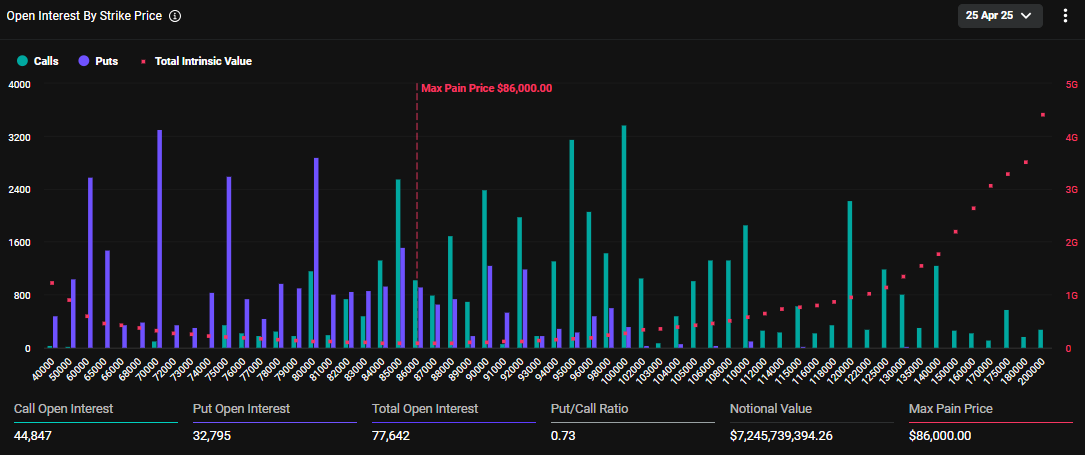
The notional value of today’s expiring Bitcoin options is $7.24 billion. According to Deribit’s data, these 77,642 expiring Bitcoin options have a put-to-call ratio 0.73. This ratio suggests a prevalence of purchase options (calls) over sales options (puts).
The data also reveals that the maximum pain point for these expiring options is $86,000. In crypto options trading, the maximum pain point is the price at which the asset will cause the greatest number of holders’ financial losses.
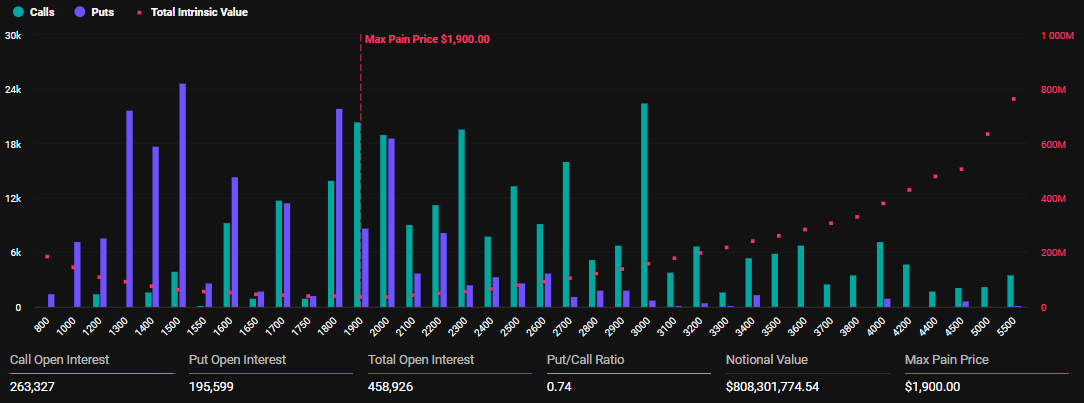
In addition to Bitcoin options, 458,926 Ethereum options contracts are set to expire today. These expiring options have a notional value of $808.3 million, a put-to-call ratio of 0.74, and a maximum pain point of $1,900.
The number of today’s expiring Ethereum options was significantly higher than last week. BeInCrypto reported that last week’s expired ETH options were 177,130 contracts, with a notional value of $279.789 million.
As of this writing, Bitcoin was trading well above its maximum pain level of $86,000 at $93,471. Meanwhile, Ethereum was trading below its strike price of $1,900 at $1,764.
“BTC trades above max pain, ETH below. Positioning into expiry is anything but aligned,” Deribit analysts remarked.
With the max pain level (also called strike price) often acting as a magnet for price due to smart money actions, both Bitcoin and Ethereum could pull towards their respective levels.
The positioning of both BTC and ETH open interest indicates high trader activity near max pain. The dense clustering of their respective histograms around $80,000 to $90,000 for Bitcoin and around $1,800 to $2,000 for Ethereum shows this.
This positioning suggests potential for short-term price consolidation or volatility.
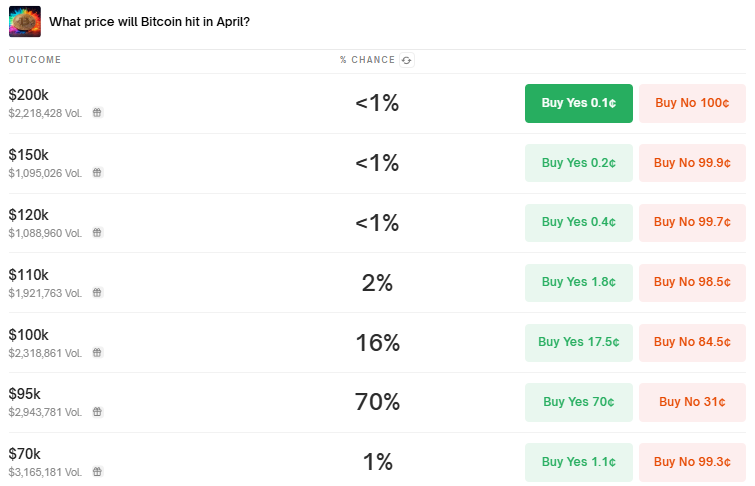
Polymarket: Only 16% Chance Bitcoin Price Hits $100,000 in April
According to Deribit, traders are selling cash-secured put options on Bitcoin. Further, they are using stablecoins to collect premiums while positioning to buy BTC at lower prices. This reflects a long-term bullish outlook.
“BTC traders on Deribit are expressing long-term bullish sentiment, selling cash-secured puts using stablecoins to potentially buy the dip and collect yield,” Deribit wrote.
Analysts on Deribit also note the highest open interest for BTC options around the $100,000 strike price. This indicates strong market expectations of Bitcoin reaching this level.
Nevertheless, data on the Polymarket prediction platform shows traders estimating only a 16% chance of BTC hitting $100,000 in April.
Another interesting observation is that the Cumulative delta (CD) across BTC and related ETF (exchange-traded fund) options on Deribit reached $9 billion. While this shows high sensitivity to Bitcoin price changes, it also suggests potential volatility as market makers hedge their positions.
Notwithstanding, Deribit analysts also reveal a surge in Bitcoin call option buying for April to June 2025 expiries. Investors are reportedly targeting strikes between $90,000 and $110,000, a sentiment inspired by Bitcoin’s price breaking above 89,000.
Nevertheless, not all activity leading up to Bitcoin’s recovery was new money or a fresh capital influx. According to an analysis by Deribit’s Tony Stewart, half of it involved rolling up existing positions, indicating strategic adjustments by traders.