The altcoin market is experiencing a surge in bullish sentiment, with SUI edging closer to forming a new all-time high (ATH). Traders’ renewed confidence is fueling this momentum, as fresh capital injections pour into the asset, signaling strong market enthusiasm.
SUI Traders Are Bullish
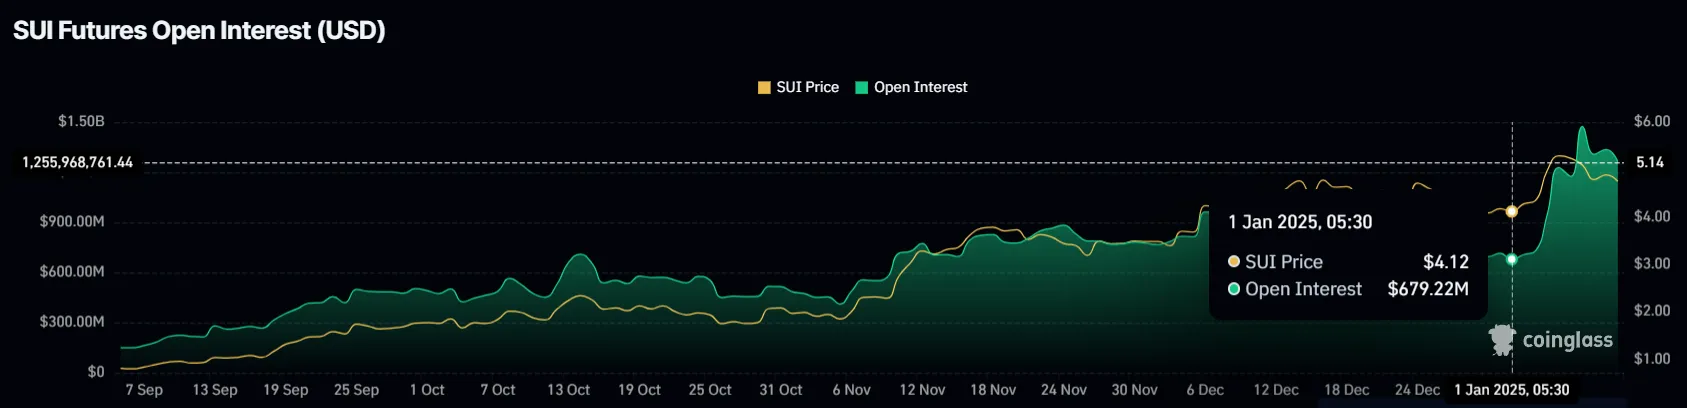
The momentum surrounding SUI has been substantial, as evidenced by the doubling of its Open Interest (OI) in just nine days. Rising from $679 million to $1.26 billion, the surge highlights a growing belief among traders that SUI is on the brink of breaking its ATH. This increase in OI suggests a robust interest from traders who are anticipating significant returns, further solidifying the bullish outlook for the altcoin.
With traders confidently backing the asset, there is a strong foundation for sustained bullish momentum. As SUI nears its ATH, the increased capital inflows and optimism surrounding the asset set the stage for potential price growth.
Technical Indicators Show Strong Bullish Sentiment
Technical analysis also supports the optimism surrounding SUI. The Relative Strength Index (RSI) has remained above the neutral threshold of 50.0, signaling that buyers are maintaining control over the market. This sustained bullish momentum indicates that SUI could continue to benefit from favorable market conditions, attracting more traders and investors in the process.
SUI Price Prediction: A New High Within Reach
Currently, SUI is less than 6% away from its ATH of $5.36. The altcoin has demonstrated resilience by bouncing off the support level of $4.79, suggesting that the uptrend may continue if bullish conditions hold. If the asset successfully breaches its ATH, it could chart new price levels, rewarding its investors with substantial gains.
However, broader market sentiment will play a pivotal role in determining the sustainability of this rally. Should market conditions shift, SUI could experience a pullback, especially if it falls below the $4.79 support level, potentially triggering a decline to $4.05.
Pi Network (PI) is back in the spotlight after an 11% price surge triggered by the withdrawal of over 86 million tokens from OKX, sparking speculation of a coordinated supply squeeze. The move has intensified bullish sentiment, especially as technical indicators begin to align with the price action.
Momentum indicators like the DMI and EMA suggest growing strength, and a potential golden cross formation hints at the possibility of a continued breakout. However, not all signals are fully confirmed—volume-based metrics like the CMF show lingering indecision, making the next few days critical for confirming PI’s direction.
Technical Indicators Support PI Rally Amid Supply Shock Speculation
The sudden exodus of tokens sparked speculation of a coordinated supply squeeze, with some investors interpreting the move as a strategic effort by large holders to limit circulating supply and potentially drive the price higher.
Community voices on X described the event as a “power move,” pointing to growing confidence in the asset’s future trajectory.
While this triggered bullish momentum and boosted PI to the top of CoinGecko’s trending list, questions still linger regarding its long-term fundamentals, particularly its mainnet rollout, exchange listings, and broader use-case development.
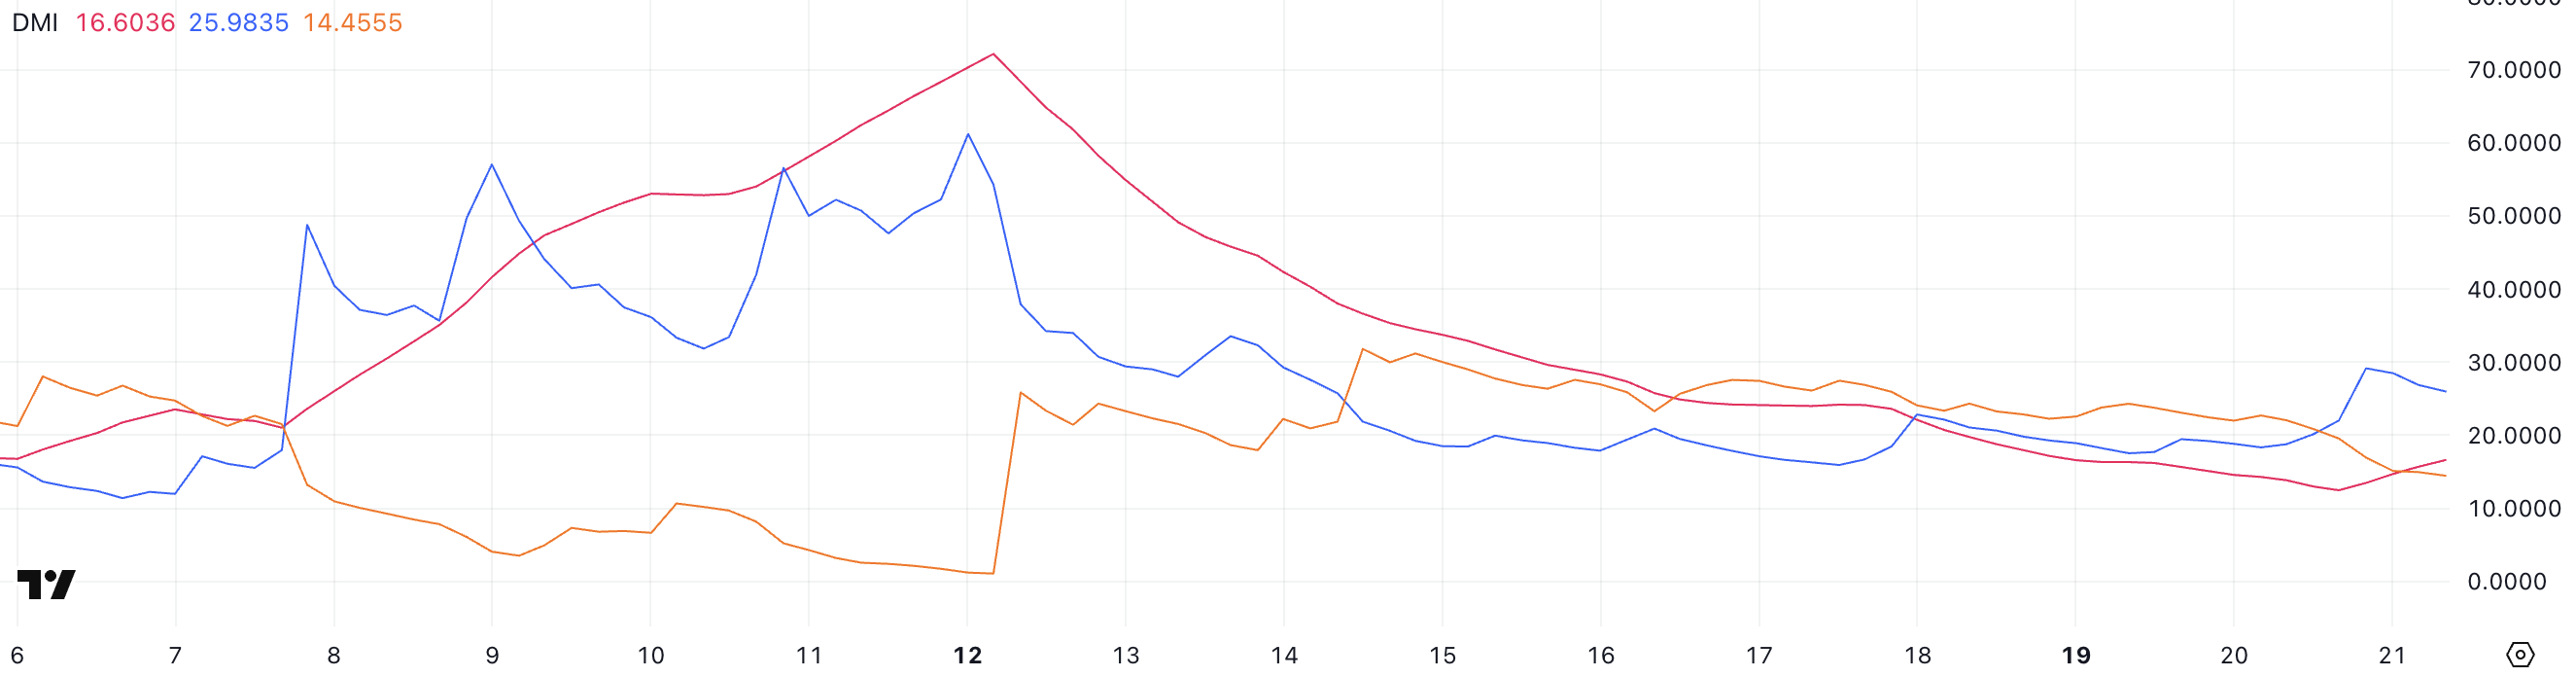
From a technical perspective, PI’s Directional Movement Index (DMI) shows signs of growing strength. The ADX—a metric that measures the strength of a trend—has climbed from 12.46 to 16.6 in the past day, signaling that momentum is building. Typically, ADX values above 20 indicate a developing trend, with readings above 25 considered strong.
Meanwhile, the +DI line, which tracks bullish pressure, sits at 25.98—up from 20.14 yesterday, though slightly down from its peak earlier today at 29.15. The -DI, representing bearish pressure, has dropped significantly to 14.45 from 20.84 yesterday.
This divergence suggests that bulls are gaining control and sellers are stepping back, supporting the narrative that Pi Network may be entering a more decisive upward trend if this momentum continues.
PI CMF Drops After Brief Spike, Signaling Fading Buying Pressure
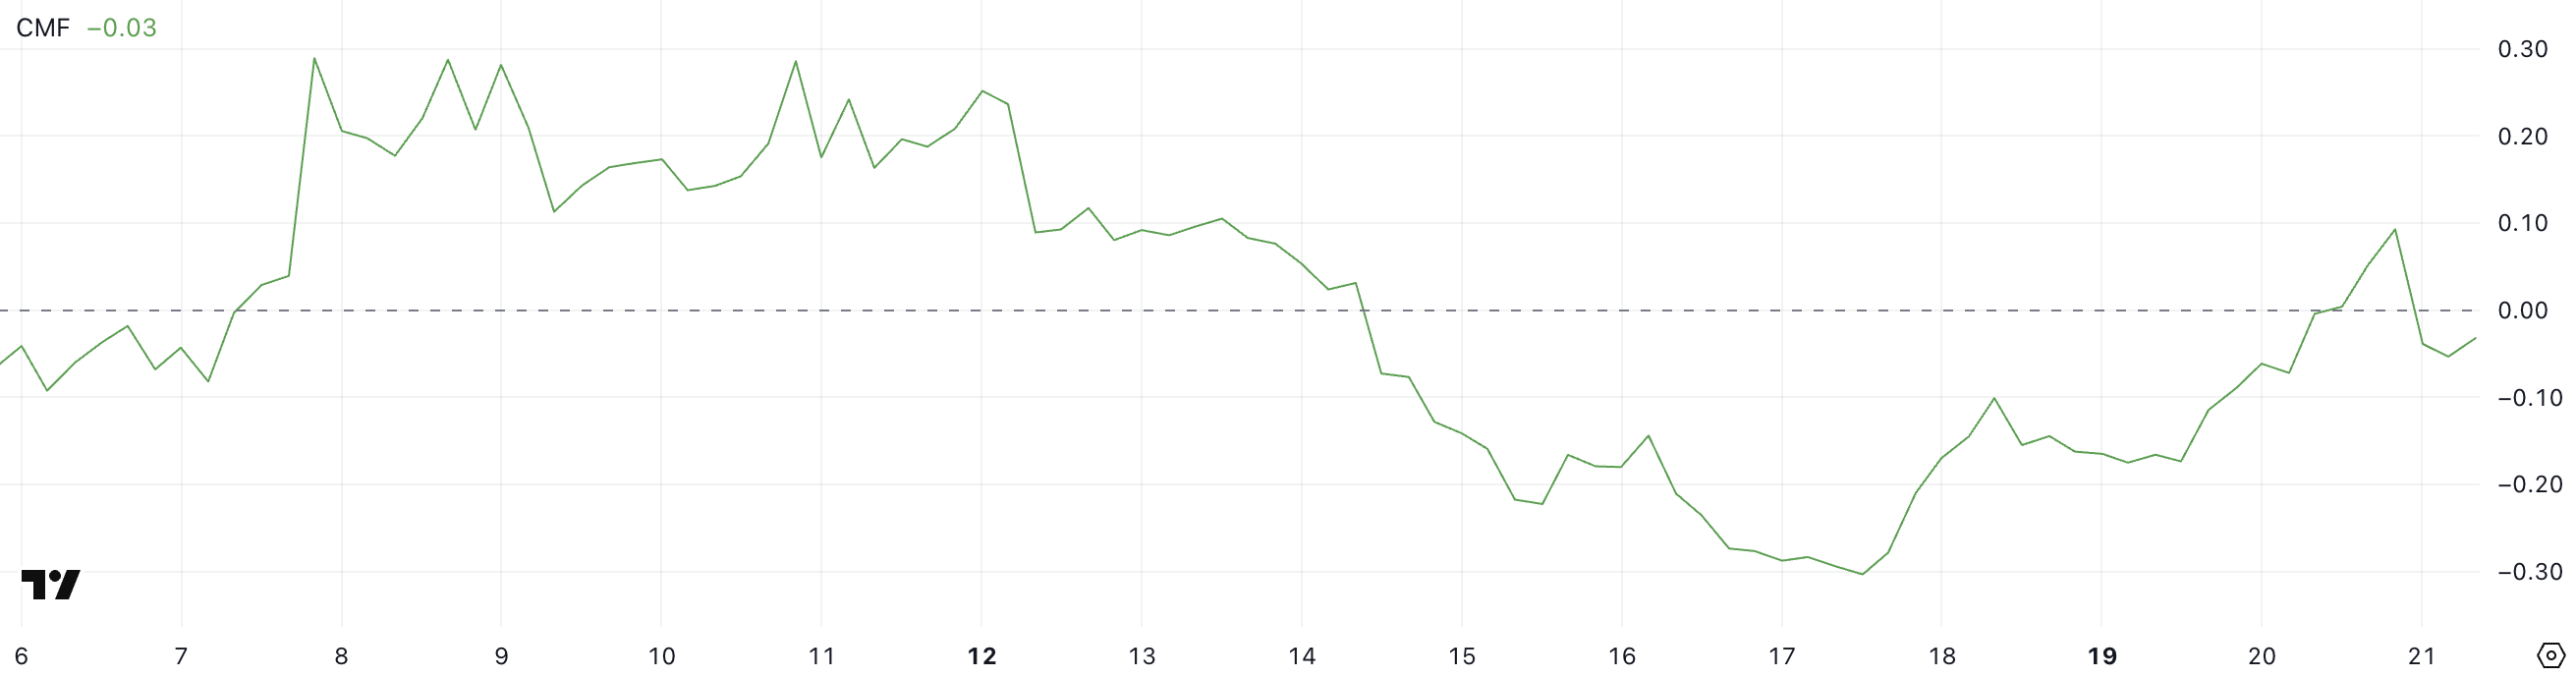
Despite the recent surge, PI CMF is now at -0.03.
Chaikin Money Flow (CMF), a volume-based oscillator that measures buying and selling pressure over a given period. CMF values range from -1 to +1, with readings above 0 suggesting accumulation (buying pressure) and below 0 indicating distribution (selling pressure).
Currently, PI’s CMF stands at -0.03—a notable improvement from -0.17 two days ago but a pullback from yesterday’s +0.09.
This shift shows that while the overall selling pressure has eased significantly, the recent dip back below the zero line suggests that buyers haven’t fully taken control. A CMF hovering around the neutral zone could imply indecision in the market or a pause after the recent rally.
For bulls to regain full momentum, the CMF would ideally need to push back into positive territory and hold, confirming sustained capital inflows and supporting the case for continued upside.
Golden Cross Setup Builds for PI, But Key Resistance Still in Play
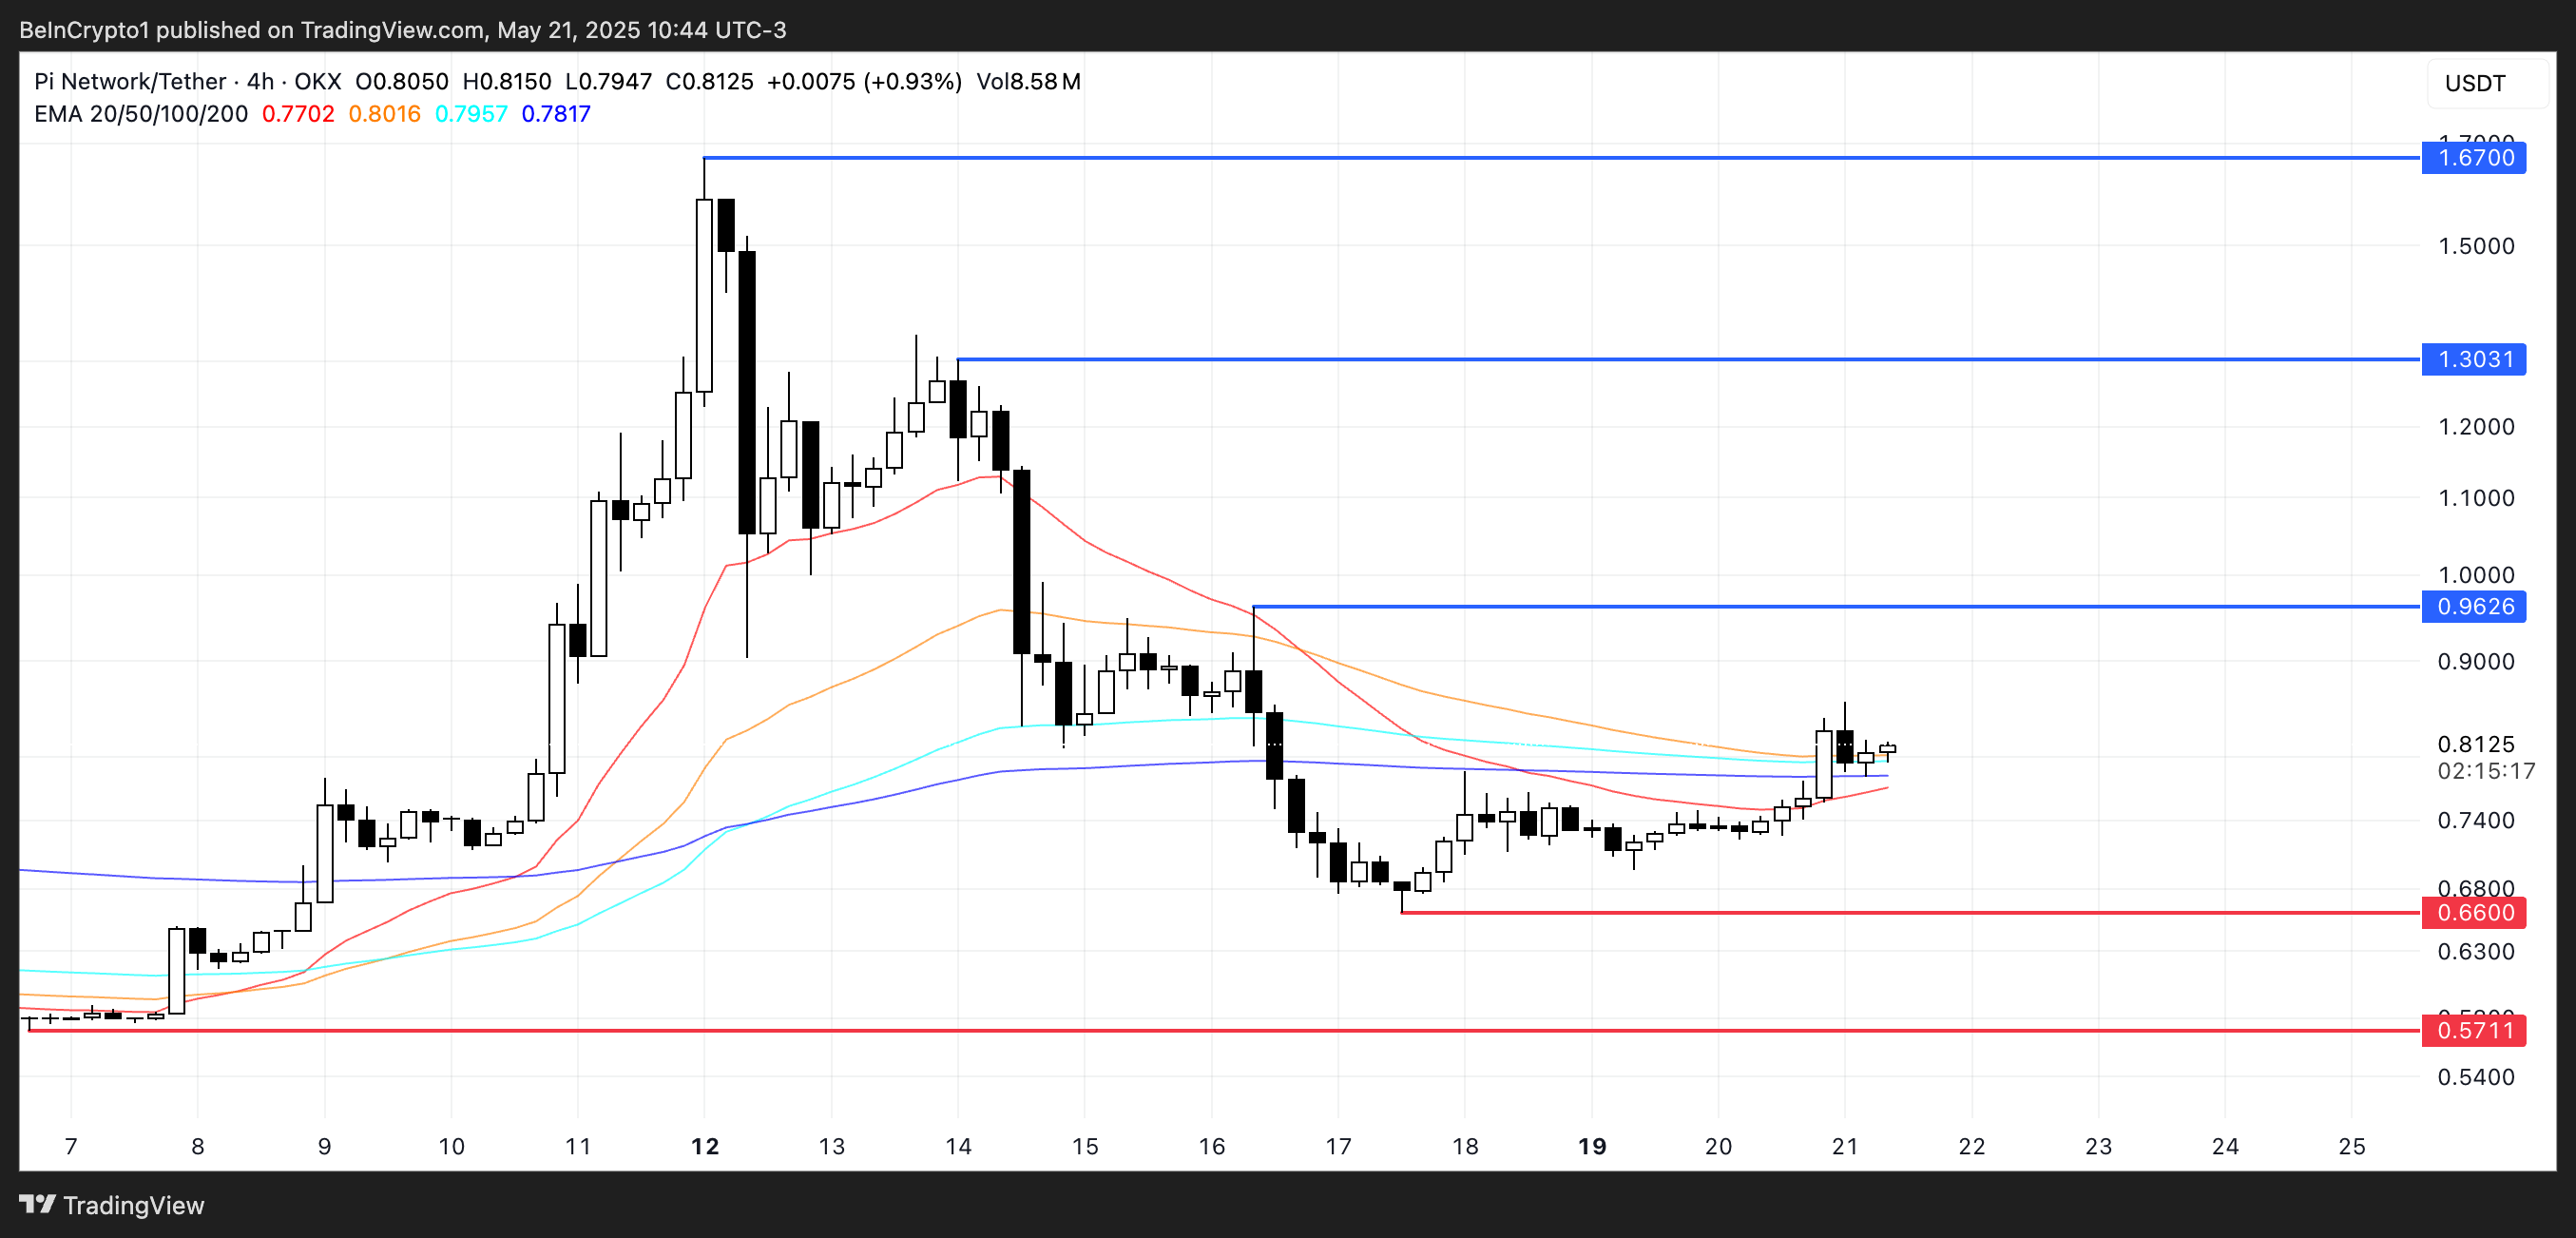
Pi Network’s EMA lines are starting to align in a bullish setup, with a potential golden cross formation on the horizon. A golden cross occurs when a short-term EMA crosses above a long-term EMA, signaling the possibility of a sustained uptrend.
If this pattern confirms, PI price could gain enough momentum to challenge the resistance at $0.96.
A breakout above that level may open the door for further gains toward $1.30, and with strong follow-through, the price could even reach $1.67—levels not seen in recent trading activity.
However, the bullish scenario is not guaranteed. If the current uptrend loses steam and buying pressure weakens, Pi Network could retrace to test support at $0.66.
A breakdown below that level would likely shift sentiment more bearish, exposing the token to further downside toward $0.57.
While technical signals lean optimistic for now, traders will be closely watching whether the golden cross materializes and if resistance levels can be cleared convincingly.
The XRP Ledger (XRPL) just experienced its busiest week on record, processing more than 5.1 million transactions on June 15.
Unlike other networks that often rely on automated activity to boost numbers, this surge appears to have come from genuine user demand.
XRP Ledger Continues to Scale
According to blockchain analyst Ripple Van Winkle, users were actively involved in activities such as NFT minting, asset transfers, and decentralized trading, all contributing to the spike in volume.
He noted that XRPL handled the pressure without disruptions, keeping transaction fees low and performance stable throughout the day.
This event stands out because of the high volume and the network’s resilience. According to Van Winkle, XRPL recorded no delays, no spikes in transaction costs, and no reports of system strain.
Meanwhile, user participation across the network also appears to be growing.
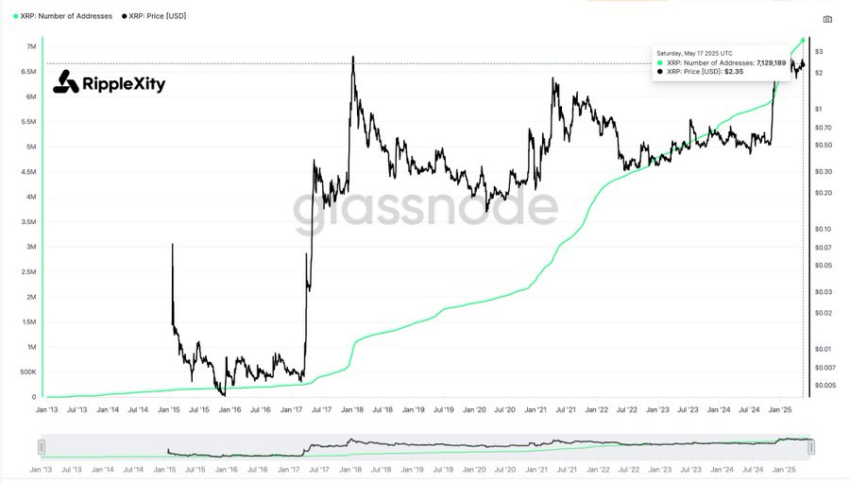
RippleXity, citing Glassnode data, reported that XRP wallet registrations have surpassed 7.1 million, while the number of wallets holding more than one million XRP has reached a new high above 2,700.
Market observers said these numbers signal that interest in XRP remains strong even as price action lags. According to them, it is a sign that the protocol is ready to support high-volume adoption without needing emergency interventions.
“This consistency matters as crypto matures. Institutions want boring reliability, not flashy experiments. XRPL is starting to look like the TCP/IP of crypto — invisible, stable, critical,” Van Winkle stated.
XRP Investors Take Profits as Altcoin’s Price Slides
According to BeInCrypto data, the token is trading around $2.07, down roughly 3% over the past 24 hours and nearly 15% this month.
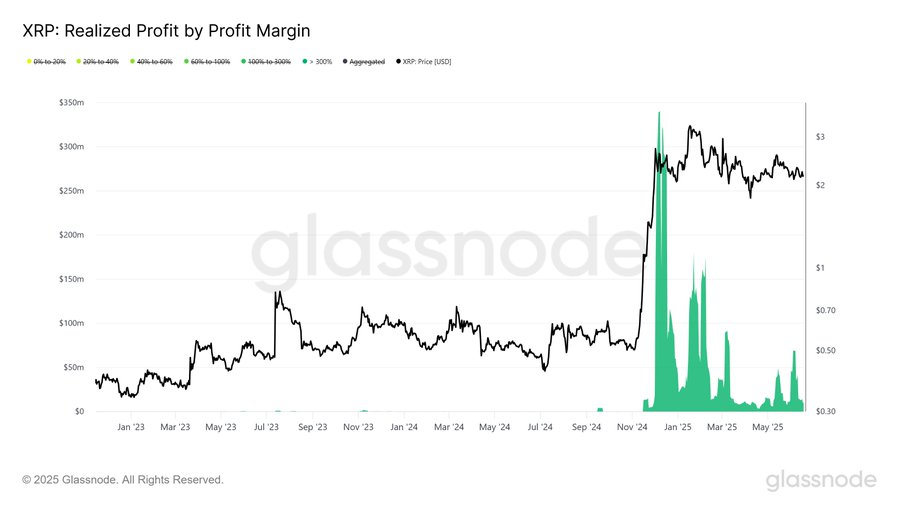
While these dips have frustrated some investors, others have seen it as an opportunity to lock in gains. Notably, data from Glassnode shows that long-term holders have begun realizing profits.
According to the blockchain analytical platform, XRP holders realized an average of $68.8 million daily gains in early June.
Glassnode explained that many of these exits are believed to be from buyers who entered before XRP’s rally in late 2024, when prices surged and peaked at $3.36 in January. Now, with the token down over 36% year-to-date, some whales appear to be selling.
“XRP is trading above $2, more than 3x higher than its base price before the sharp rally in November 2024. Investors who accumulated earlier are sitting on over 300% gains,” Glassnode stated.
Although this may reflect strategic profit-taking, it also points to the broader challenge of converting strong fundamentals into sustained upward price momentum.
Still, some analysts believe XRP may still find a second wind once the current wave of profit-taking subsides. They also point to the growing interest in XRPL, especially as stablecoin projects like USDC and tokenized US Treasuries begin to launch on the network.
The leading altcoin, Ethereum, experienced a challenging month in March, marked by a series of bearish trends that reflected a broader market slowdown.
However, as the market begins to show signs of recovery, the key question for April remains: Can Ethereum regain its bullish momentum?
Ethereum’s March Woes: Price Crash, Activity Slump, and Growing Supply Pressure
On March 11, Ethereum plummeted to a two-year low of $1,759. This prompted traders to “buy the dip,” triggering a rally to $2,104 by March 24.
However, market participants resumed profit-taking, causing the coin’s price to fall sharply for the rest of the month. On March 31, ETH closed below the critical $2,000 price level at $1,822.
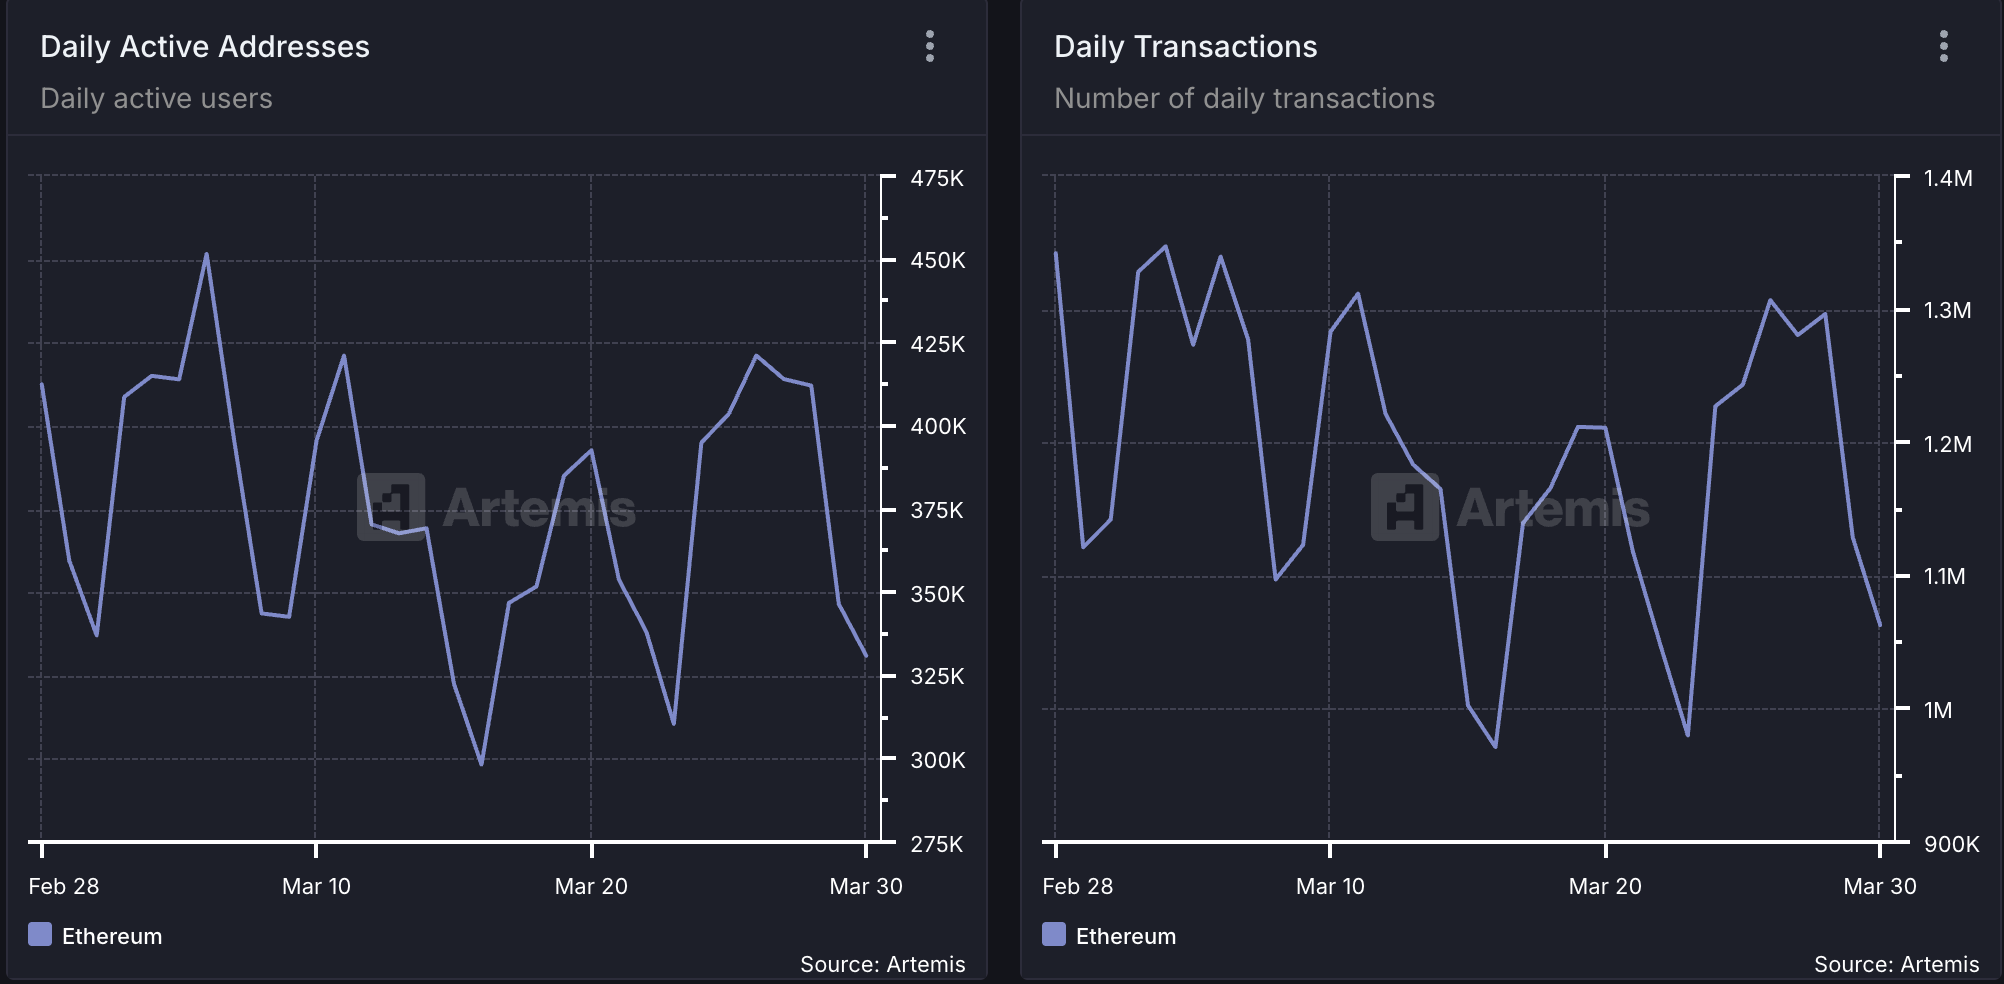
Amid ETH’s price troubles, the Ethereum network also experienced a severe decline in activity in March. Per Artemis, the daily count of active addresses that completed at least one ETH transaction fell by 20% in March.
As a result, the network’s monthly transaction count also plummeted. Totaling 1.06 million during the 31-day period in review, the number of transactions completed on Ethereum fell by 21% in March.
Generally, as more users transact and engage with Ethereum, the burn rate (a measure of ETH tokens permanently removed from circulation) increases, contributing to Ether’s deflationary supply dynamic. However, when user activity drops, ETH’s burn rate reduces, leaving many coins in circulation and adding to its circulating supply.
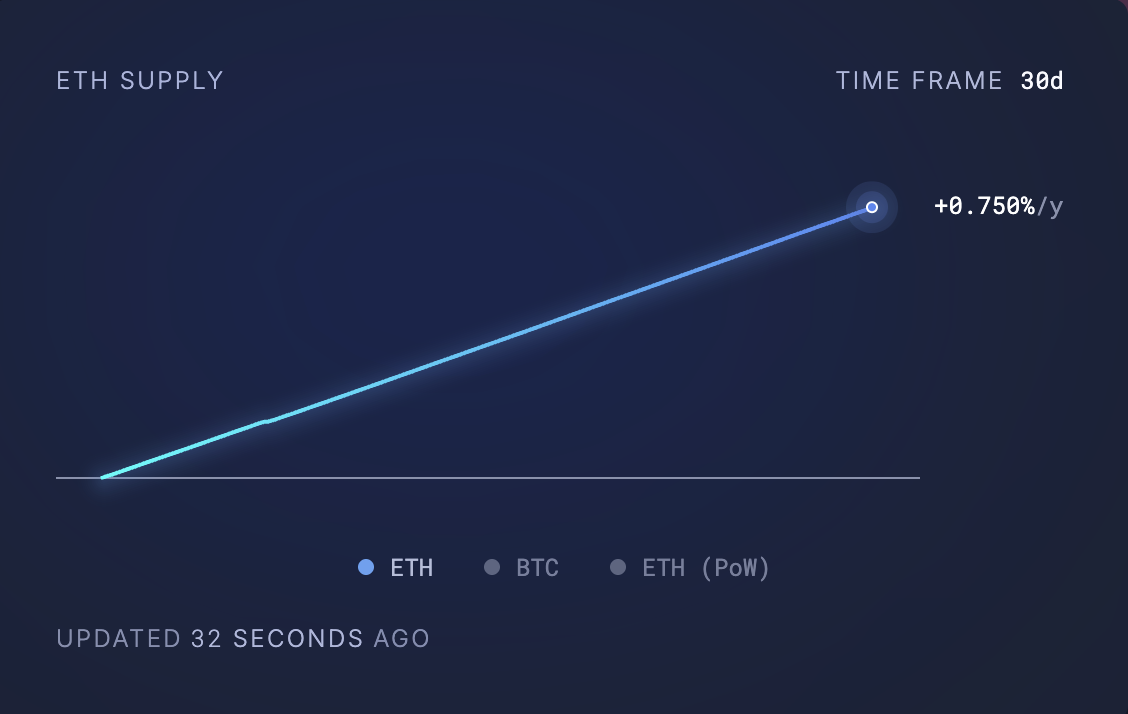
This was the case for ETH in March when it saw a spike in its circulating supply. According to data from Ultrasound Money, 74,322.37 coins have been added to ETH’s circulating supply in the past 30 days.
Usually, when an asset’s supply spikes like this without a corresponding demand to absorb it, it increases the downward pressure on its price. This puts ETH at risk of extending its decline in April.
What’s Next for Ethereum? Expert Says Inflation May Not Be a Major Concern
In an exclusive interview with BeInCrypto, Gabriel Halm, a Research Analyst at IntoTheBlock, noted that ETH’s current inflationary trends “may not be a major red flag” to watch out for in April.
Halm said:
“Even though Ethereum’s supply has recently stopped being deflationary, its annualized inflation rate is still only 0.73% over the last month, which is still dramatically lower than pre-Merge levels and lower than that of Bitcoin. For investors, this moderate level of inflation may not be a major red flag, provided that network usage, developer activity, and institutional adoption remain robust.”
Moreover, regarding whether Ethereum’s declining network activity has played a significant role in its recent price struggles, Halm suggested that its impact may be overstated.
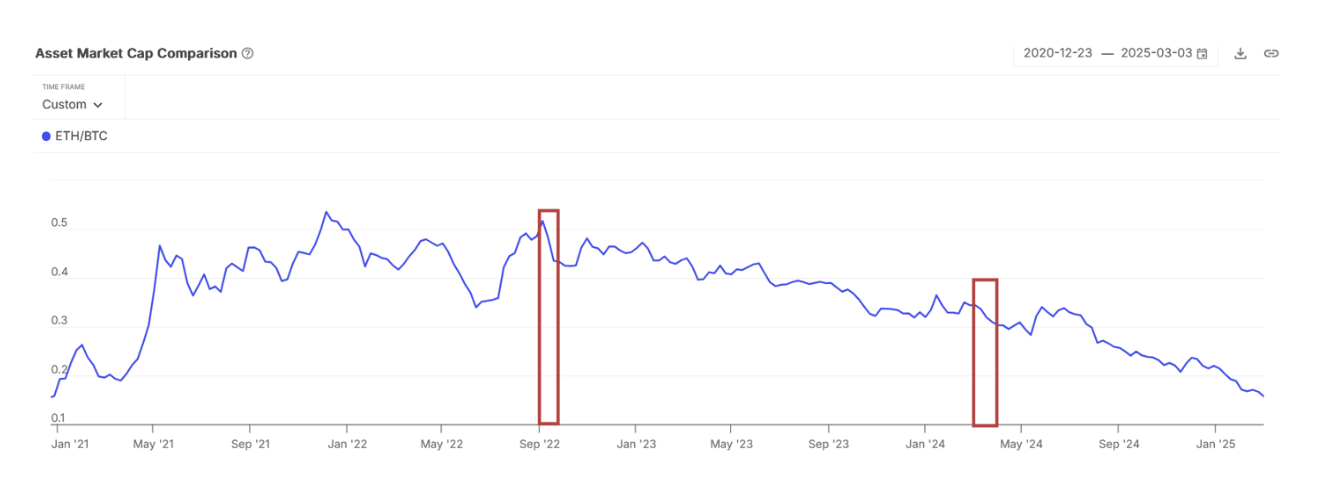
“Historically, from September 2022 to early 2024, Ethereum’s supply remained deflationary, yet the ETH/BTC pair still trended lower. This suggests that macroeconomic and broader market forces can play a far more significant role than token supply changes alone.”
ETH/BTC Market Cap Comparison. Source: IntoTheBlock
On what ETH holders should anticipate this month, Halm said:
“Ultimately, whether Ethereum dips or rallies in April will likely depend more on market sentiment and macro trends than on its short-term supply dynamics. Still, it’s essential to keep an eye on network developments that could spur renewed activity and reinforce ETH’s leading position in the broader crypto landscape.”