The SEC has delayed its decision on whether to allow staking for Grayscale’s proposed Ethereum spot ETFs.
The ETFs in question—Grayscale Ethereum Trust and Grayscale Ethereum Mini Trust ETF—were filed by NYSE Arca on February 14, 2025. The filing included a rule change request to enable staking as part of their investment strategy.
SEC Pushes Back Grayscale Ethereum ETF Staking Deadline July
The SEC deadline for deciding on the original proposal was set to conclude on April 17. Under the Securities Exchange Act of 1934, the SEC is authorized to extend this review period for up to 90 days.
The agency has now exercised that option. This now allows the SEC to decide on this filing by July 2025.
Staking would allow the ETFs to earn rewards by participating in Ethereum’s proof-of-stake consensus mechanism, a feature not yet approved for any US spot crypto ETF.
Grayscale has proposed that staking be conducted exclusively by the sponsor without commingling funds. Also, Coinbase Custody would continue safeguarding the ETH assets.
The SEC’s delay is part of a broader pattern of cautious regulatory scrutiny over crypto ETF innovations, including similar filings from other asset managers.
Raydium is releasing LaunchLab, a new token launchpad to compete with Pump.fun. The exchange announced this platform last month, and its full release has sparked community enthusiasm.
Pump.fun and Raydium have been locked in an intense competition in the Solana ecosystem. Last month, Pump.fun launched its own decentralized exchange, and now Raydium has introduced its own launchpad.
Raydium Increases Solana Dominance with new Launchpad
Raydium, Solana’s largest decentralized exchange, has the opportunity to make some serious gains in the near future. Solana meme coins are eyeing a comeback with heightened trade volumes and rising token prices, and the firm is releasing a long-awaited project.
Although it will compete with Pump.fun, Raydium’s launchpad services look more extensive. They will allow all kinds of tokens to be launched, not just meme coins, and these tokens can be directly traded on the exchange.
“Introducing LaunchLab, Raydium’s all-in-one token launchpad. Built for creators, developers, and the community. Get started with JustSendIt mode: launch a token, hit 85 SOL, [and] liquidity migrates to Raydium’s AMM INSTANTLY. Seamless, on-chain token creation. No migration fee. No gatekeepers,” the firm claimed in its launch announcement.
Last month, however, this same asset soared when Raydium first announced Launchpad. Pump.fun entered the DEX sector, and Raydium is enabling users to launch their own meme coins.
Since this launch announcement took place, RAY spiked around 10%, signifying the community’s enthusiasm.
There may be another explanation for this token rally in addition to community hype. Raydium also mentioned that all of Launchpad’s trading fees will go towards ecosystem development.
More specifically, 25% of these fees will directly fund buybacks of RAY tokens, while the other 75% go towards a Community Pool and Program fee.
These other funds can enable a few generous user incentives. Raydium claimed that Launchpad token creators can earn up to 10% of trading fees from the AMM pool post-graduation, and users can also receive SOL tokens from referring new clients. Token creators will also enjoy several other quality-of-life features.
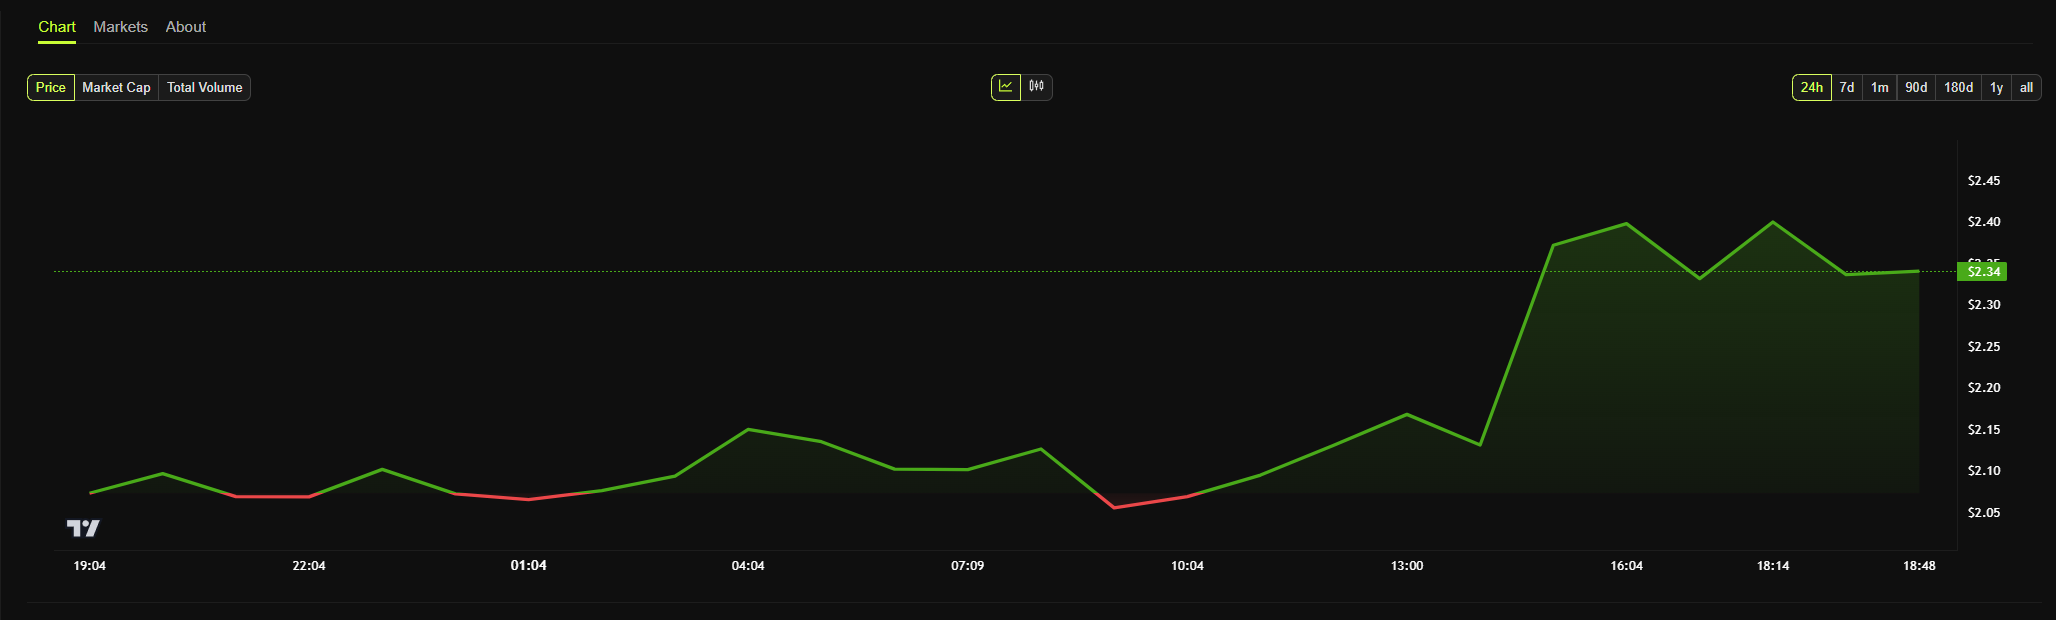
Onyxcoin (XCN) lost over 50% in February after a massive rally of nearly 2,000% between January 13 and January 26. Despite the ongoing decline, its recent indicators show mixed signals. RSI has stayed neutral for the past nine days, and ADX is pointing to a weakening downtrend.
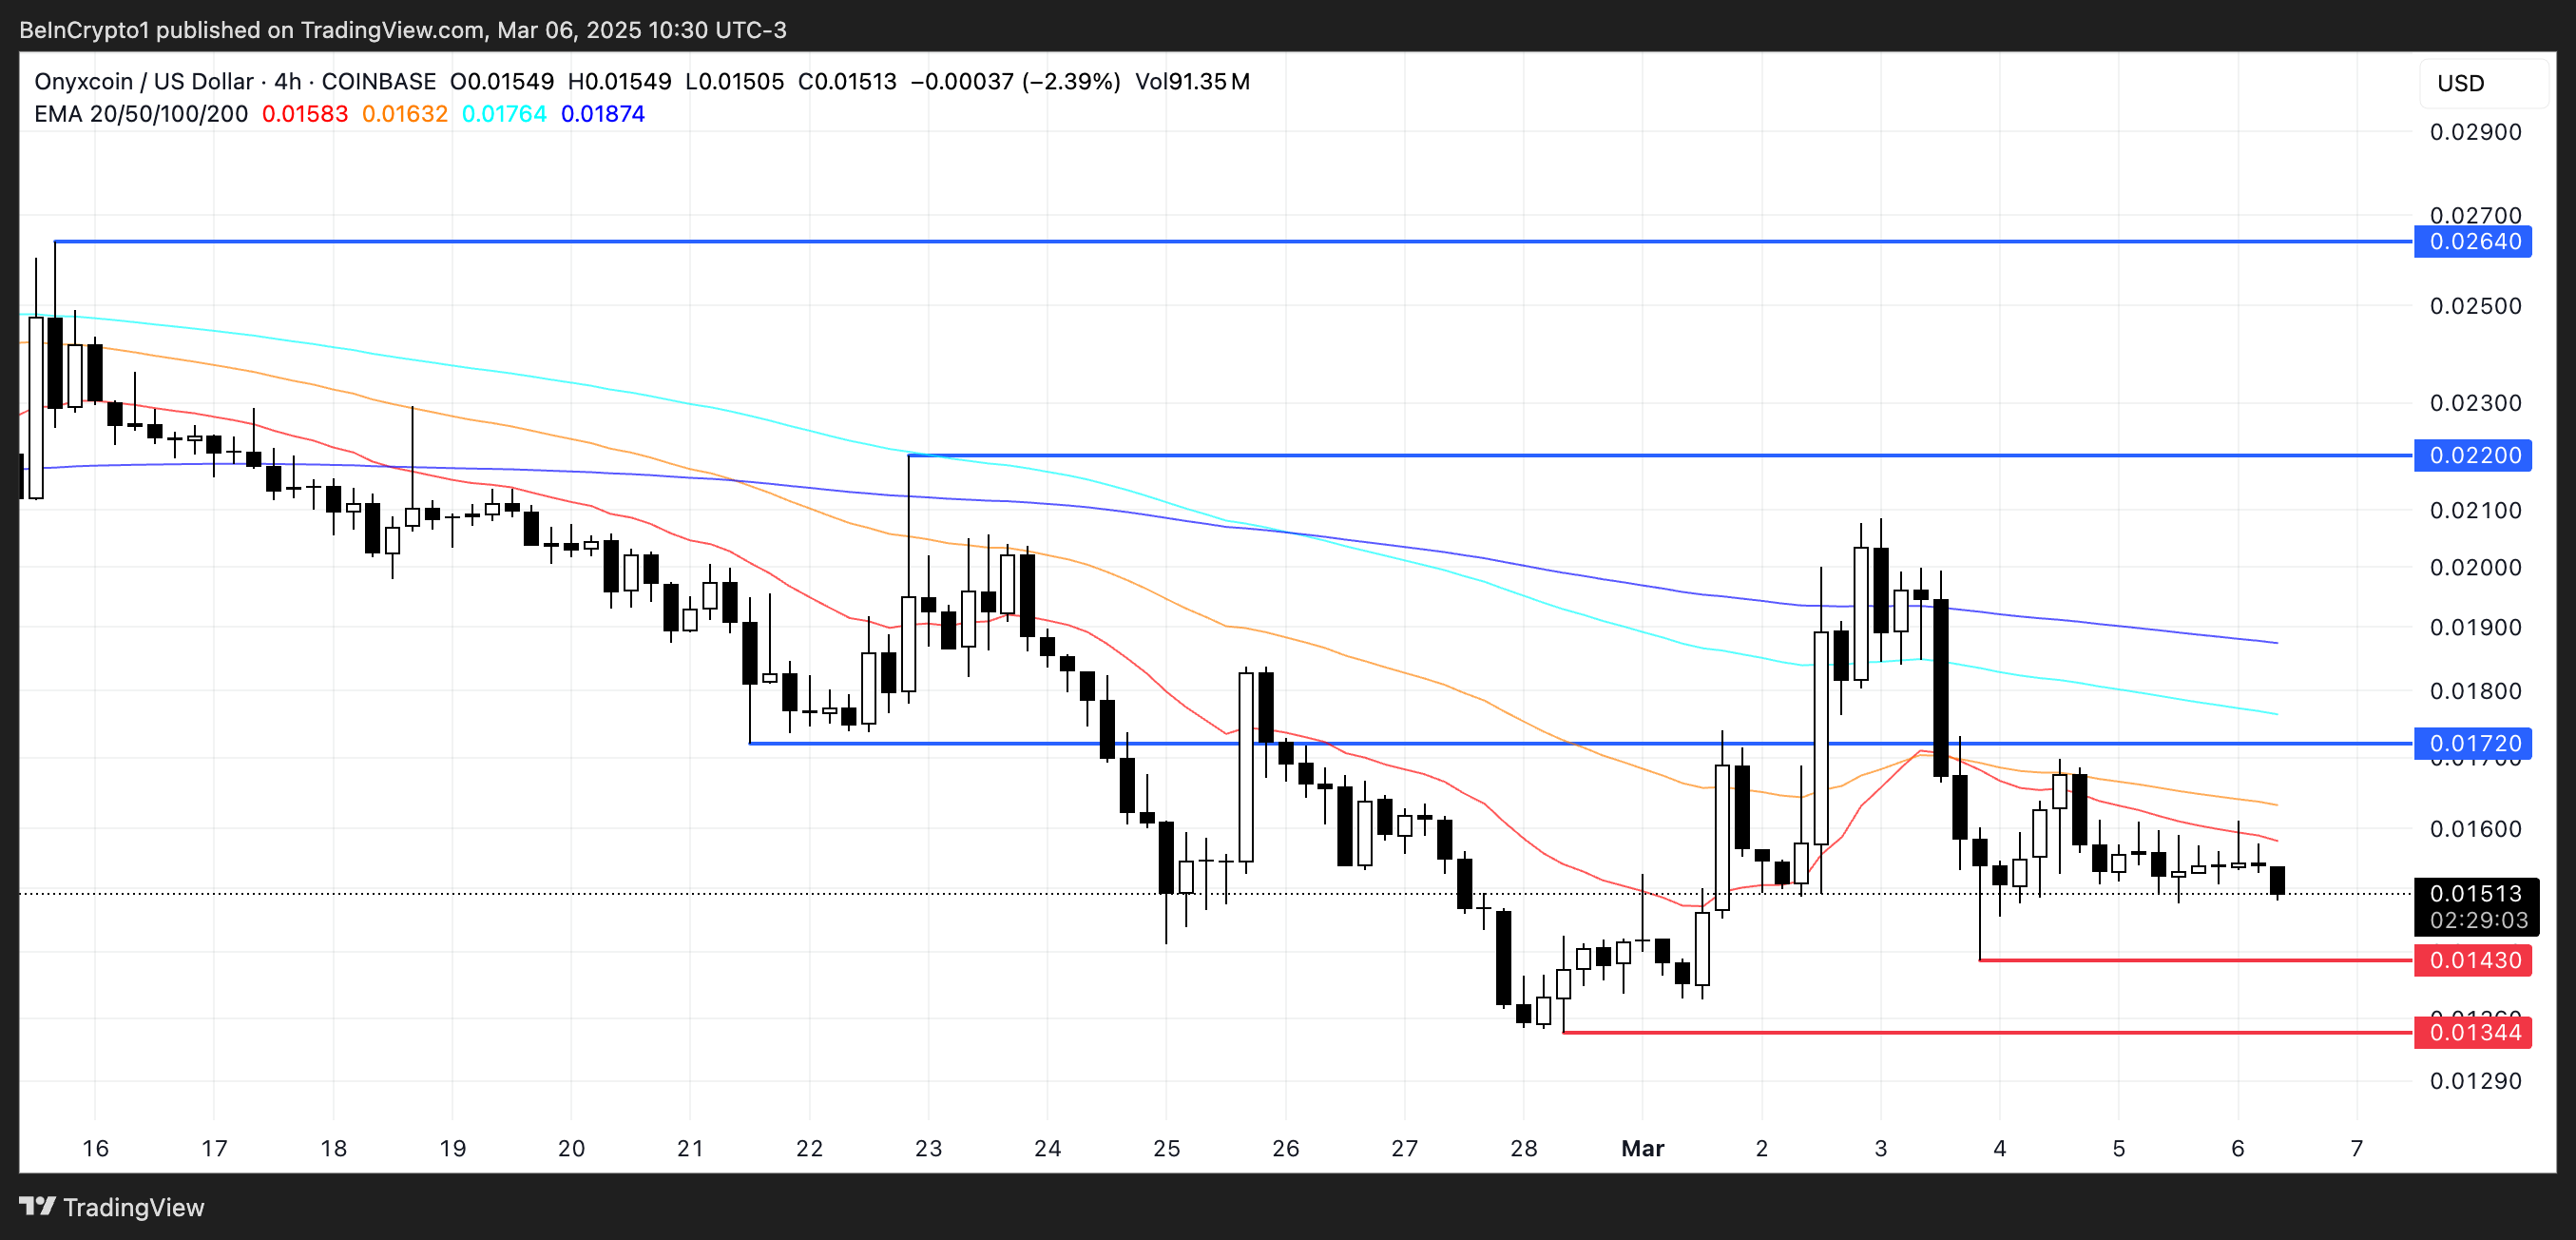
XCN is currently trading between resistance at $0.017 and support at $0.0143, with EMA lines still reflecting a bearish trend. Whether the price moves higher or lower will depend on whether momentum returns or if selling pressure continues to push XCN toward lower support levels.
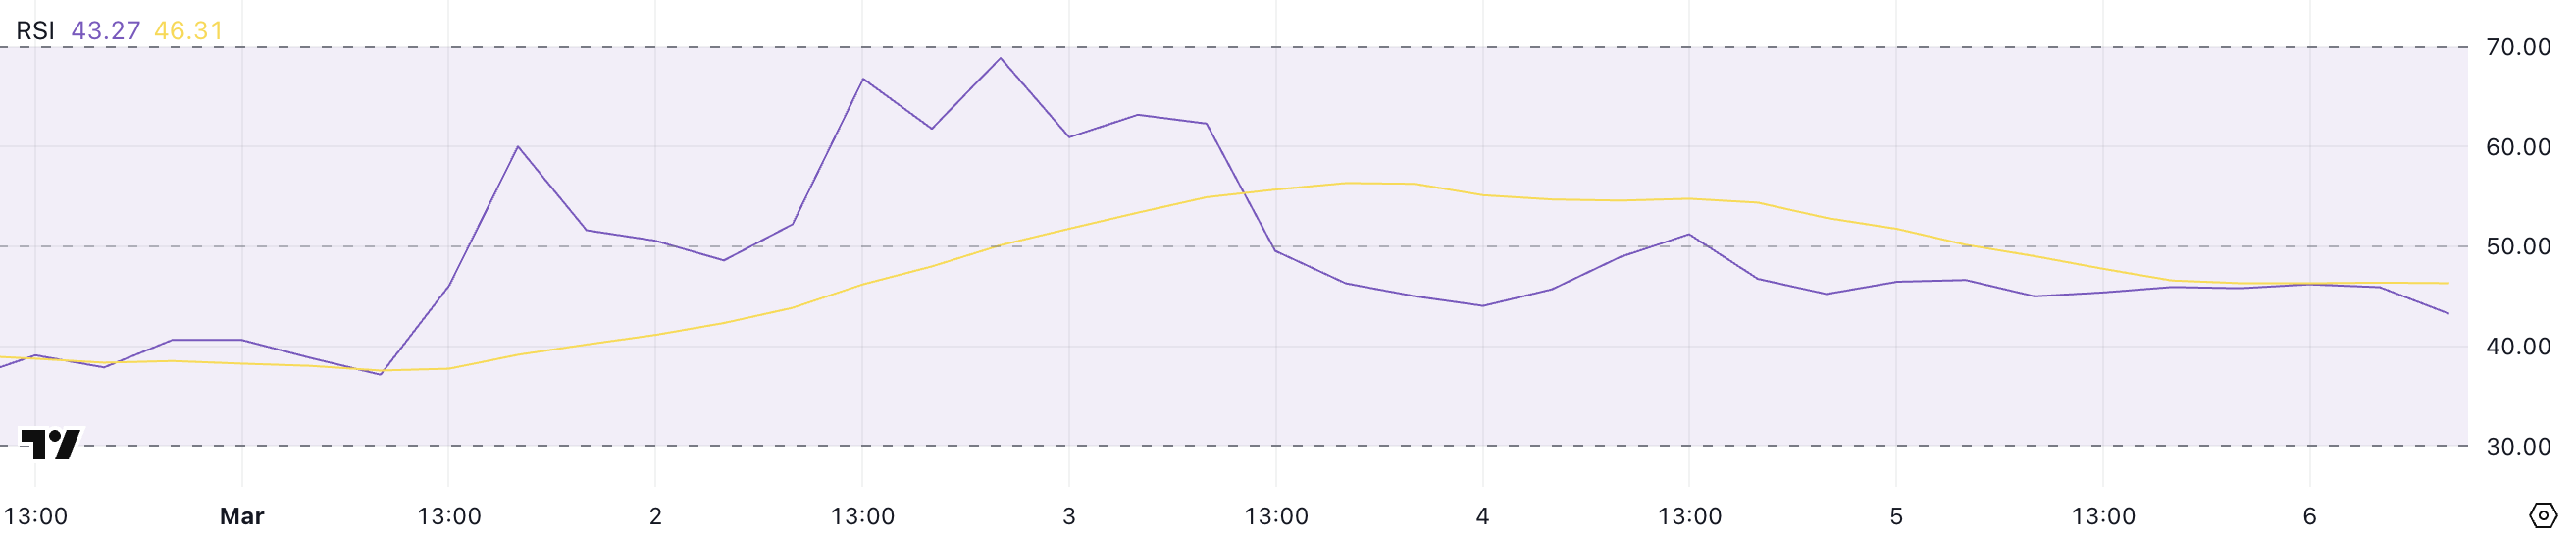
XCN RSI Has Been Neutral For 9 Days
Onyxcoin has an RSI of 43.2, down from its recent high of 68.9 on March 2.
Readings above 70 indicate overbought conditions, suggesting a potential pullback, while readings below 30 signal oversold conditions, which could precede a rebound.
With XCN’s RSI at 43.2, the asset remains in neutral territory, where it has been since February 25.
A move above 50 could indicate growing bullish momentum, while a drop toward 30 may signal increasing selling pressure.
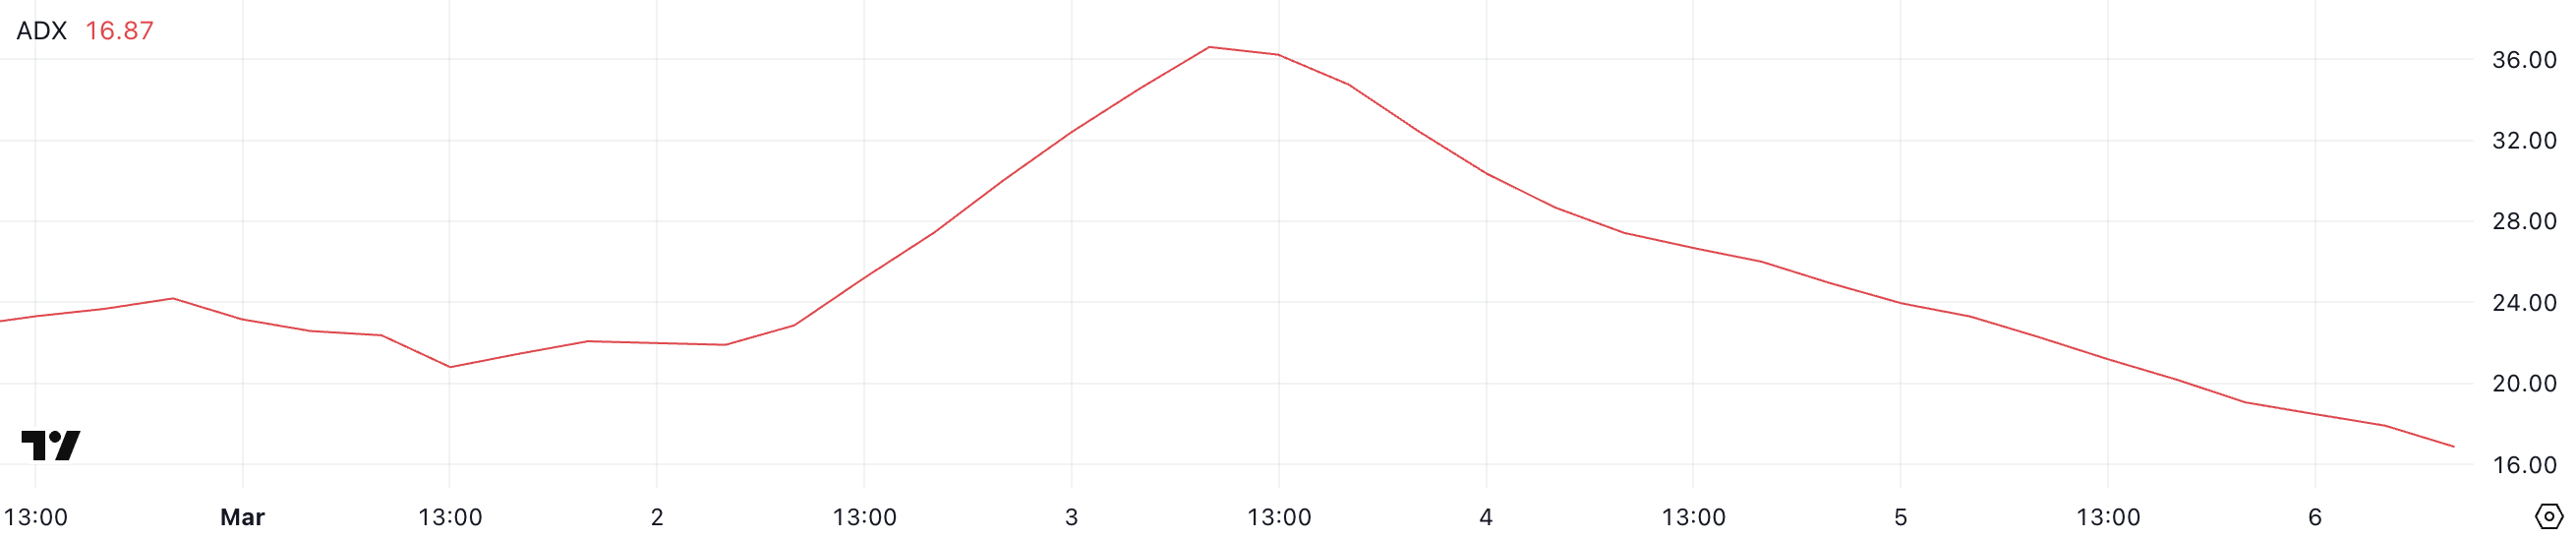
Onyxcoin ADX Shows the Downtrend Is Losing Steam
XCN’s ADX is 16.8, down from 36.6 three days ago, indicating a steady decline in trend strength. This drop suggests weakening momentum, aligning with XCN’s recent downtrend over the past few days.
The Average Directional Index (ADX) measures the strength of a trend on a scale from 0 to 100.
Readings above 25 typically indicate a strong trend, while values below 20 suggest weak or nonexistent trend momentum. With XCN’s ADX at 16.8, the current downtrend lacks strong conviction, meaning further downside may be limited unless momentum picks up again.
After a historical surge in January, when XCN was one of the best-performing altcoins in the market, Onyxcoin’s price is now trading between resistance at $0.017 and support at $0.0143. Its EMA lines show a bearish trend as short-term EMAs remain below long-term ones.
If the ongoing downtrend continues, XCN could test the $0.0143 support level, and a break below that could push the price further down to $0.0134.
However, ADX indicates that the downtrend is weakening, which could open the door for a reversal.
If buying momentum returns, Onyxcoin could test resistance at $0.017, and a breakout above that level could send the price toward $0.022. A stronger recovery, similar to its momentum in January, could push XCN as high as $0.0264.
Bitcoin (BTC) is up nearly 5% over ten days and is currently attempting to reclaim the $90,000 level. The recent uptick in whale activity, combined with strong technical indicators, is fueling optimism about a potential breakout.
Bullish patterns across both Ichimoku Cloud and EMA structures suggest the market may be gearing up for a move higher. As momentum builds, traders are watching closely to see if BTC can push toward the $100,000 mark in the coming weeks.
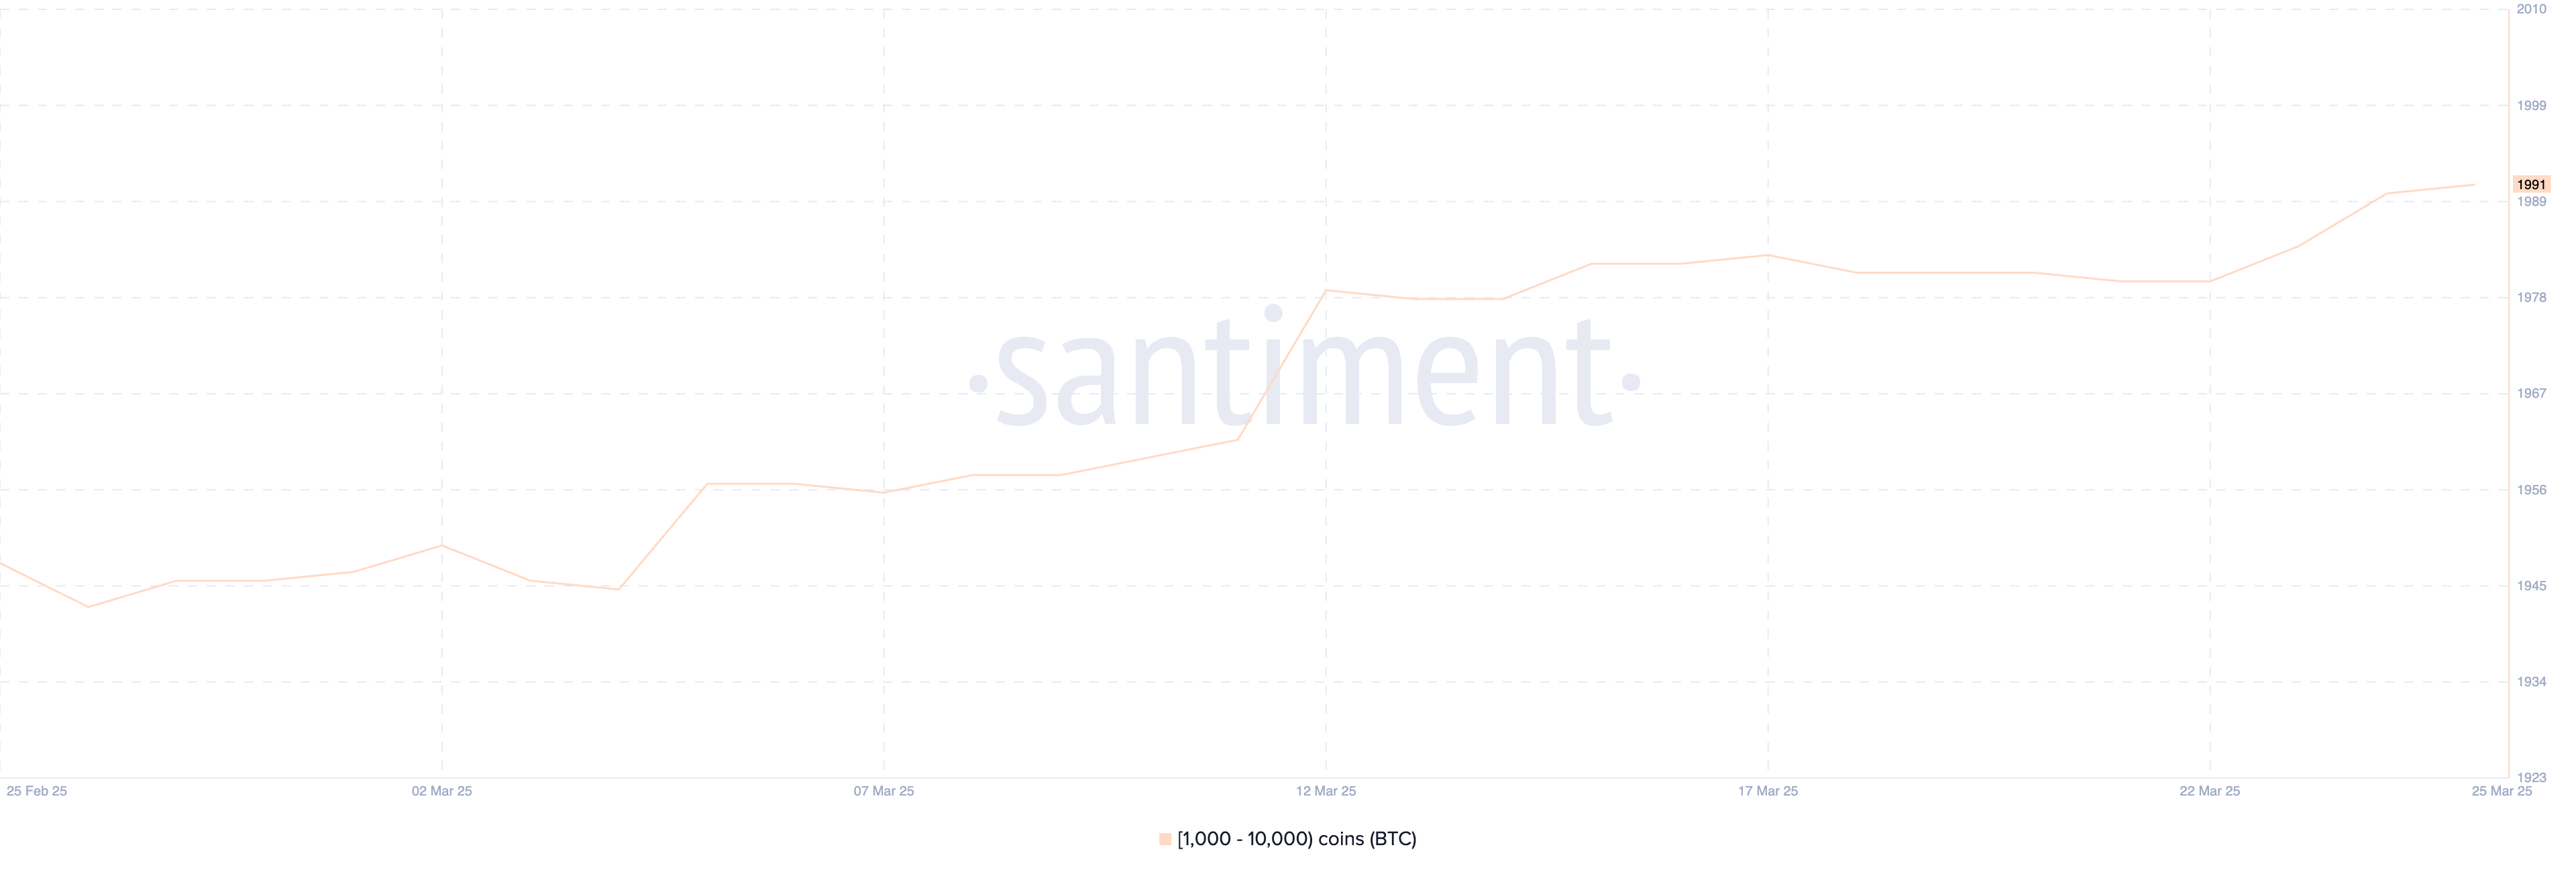
BTC Whales Reached Its Highest Level Since December 15
The number of Bitcoin whales—wallets holding between 1,000 and 10,000 BTC—increased from 1,980 on March 22 to 1,991 on March 25, marking the highest count since December 15.
Although modest, this rise is significant as it reflects renewed accumulation by large holders after more than three months of subdued activity.
Tracking whale wallets is crucial because these large players often move markets; their accumulation or distribution patterns can serve as early signals of broader sentiment shifts or major price moves.
Whales are typically considered “smart money,” and when their numbers rise, it often suggests increased confidence in the market’s near-term outlook.
Although the growth rate of new whales has slowed in recent days, the fact that their count has reached a multi-month high signals underlying strength.
It could imply that institutional or high-net-worth investors are positioning themselves ahead of a potential bullish move, adding weight to Bitcoin’s current support levels and possibly paving the way for further upside if momentum continues.
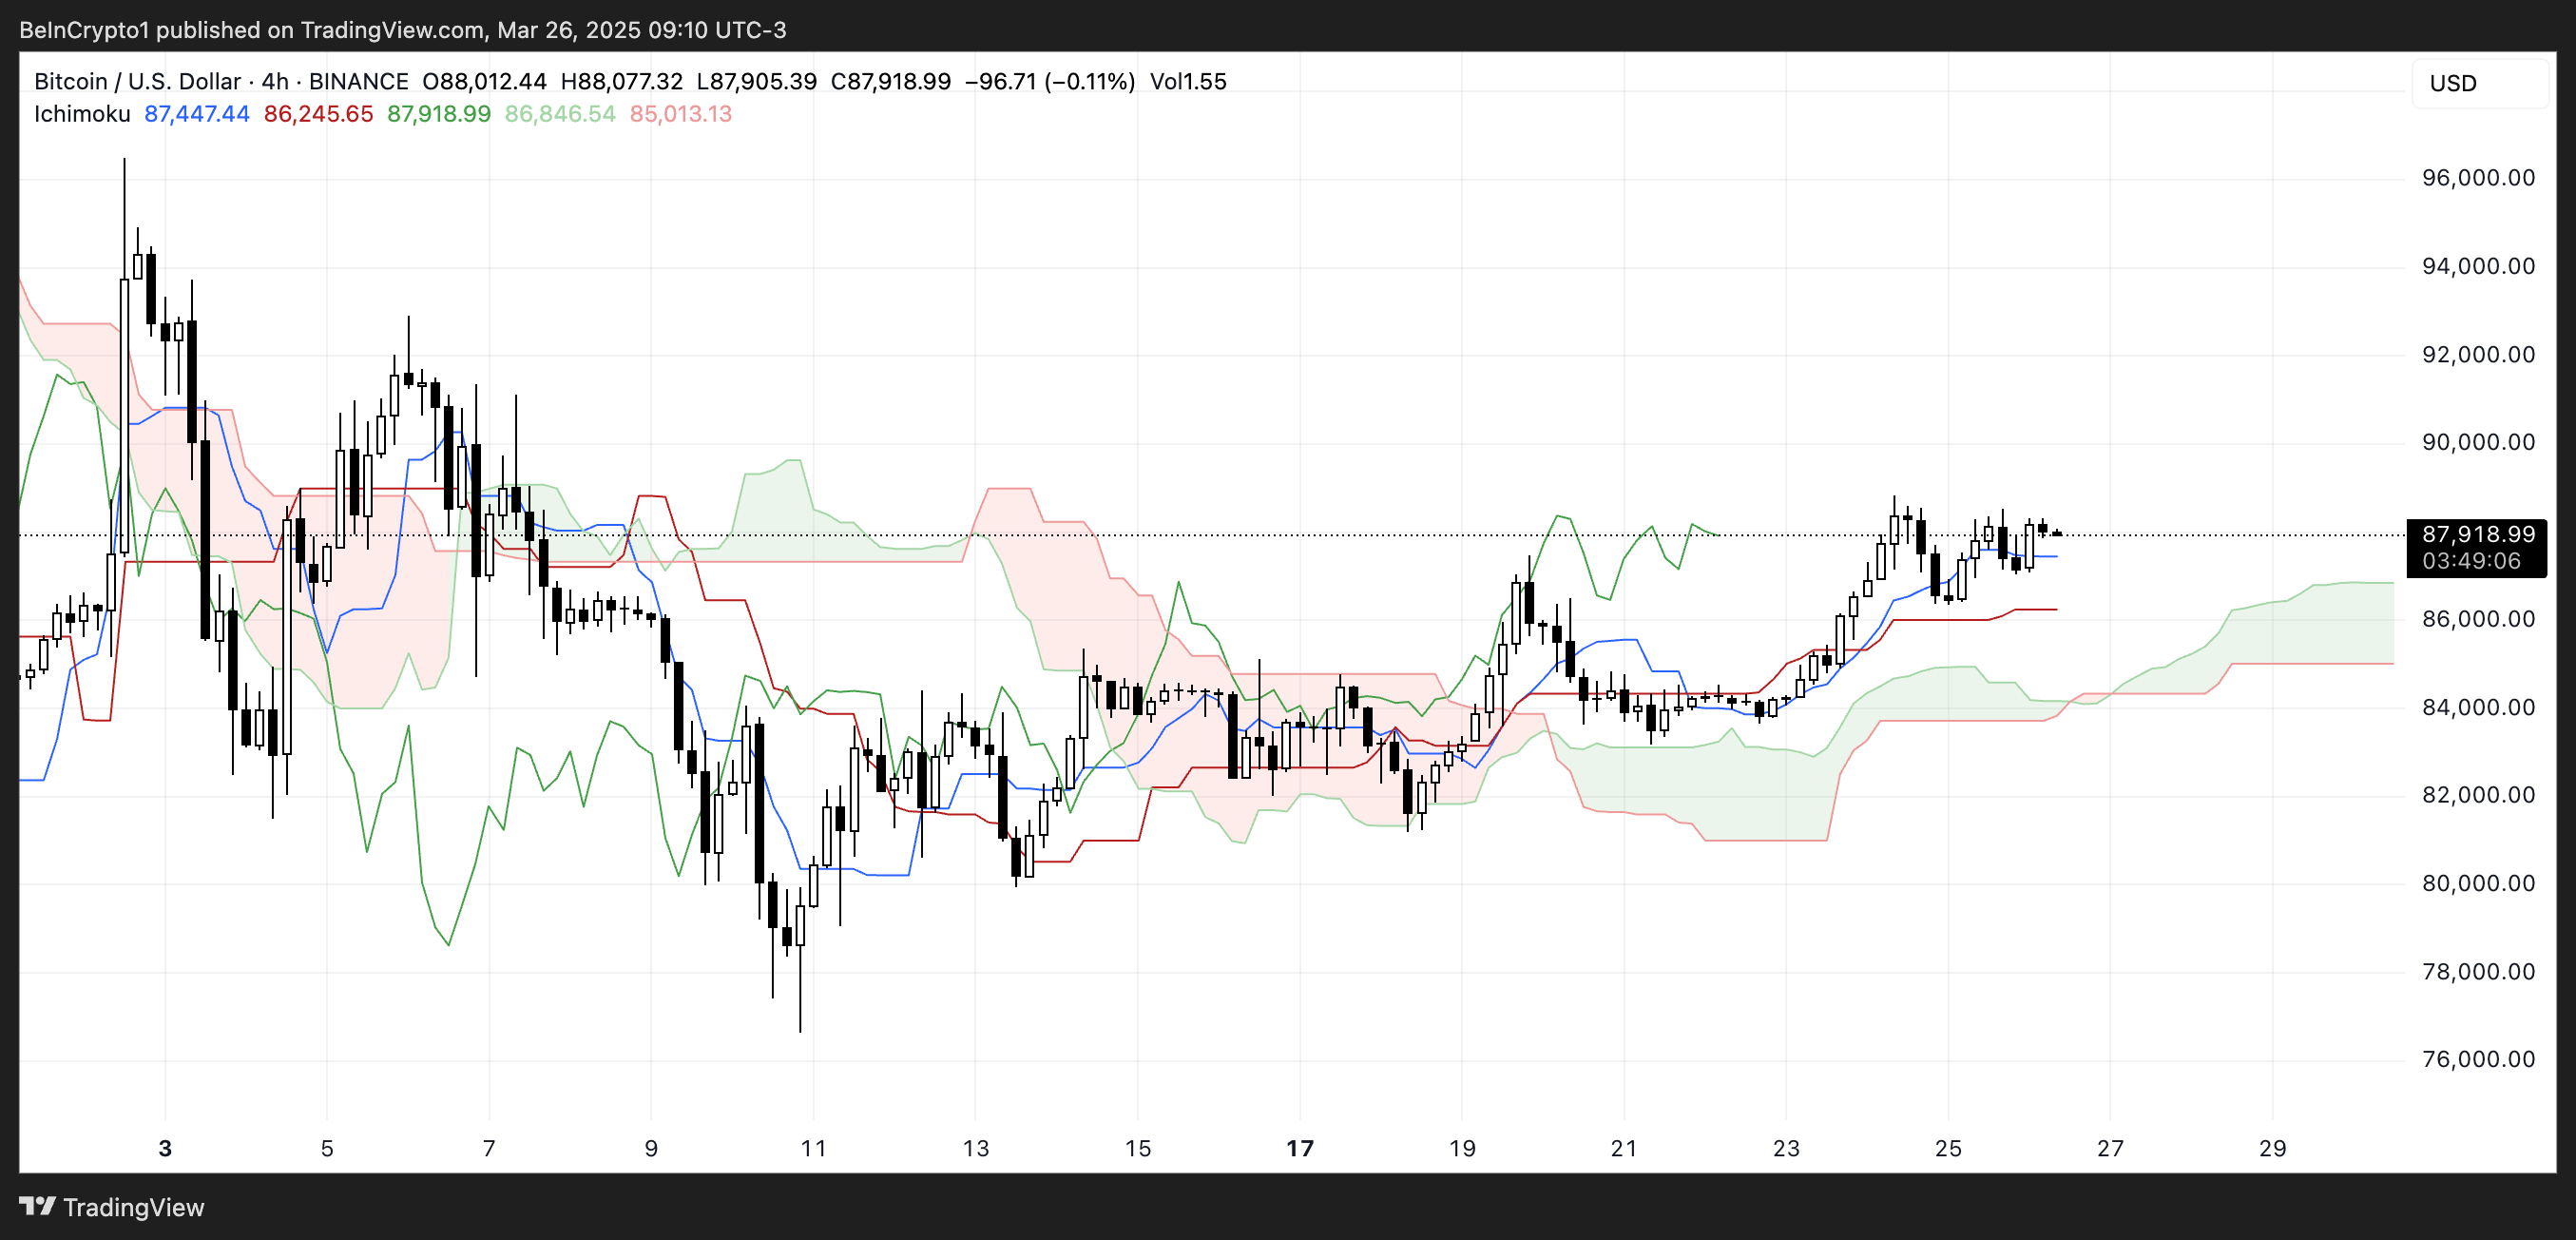
Bitcoin Ichimoku Cloud Paints A Good Momentum
Bitcoin’s Ichimoku Cloud chart is showing a bullish structure, with price action clearly above the cloud and the cloud itself turning green and rising ahead.
The Tenkan-sen (blue) is above the Kijun-sen (red), indicating that short-term bullish momentum is still in play. However, the two lines have started to flatten, suggesting a possible pause or consolidation.
The future cloud (Kumo) is wide and sloping upward, which signals solid underlying support and growing trend strength. Additionally, the Chikou Span (lagging line) is positioned well above past price action, further confirming bullish sentiment.
While there may be some sideways movement in the short term, the overall Ichimoku setup continues to favor the bulls unless a breakdown below the cloud shifts the outlook.
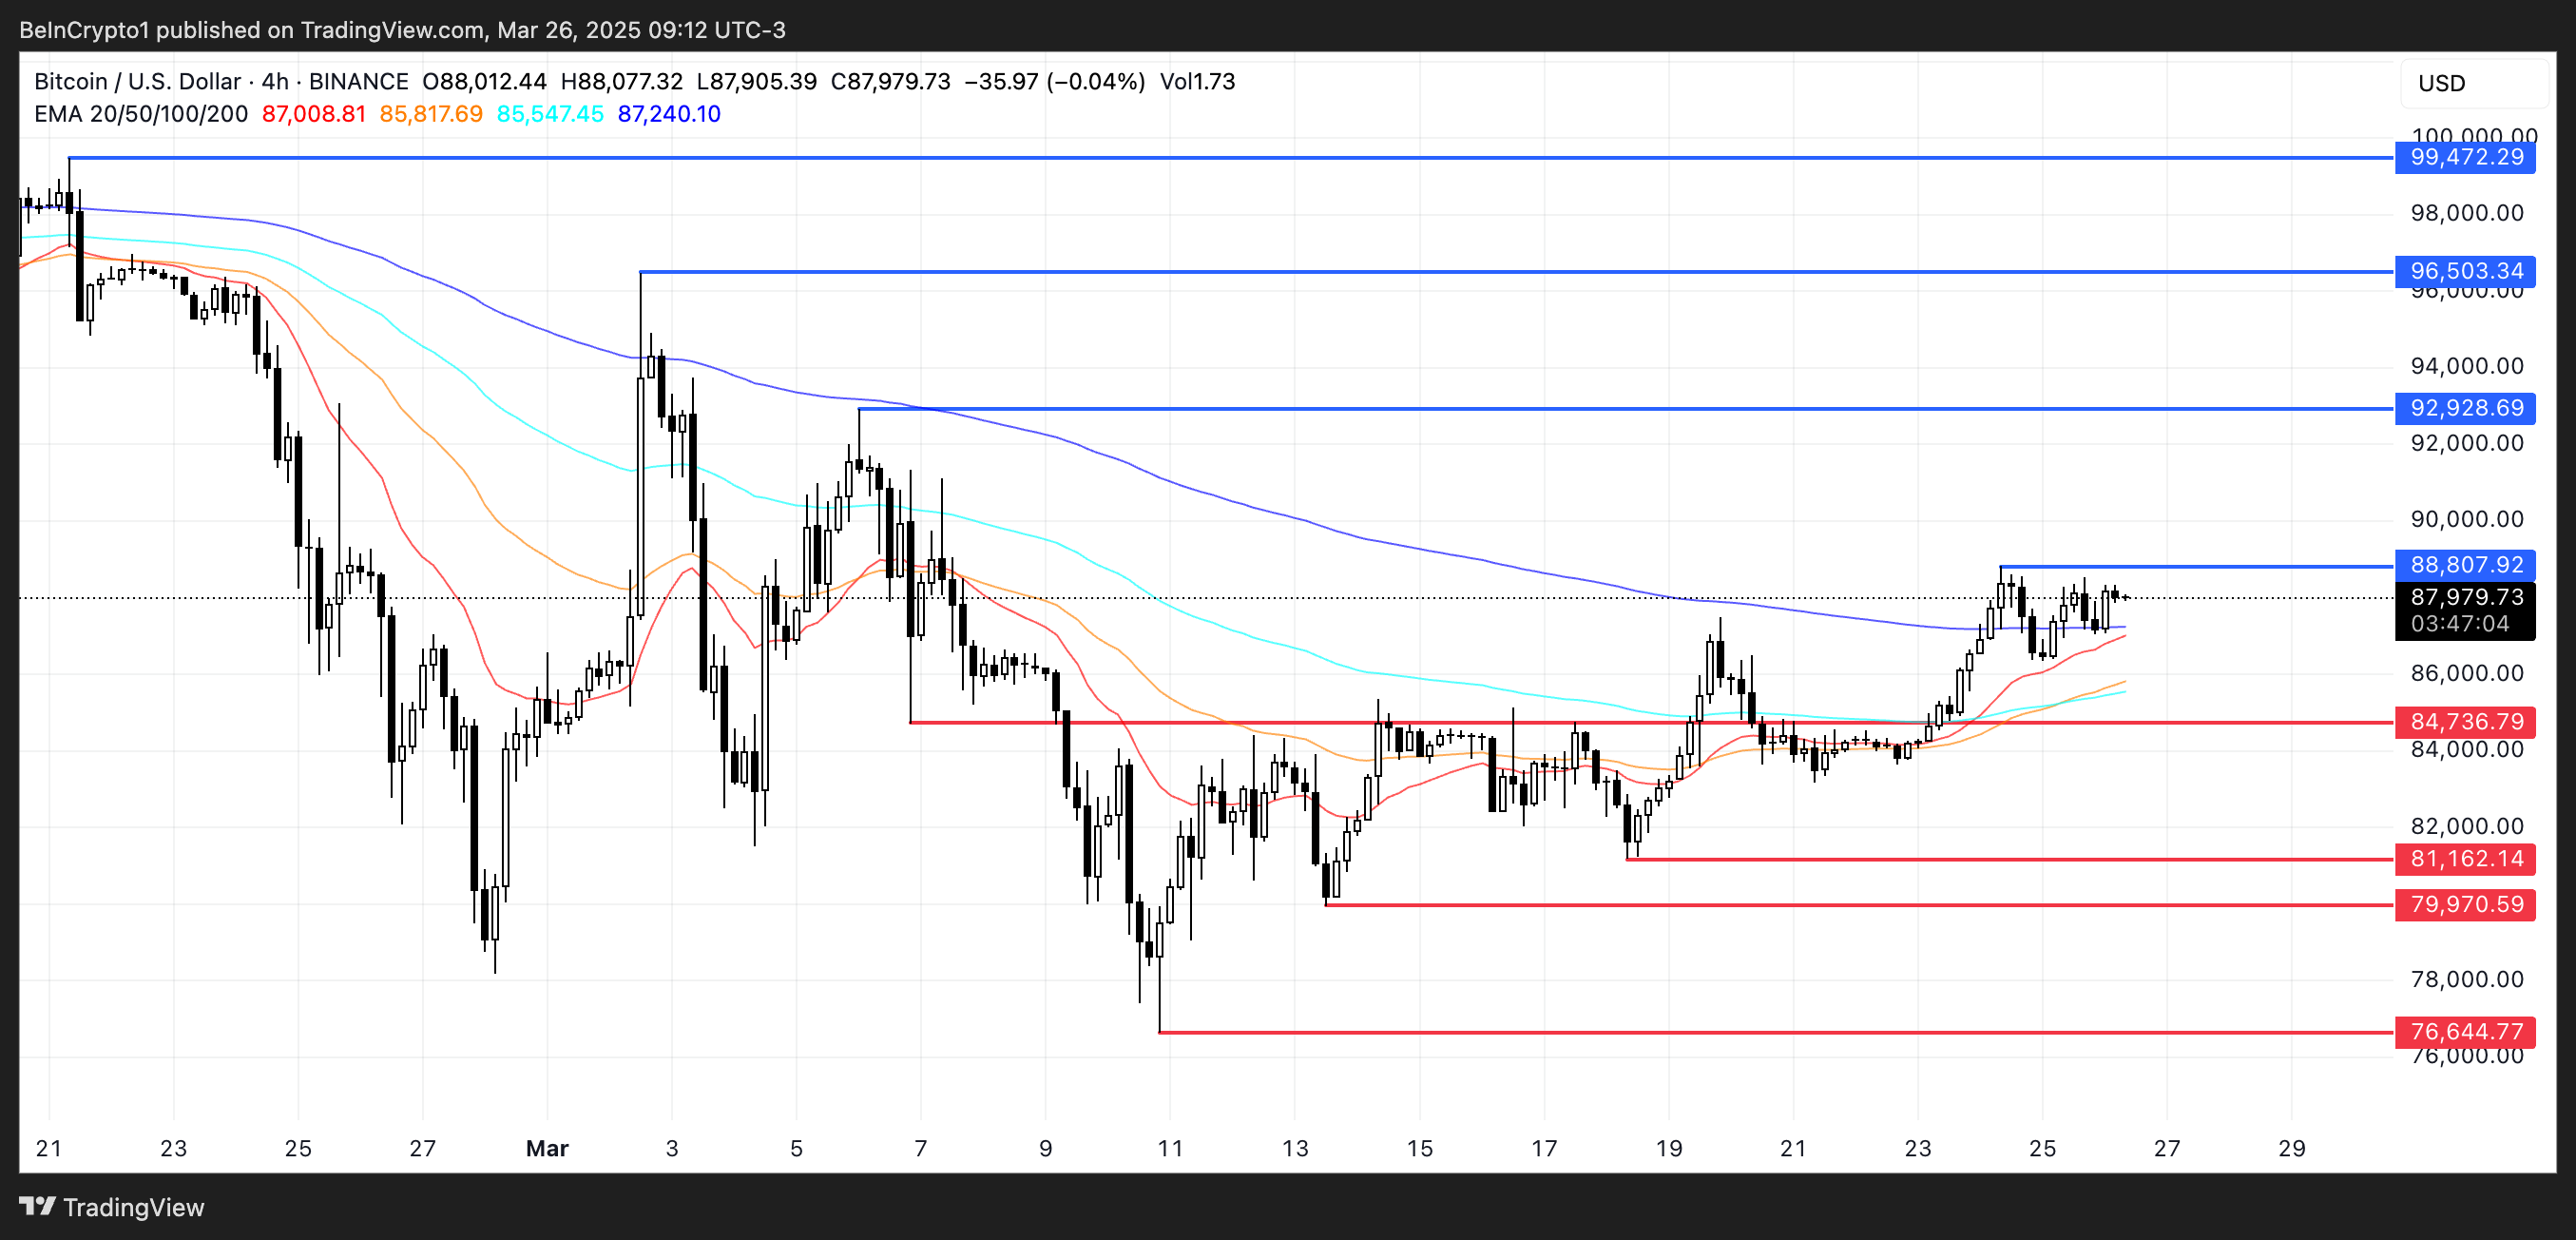
Will Bitcoin Rise Back To $100,000 In April?
Bitcoin’s EMA lines are aligning for a potential golden cross, which could signal the start of a fresh bullish phase. If this crossover happens and Bitcoin price manages to break the resistance at $88,807, it could trigger a move toward $92,928.
A strong continuation of the uptrend might then send Bitcoin to test $96,503 and $99,472, with a possible breakout above $100,000 if momentum accelerates.
On the other hand, if Bitcoin fails to break above $88,807 and faces a trend reversal, it could pull back to test the support at $84,736. A break below that level could lead to further downside toward $81,162.
If selling pressure continues, BTC might even revisit $79,970 and $76,644, potentially falling back below the $80,000 mark.