As Pi Day is just one day away, panic is growing among Pi Network users, known as Pioneers. Many fear they could lose their Pi coins due to issues with the Know Your Customer (KYC) verification process. With the final deadline set for March 14, 2025, frustration is at an all-time high as users struggle to get verified in time.
Users Face KYC Challenges
Tap to Earn Pi Network has recently announced that any user who does not complete KYC and transfer their balance to the Mainnet by 8:00 AM UTC on March 14, 2025, will lose most of their mobile balance. The team says this is necessary to keep the network clean from unverified accounts.
However, many users say they have tried to complete KYC multiple times without success. Crypto enthusiast Rod Thompson has called this one of the biggest issues in crypto, claiming he could lose over 10,000 Pi coins because some of his referrals have not completed KYC.
He also pointed out that Pi Network profits from ads shown during daily mining, making the situation feel unfair.
Others have also shared their frustration, saying their KYC applications have been pending for over two years. Some users have no option to reapply, leaving them in limbo and raising concerns about the fairness of the system.
Concerns Over Rewards and Balance Transfers
Aside from KYC problems, users have reported balance inconsistencies. Some claim their unverified balance continues to grow, but their transferable balance remains small. This has led to doubts about the transparency of the platform.
Another complaint is unfair reward distribution. Some long-term miners with referrals have received fewer Pi coins than others who mine irregularly, causing frustration.
Additionally, many users struggle to move their Pi coins to the Mainnet, even after completing all the steps. Due to long lock-up periods, some have even started selling their accounts on unofficial platforms, raising concerns about the project’s credibility.
Pi Coin Price Rises Despite Frustration
Despite these issues, Pi Coin’s price has surged by nearly 7% in the past 24 hours as investors prepare for Pi Day. Some analysts believe this rise is driven by speculation about potential announcements on March 14.
However, with the final KYC deadline approaching and many users still unable to verify their accounts, the future of Pi Network remains uncertain.
In the past 48-hours, Cardano price faced rejection at the channel’s upper border, coinciding with renewed trade pressures. As, Donald Trump’s announcement of a 50% tariff on the European Union, effective June 1, has reignited concerns.
Despite this looming threat, ADA’s price has remained stable, indicating that the market has adjusted to such sentiments, with investors showing less volatility. Some experts even suggest that ADA’s current consolidation pattern may lay a healthier foundation for a potential breakout toward the $1 range.
Additionally, this week, Messari released its Q1 report, highlighting some positive metrics despite Cardano’s financial challenges. The report indicates that the community remains resilient, focusing on long-term growth and stability. Keep reading to know more.
Analyst Says Cardano Price Aims $1
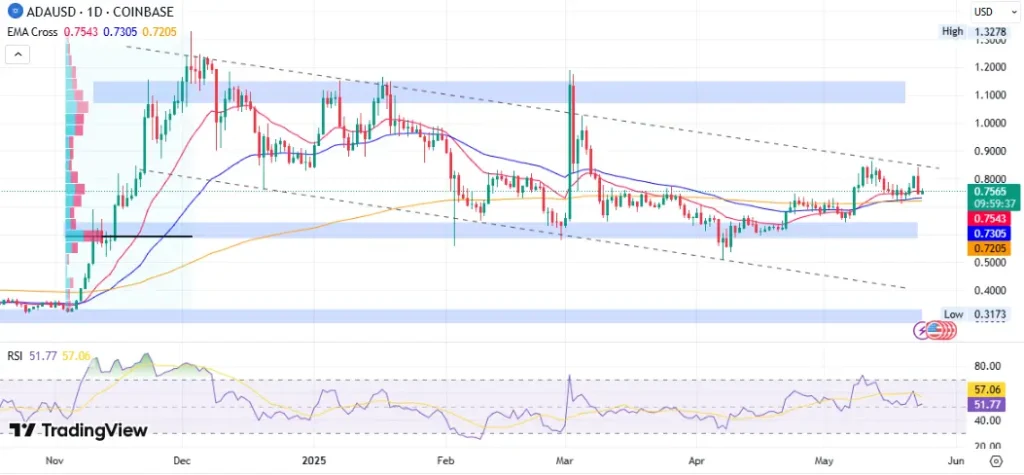
Cardano’s price has been caught in a lengthy consolidation phase within a falling channel, largely influenced by ongoing trade tensions between the U.S. and other countries. This trade climate pushed ADA price down to the $0.50 mark in April.
However, a turning point came in mid-April when ADA began to recover, climbing to the upper boundary of the channel and reaching $0.85 in May. This rebound was fueled by a decrease in trade tensions, particularly after the UK signed a significant deal.
However, recent tensions with EU resurfacing has left many investors worried, but knowing the threat ADA price has not fallen beneath key EMA’s, and until it doesn’t break key supports the bullish views remain intact.
More to its price, a deep analysis of this week has been at the center of attraction. According to technical analysis from Dan Gambardello, the Cardano price action displays a markedly different pattern compared to its previous bull market cycle.
He says, unlike the last cycle where ADA experienced a single dip after exiting the bear market before going parabolic, the current consolidation shows a more methodical approach with repeated pump and consolidate phases.
This extended consolidation period is a “coiling” effect. He feels that Cardano price could smash $1, if it meets all bullish conditions.
Gambardello notes that this coiling behavior is not limited to Cardano price. The extended sideways movement has allowed for healthier price support levels, in other altcoin’s too.
Additionally, Analyst Dan Gambardello uses Ethereum as a roadmap for altcoin performance. He noted that ETH is currently testing a multi-cycle trend line that has historical importance for the entire altcoin sector.
Ethereum breakout would cause an altcoin move. It would be a more favorable time for tokens like Cardano crypto that have consolidated and formed technical bases in this extended build-up phase.
Cardano’s Report By Messari: Total Stablecoin Market Cap & ADA’s Treasury Balance Increased
In a recent report, by Messari said that Cardano’s performance during Q1 2025 was tough. It revealed that its quarter was filled with challenges. As its native token, ADA price, took a hit, which led to a decline in its circulating market cap.
Despite these hurdles, Cardano still made significant strides in governance, like the activation of the Plomin Hard Fork was the biggest accomplishment.
Interestingly, the report further highlighted that, while the ADA price volatility affected its most of the market sentiment, but the commitment to staking still remained remarkably stable.
The stats showed that the total staked ADA saw only a slight decrease of 1%, settling at 21.6 billion ADA.
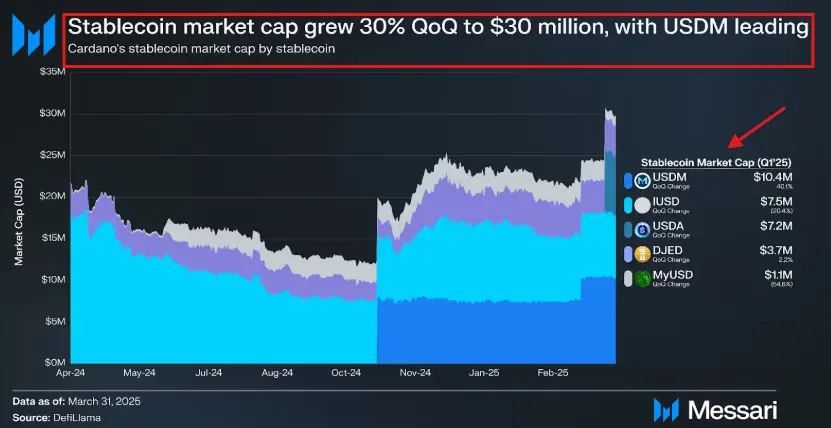
In contrast, some metrics performed exceptionally like the stablecoin market, messari said that it expanded by 30% to reach a market cap of $30.1 million. This increased was largely driven by the popularity of fiat-backed options like USDM, IUSD, USDA, and others.
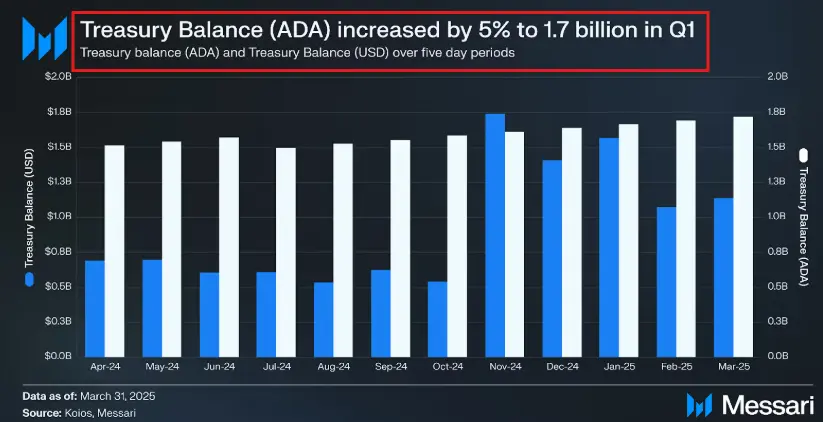
Additionally, Cardano’s treasury balance showed resilience, increasing by 5% quarter-over-quarter to 1.7 billion ADA. However, the U.S. dollar value of the treasury took a hit, dropping 19% to approximately $1.1 billion.
Overall, while Cardano faced financial challenges, its governance advancements and stable staking commitment highlight the community’s ongoing dedication to the platform’s future.
Never Miss a Beat in the Crypto World!
Stay ahead with breaking news, expert analysis, and real-time updates on the latest trends in Bitcoin, altcoins, DeFi, NFTs, and more.
The post Cardano (ADA) Price Holds Ground Amid EU Tariff Threat, Analysts Eye $1 Breakout appeared first on Coinpedia Fintech News
In the past 48-hours, Cardano price faced rejection at the channel’s upper border, coinciding with renewed trade pressures. As, Donald Trump’s announcement of a 50% tariff on the European Union, effective June 1, has reignited concerns. Despite this looming threat, ADA’s price has remained stable, indicating that the market has adjusted to such sentiments, with …
Eric Council Jr., 26, of Athens, Alabama, has been sentenced to 14 months in federal prison for his involvement in a cybercrime conspiracy. The case involved the hacking of the U.S. Securities and Exchange Commission’s (SEC) official X (formerly Twitter) account. Eric Council Jr Sentenced to 14 Months According to a statement from federal authorities, Eric Council Jr conspired with others to gain access to the US SEC’s X account by carrying out a SIM swap. On January 9, 2024, a false post was published from the account, falsely claiming the SEC had approved Bitcoin Exchange Traded Funds (ETFs). Bitcoin’s price rose quickly by more than $1,000 before falling after the SEC confirmed the post was not legitimate. Eric Council Jr pleaded guilty in February 2025 to conspiracy to commit aggravated identity theft. U.S. District Judge Amy Berman Jackson sentenced him to 14 months in prison, ordered the forfeiture of… Read More at Coingape.com