The Mexican Peso (MXN) has continued its upward trajectory, buoyed by softer-than-expected inflation data and growing expectations of a rate cut by the Bank of Mexico (Banxico).
Inflation Eases in Mexico
Mexico’s headline inflation rate slowed to 4.55% in November, down from 4.76% in October. This decline, which was lower than market forecasts, signals a cooling of inflationary pressures in the country. Core inflation also softened, easing to 3.58% from 3.8% in the previous month.
The softer inflation data has increased speculation that Banxico may cut interest rates in its upcoming policy meeting on December 14th. This expectation, coupled with the potential for a rate cut by the US Federal Reserve, has further supported the MXN.
US Dollar Stumbles as Rate Cut Hopes Grow
The US Dollar Index (DXY) has struggled to gain momentum despite a strong November jobs report. While the US economy added 227,000 jobs, the unemployment rate unexpectedly ticked up to 4.2%. This has led to increased speculation that the Fed may cut rates in December to mitigate the risk of a recession.
Technical Outlook for USD/MXN
The USD/MXN pair remains in a downtrend, with a key support level at 20.00. A break below this level could trigger a deeper correction towards 19.75. On the upside, resistance levels are located at 20.25, 20.60, and 20.80.
The Mexican Peso has benefited from easing inflationary pressures and growing expectations of a rate cut by Banxico. The US Dollar, on the other hand, has struggled to gain traction as investors anticipate a potential rate cut by the Fed. As we move into the final weeks of the year, market participants will be closely watching economic data releases from both Mexico and the US for further clues on monetary policy directions.
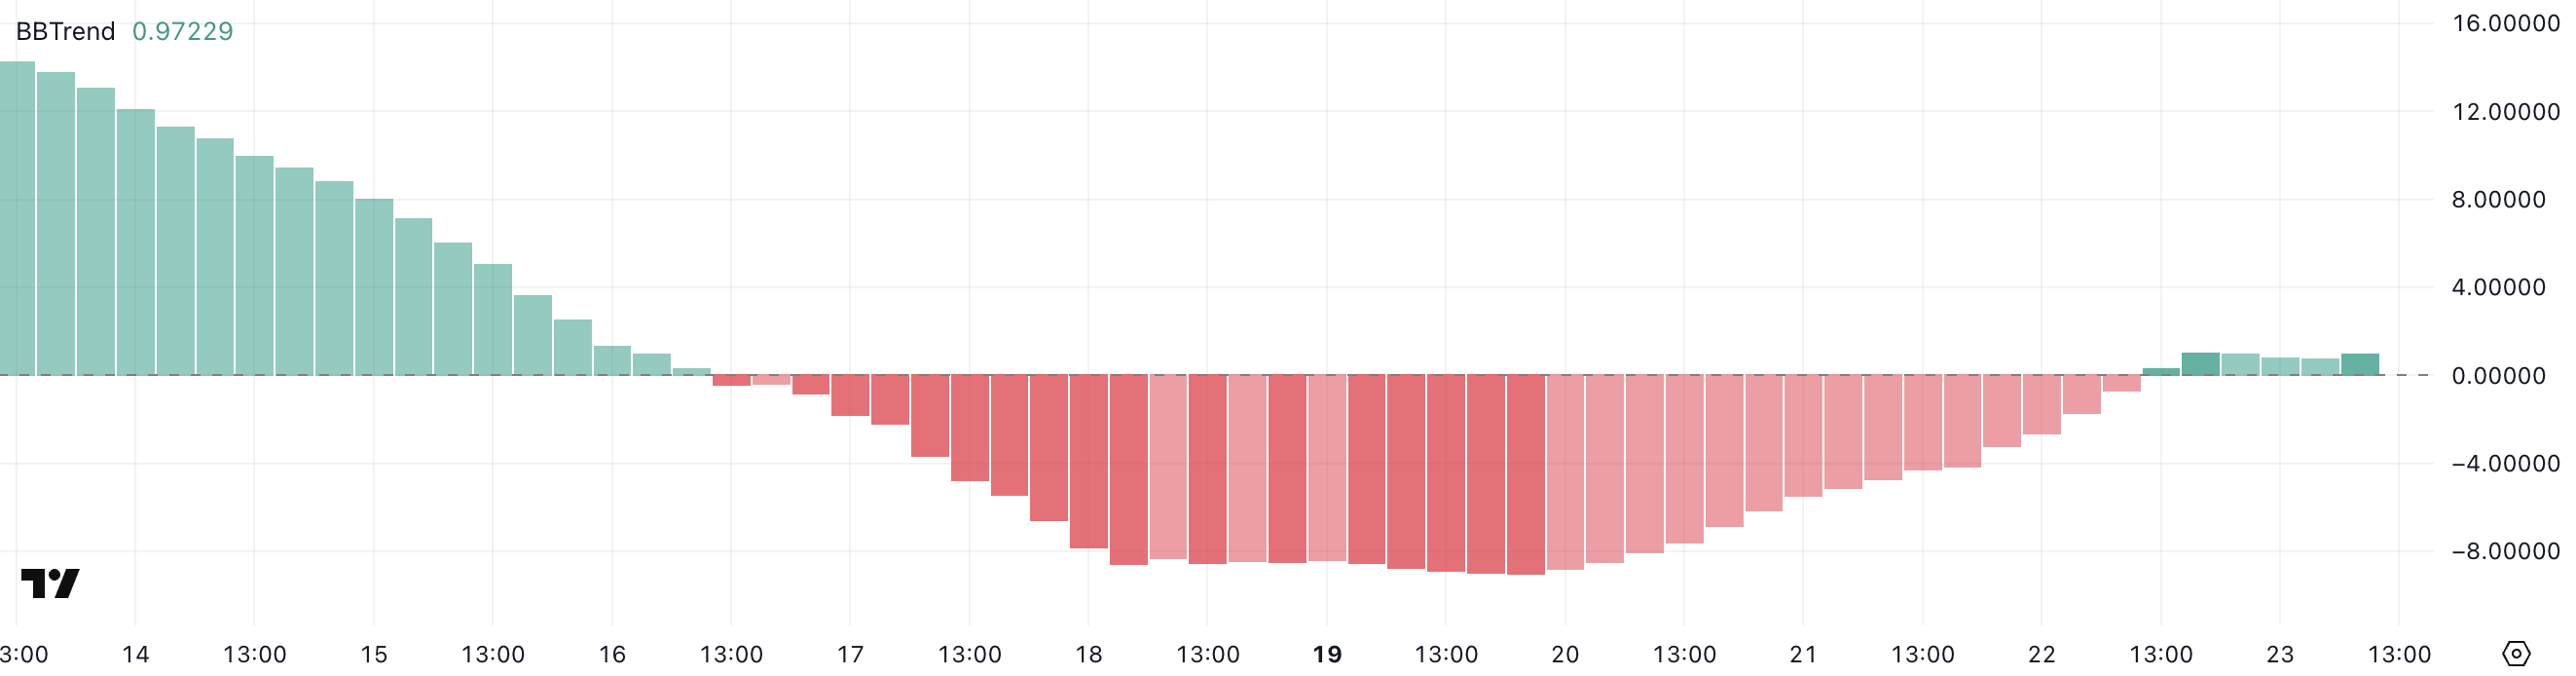
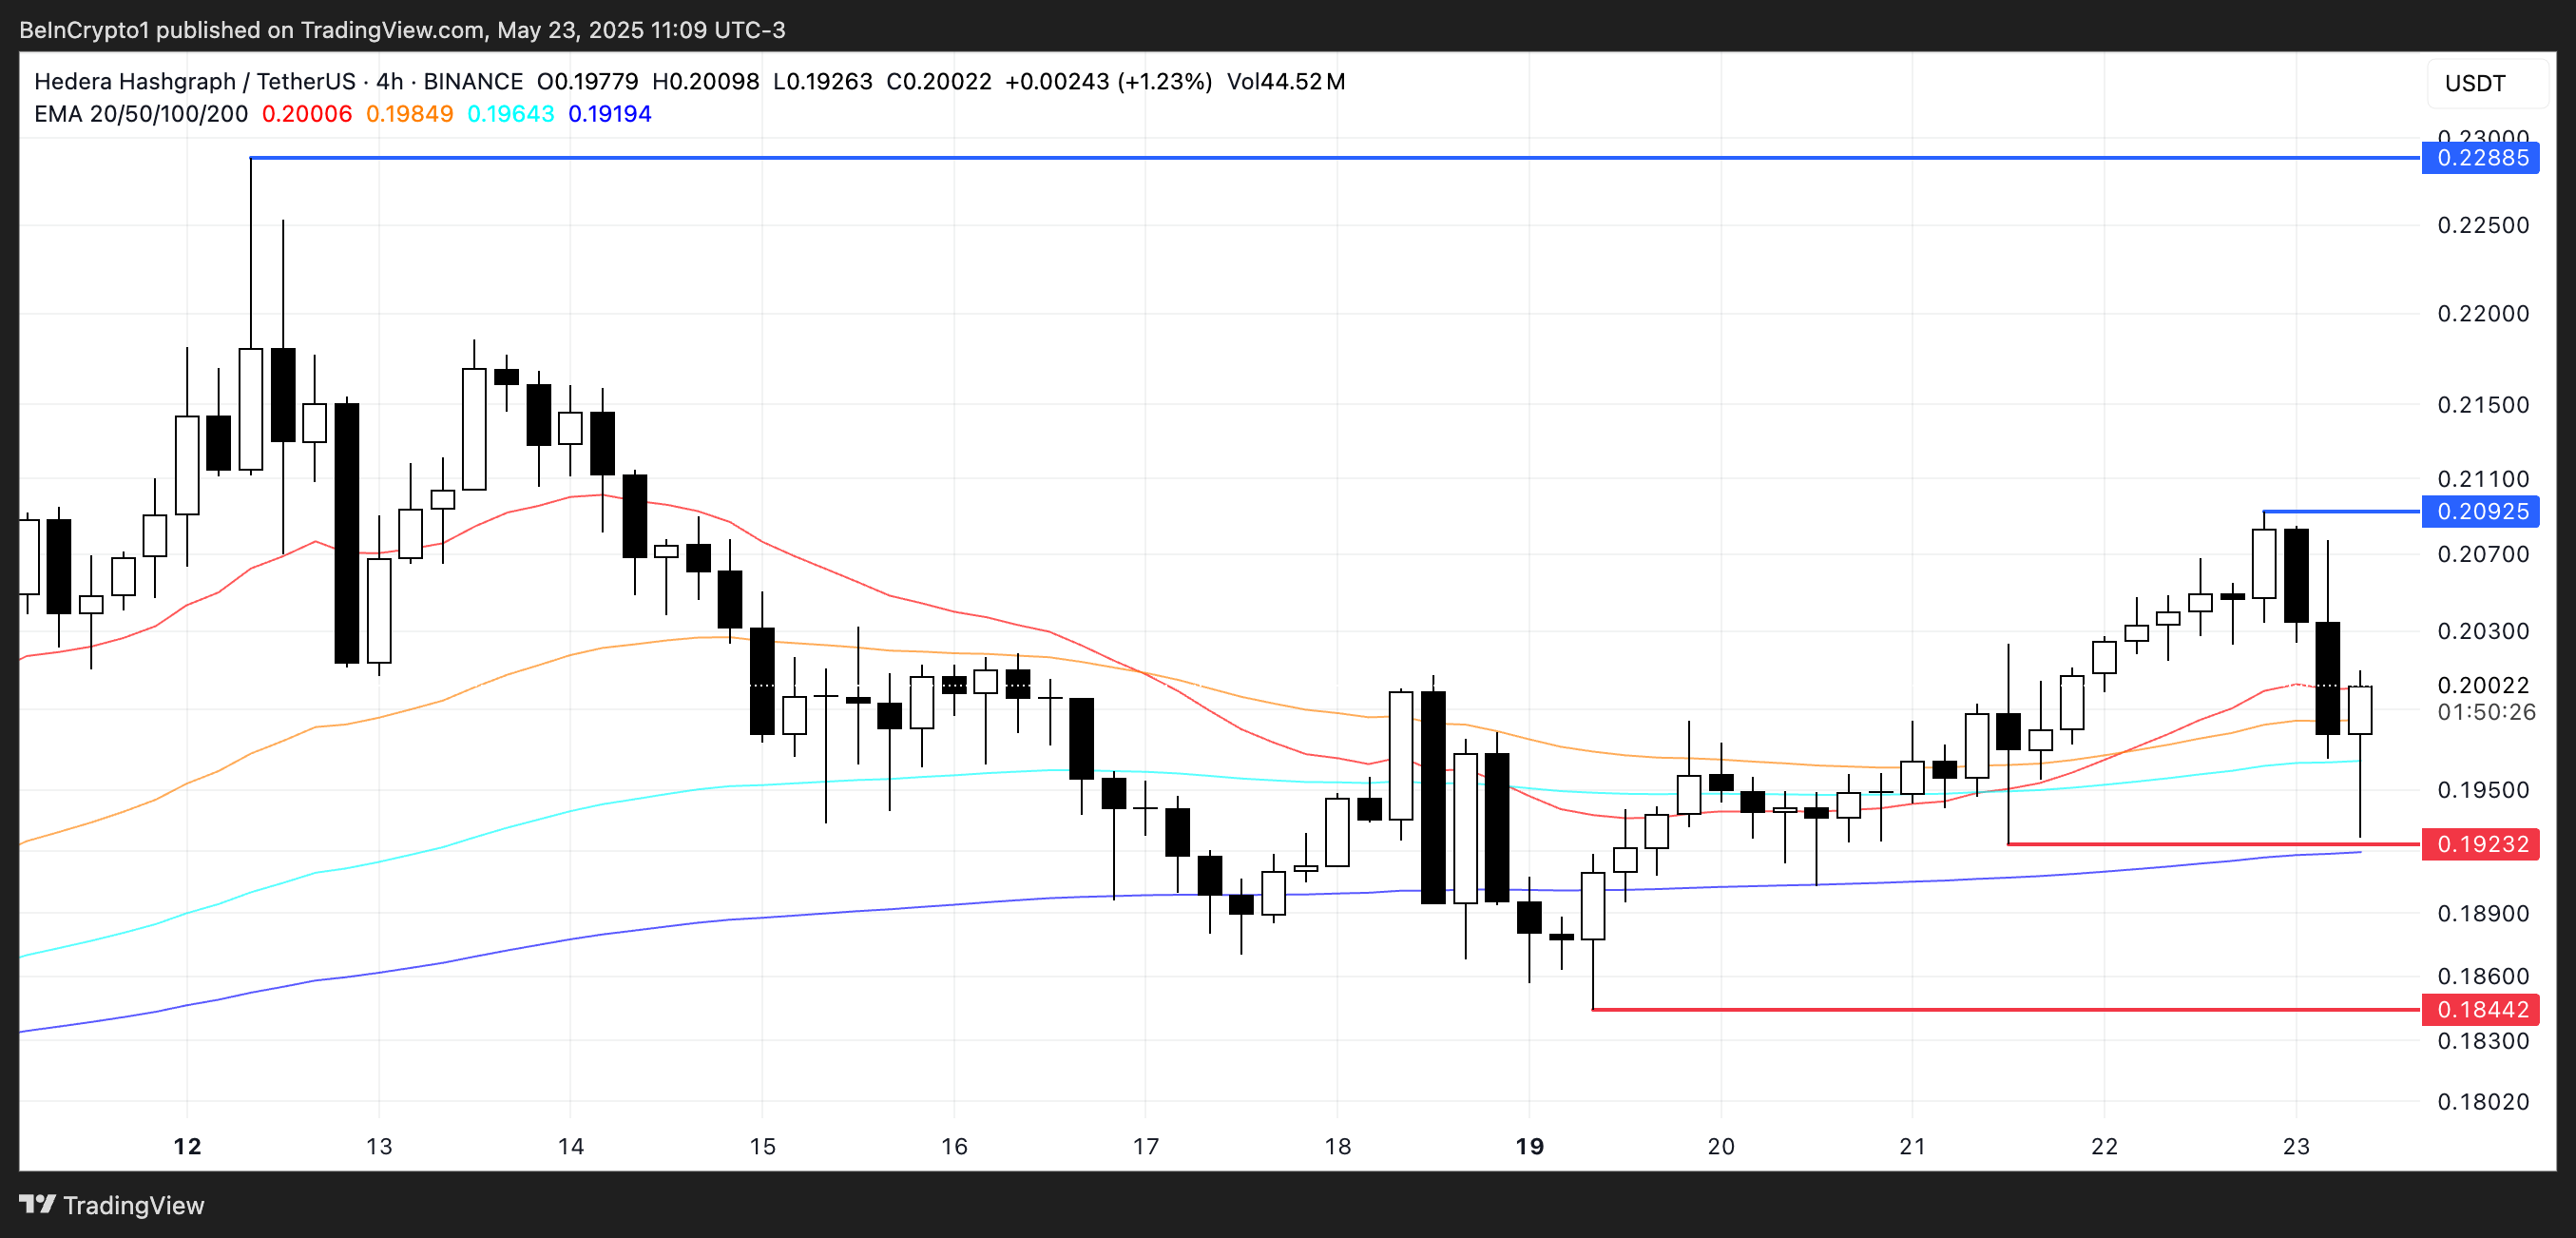
Hedera (HBAR) is trading dangerously close to the key psychological level of $0.20, with technical indicators flashing mixed signals. The BBTrend has turned slightly positive at 0.97 but continues to struggle to break above the bullish confirmation level of 1, signaling weak momentum.
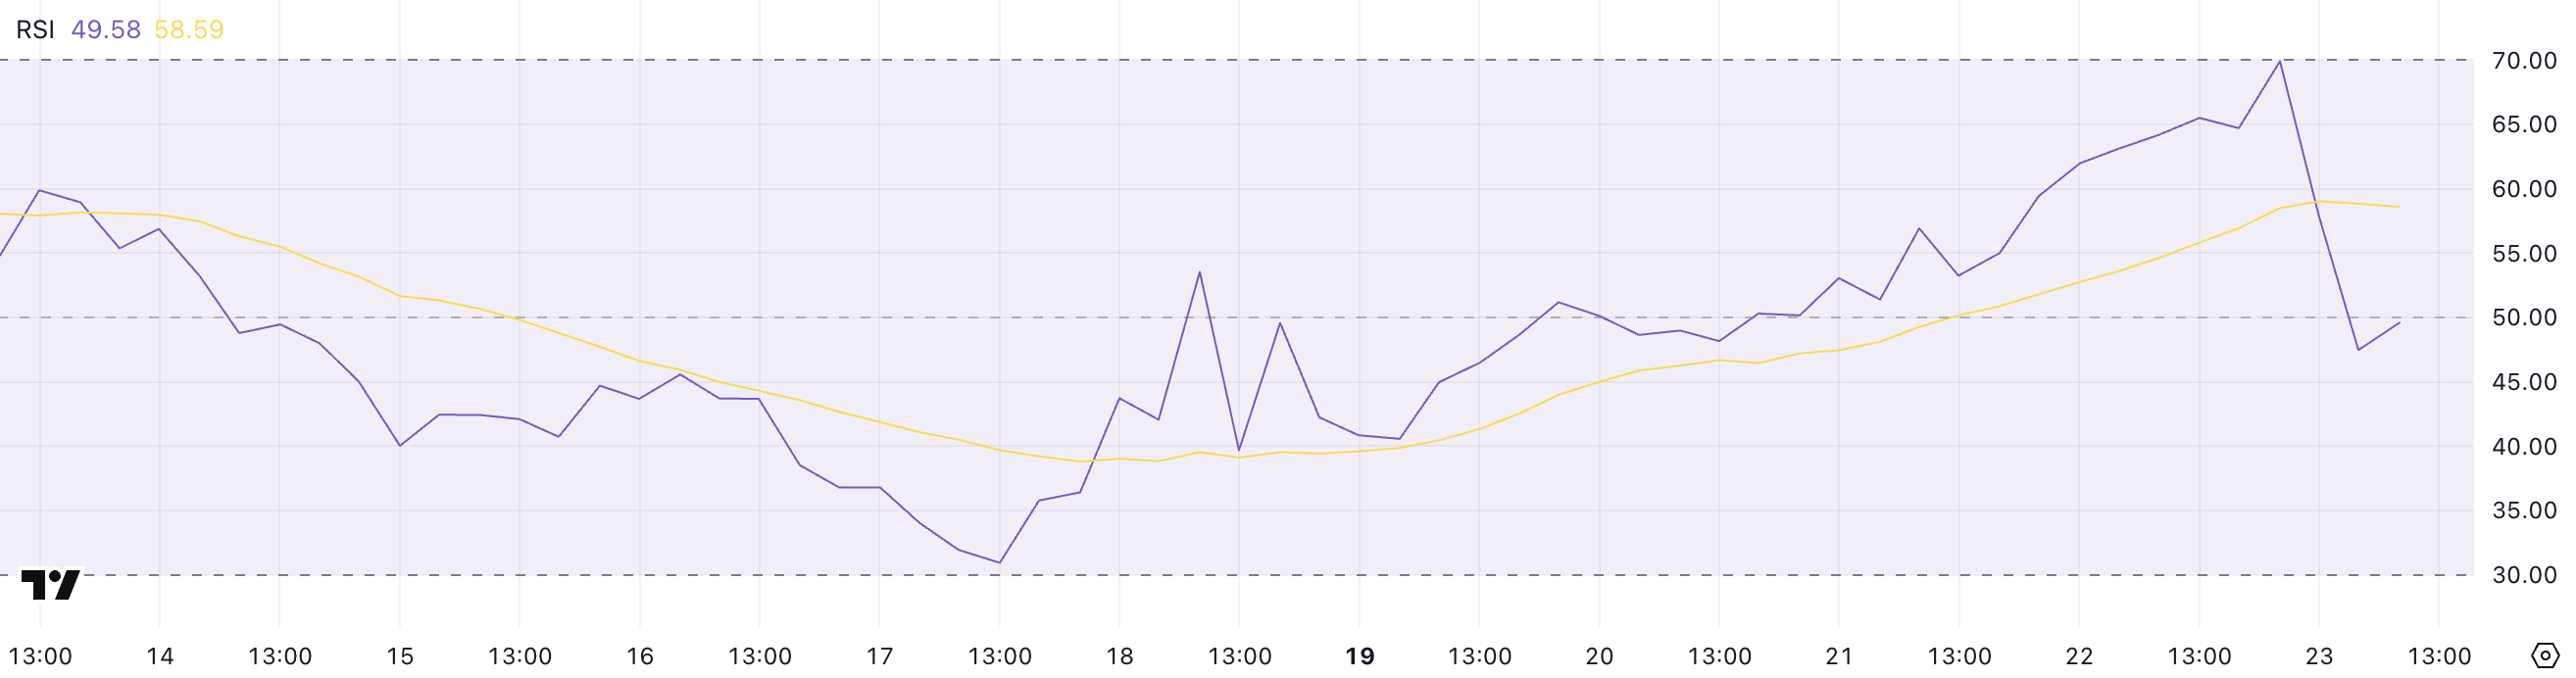
Meanwhile, the RSI has dropped sharply from near-overbought territory to a neutral 49.58, reflecting fading confidence after Bitcoin’s recent decline. With HBAR hovering at a make-or-break level, traders are watching closely to see whether support holds or if a deeper correction happens.
HBAR BBTrend Turns Positive, But Struggles to Confirm Bullish Momentum
The BBTrend (Bollinger Band Trend) indicator measures the strength and direction of price trends based on how far prices deviate from a moving average within the Bollinger Bands.
Positive values suggest upward momentum and buying strength, while negative values indicate downward pressure. The deeper the value, the stronger the trend, making it useful for spotting breakouts or trend reversals.
When BBTrend hovers near zero, it signals indecision or consolidation, and sustained values above 1 are typically seen as confirmation of a bullish move gaining traction.
HBAR’s current BBTrend reading of 0.97 marks a recovery from its recent bearish phase, where it bottomed at -8.99 on May 19 and remained negative through May 22.
While the reading reflects an improving trend, it also highlights hesitation from buyers, indicating that HBAR may remain range-bound unless stronger momentum emerges.
Hedera RSI Drops to Neutral Zone Amid BTC-Driven Sell-Off
Hedera’s Relative Strength Index (RSI) has dropped to 49.58, falling sharply from 69.91 just a day earlier.
This sudden shift reflects a clear loss of buying momentum, as broader market sentiment turned risk-off following Bitcoin’s 3% drop in response to Donald Trump’s threat of imposing a 50% tariff on the European Union.
The RSI’s decline highlights how quickly investor confidence in HBAR faded alongside BTC’s pullback, pulling the token back into neutral territory after nearly touching overbought conditions.
The RSI is a momentum indicator that measures the magnitude of recent price changes to evaluate whether an asset is overbought or oversold.
It ranges from 0 to 100, with levels above 70 typically signaling overbought conditions and potential for a pullback, while values below 30 suggest oversold conditions and potential for a rebound.
With HBAR’s RSI now sitting near the midline, the token lacks a clear trend, indicating indecision among traders. For momentum to return, HBAR would need either renewed bullish sentiment or broader market stabilization—particularly from Bitcoin.
HBAR Nears $0.20 Breakdown — Key Support Levels in Focus
Hedera price is currently at a critical technical juncture, hovering just above the psychological level of $0.20. If bearish momentum persists, the token is at risk of breaking below this level and could slide toward the next support at $0.192.
A breach there would expose further downside to $0.184, potentially accelerating short-term selling pressure.
This scenario reflects broader weakness in the crypto market, particularly after Bitcoin’s recent pullback.
However, if sentiment stabilizes and HBAR reverses course, the first resistance to watch is at $0.209. A successful breakout above this level could open the door to a move toward $0.228, a zone that would likely require strong volume and broader market support to reclaim.
Bit Digital’s (BTBT) stock prices rose after the firm announced that it raised an additional $21.4 million after the underwriters of the public offering fully exercised the option to purchase an extra 11.25 million ordinary shares.
This addition brings the total proceeds from the offering to approximately $162.9 million. The company plans to use the funds to accumulate Ethereum (ETH) as part of its overhauled business strategy.
Ethereum Push Drives Bit Digital’s Stock Price Higher
To further increase its Ethereum position, Bit Digital launched a $150 million public offering on June 26. According to the press release, the firm offered 75 million ordinary shares at $2 per share.
Moreover, as part of this offering, the underwriters were granted a 30-day option to purchase an additional 11.25 million shares. They fully exercised this option, raising an additional $21.4 million in net proceeds. Thus, the company sold a total of 86.25 million shares.
“The net proceeds to the Company from the underwritten public offering, including the full exercise of the underwriters’ option to purchase additional ordinary shares, are approximately $162.9 million, after deducting the underwriting discount and estimated offering expenses payable by us. The Company intends to use the net proceeds from this offering to purchase Ethereum,” the firm noted.
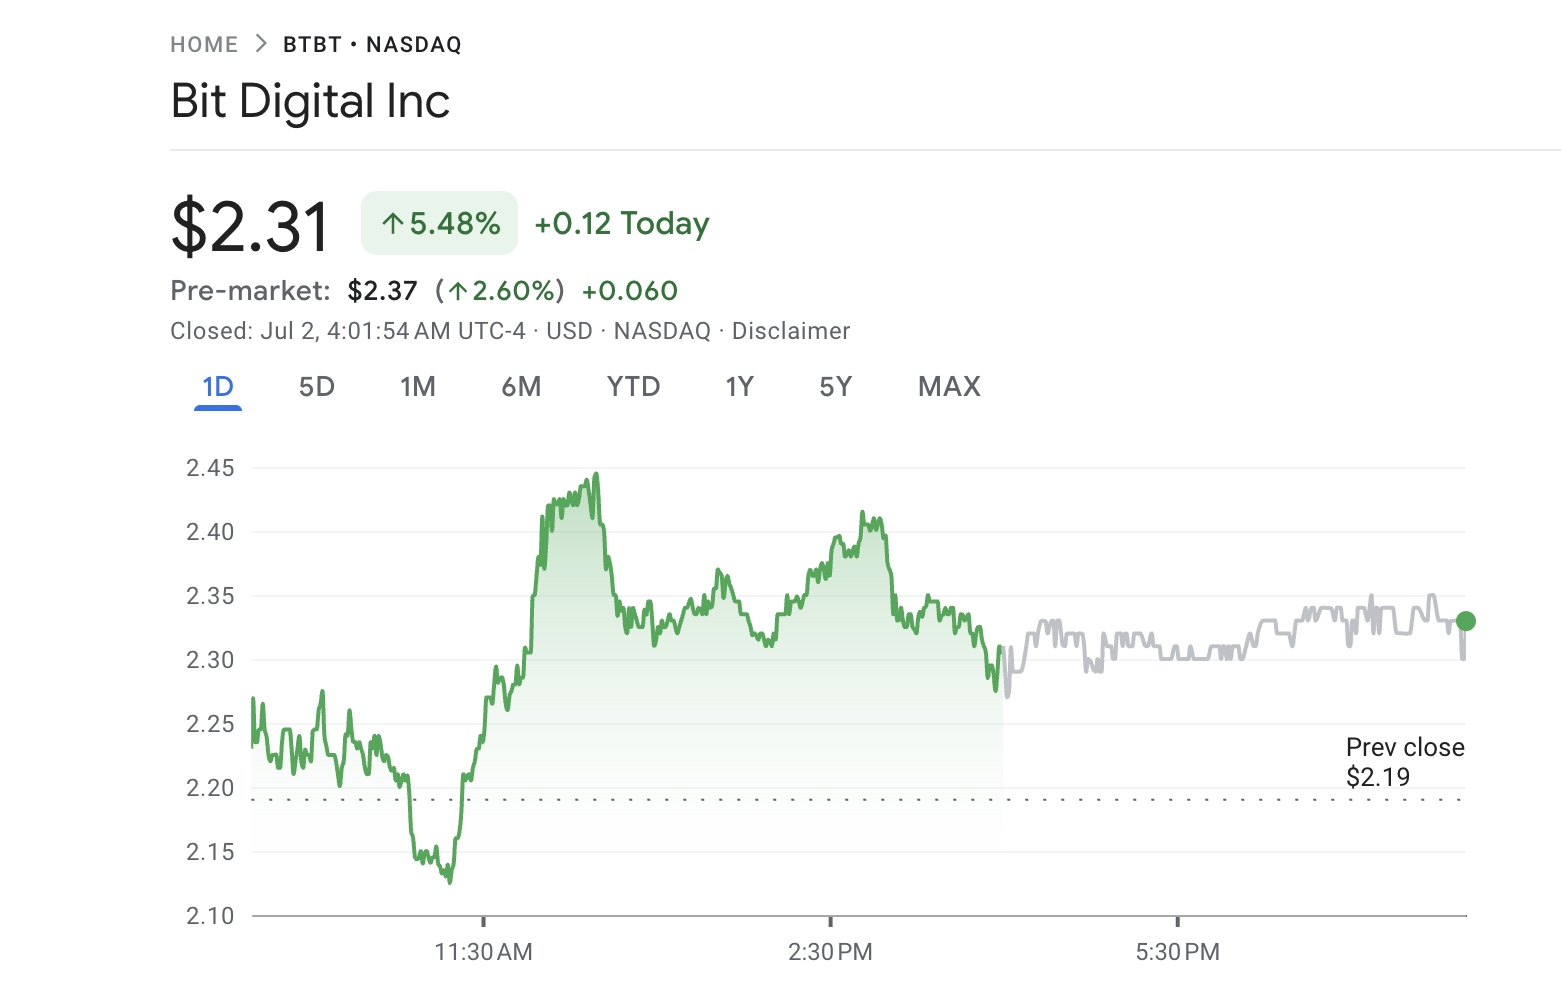
Notably, the announcement gave the stock prices the much-needed upward push. Although the news of the transition and offering were initially met with declines, the successful fundraising triggered a rise in stock value.
Google Finance data showed the BTBT closed at $2.3, marking a 5.48% increase. Moreover, the price rose further by 2.6% in pre-market trading.
Bit Digital (BTBT) Stock Performance. Source: Google Finance
The rise in stock prices mirrors the pattern observed in firms’ stocks that have adopted a Bitcoin-focused strategy. This shows that, alongside BTC, Ethereum is also gaining institutional and investor confidence as an asset class.
In fact, BitMine’s earlier announcement to commit $250 million toward an ETH treasury led to a dramatic 684.8% increase in its stock price, highlighting the strong market sentiment and investor appetite for Ethereum-focused strategies.
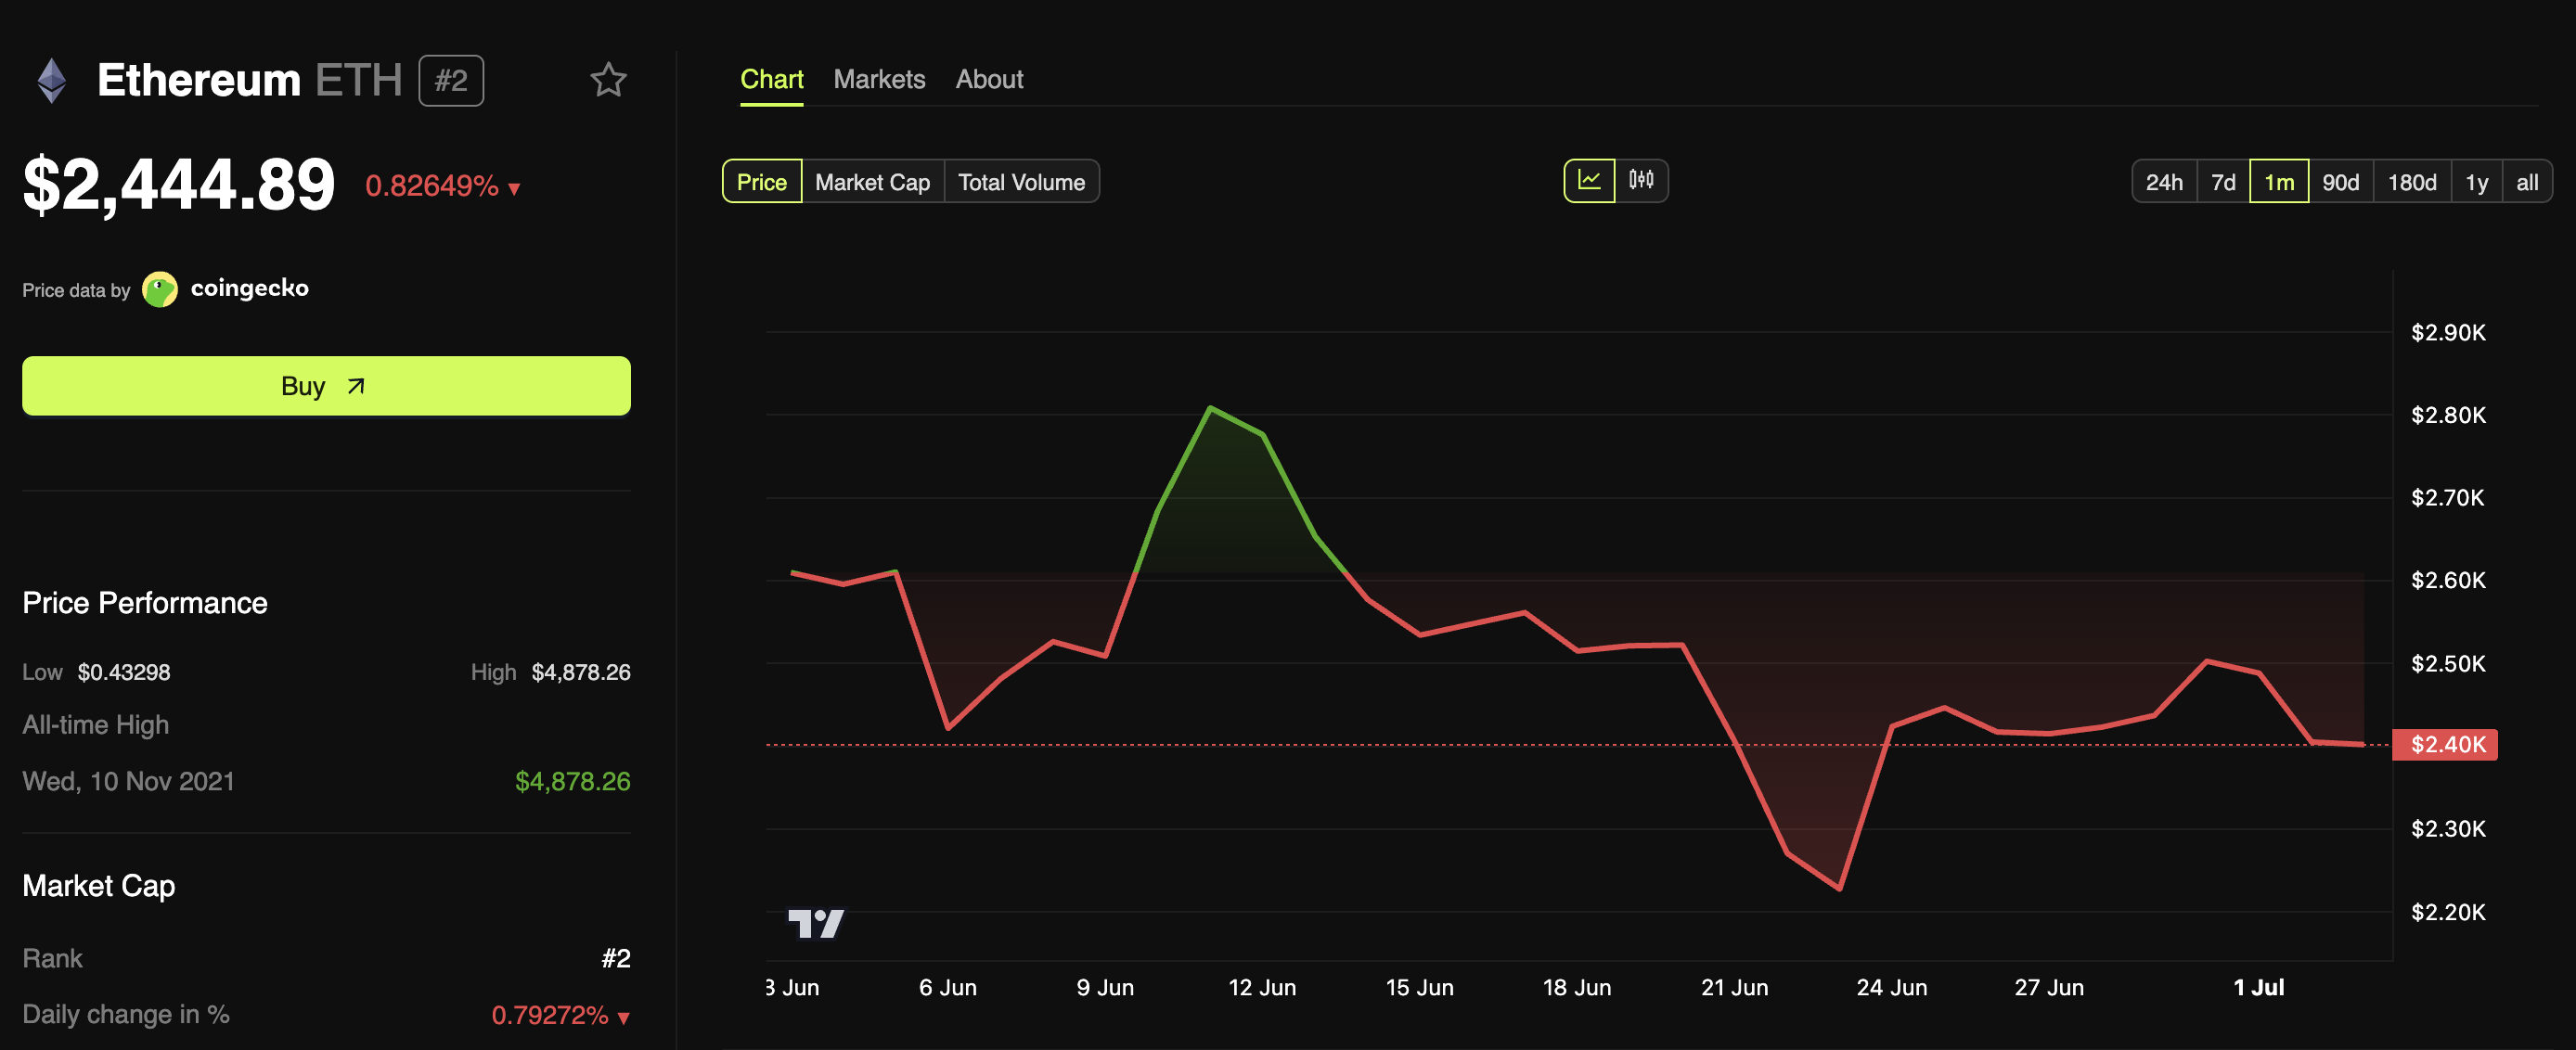
This rise could be attributed to increased optimism in ETH’s price potential. Many anticipate that the growing stablecoin momentum and validator upgrade could drive prices higher. However, broader market conditions have put a slight pressure on ETH’s latest rally.