Hedera (HBAR) has been stuck in a prolonged period of consolidation, leaving traders unsure of its next move. While its stability has prevented significant losses, it has also left market participants waiting for a breakout, with growing impatience in the community. This indecisiveness has caused Hedera traders to closely watch Bitcoin for cues, as the two assets share a growing correlation.
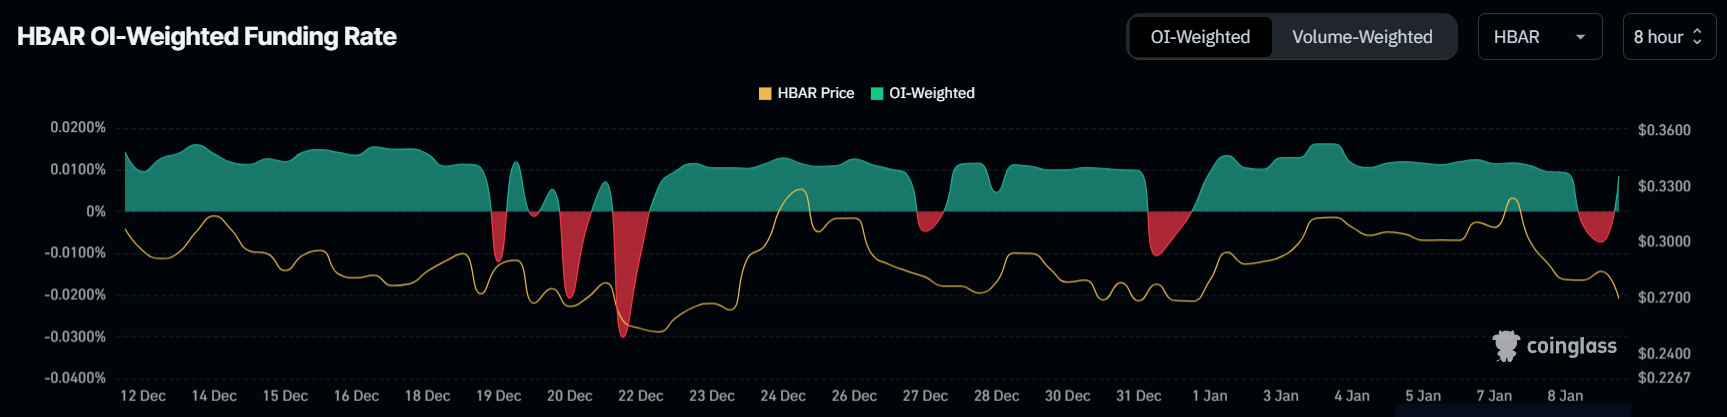
The funding rate for HBAR, which has been fluctuating between positive and negative, mirrors the market’s uncertainty. Traders are positioning themselves to capitalize on either a potential price surge or a further decline, but this tug-of-war of sentiment has resulted in an erratic funding rate. This volatility suggests that participants are unsure whether Hedera is poised for a breakout or if further downside is more likely.
In the midst of this uncertainty, traders’ impatience could lead to abrupt decisions, which could further impact HBAR’s price. With sentiment divided, the altcoin may face additional pressure, continuing its lack of momentum. Currently, HBAR’s macro momentum is closely tied to Bitcoin, which has a correlation of 0.65 with the asset. If Bitcoin manages to reclaim the $100,000 mark and sustains its rally, HBAR could see a similar boost, breaking free from its consolidation phase.
However, Bitcoin’s performance remains pivotal. Should Bitcoin falter, HBAR’s reliance on its correlation with the leading cryptocurrency could put it at risk. As of now, HBAR is trading at $0.27, hovering between the $0.25 and $0.33 range. Without a clear sentiment shift, this sideways movement could persist, leaving traders uncertain about the asset’s trajectory.
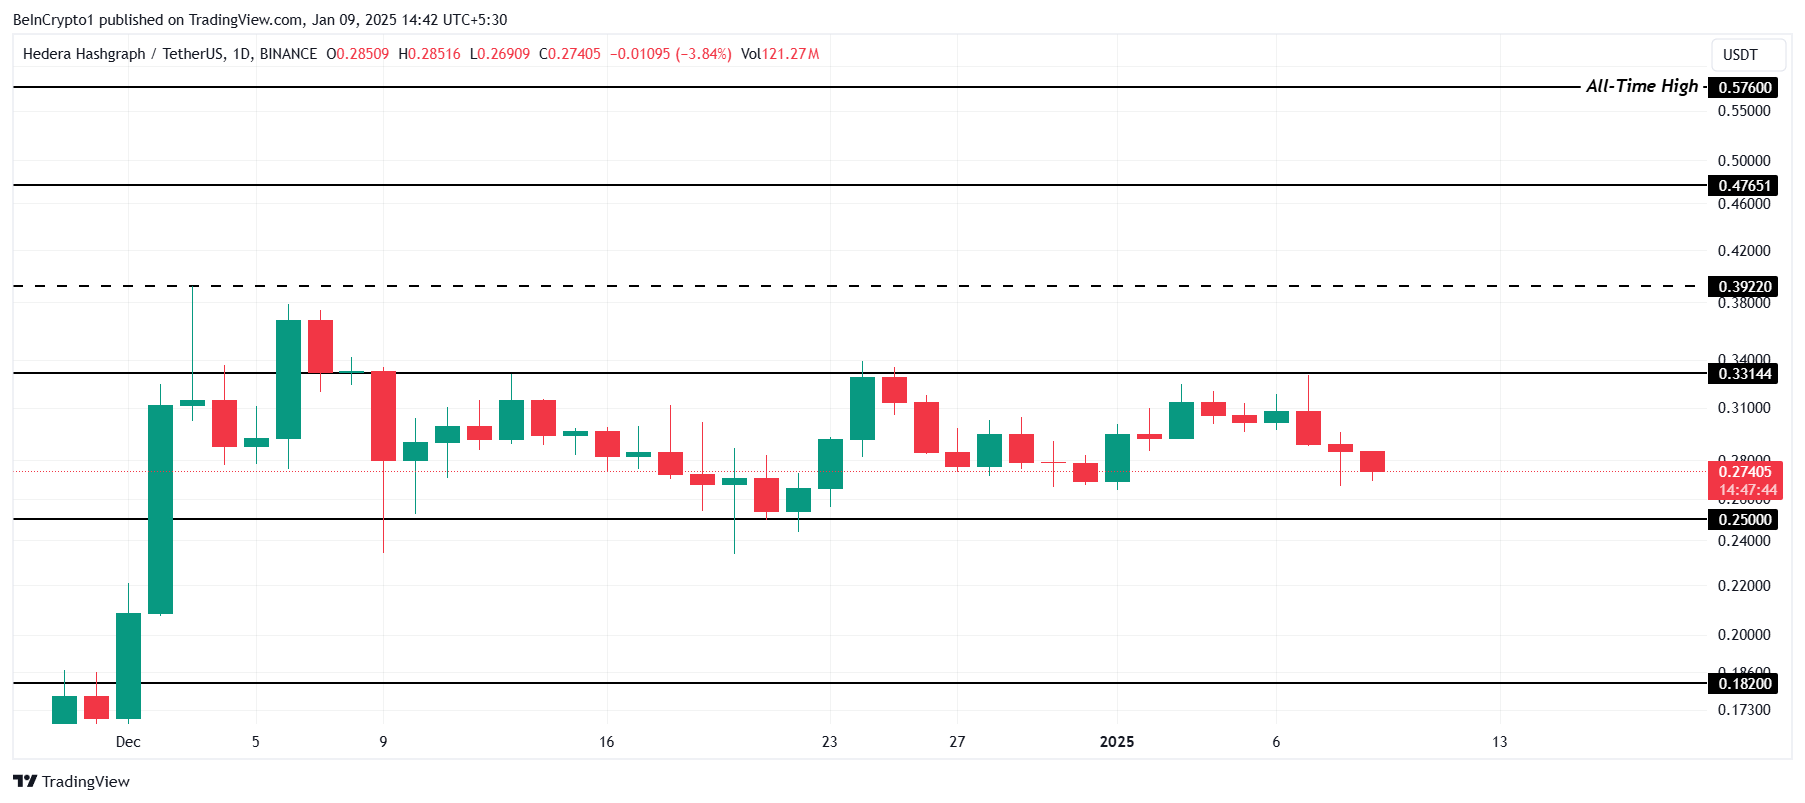
For HBAR to break out of its current consolidation, it will need Bitcoin’s momentum. A move above $0.33, supported by broader market positivity, could propel Hedera toward $0.39, invalidating the bearish outlook. Conversely, if market sentiment continues to sour, HBAR may test critical support levels, potentially pushing it lower. The next few weeks could be crucial for Hedera’s fate, with Bitcoin’s performance likely to set the tone for its next major move.
The metrics used to measure outcomes can be misleading when evaluating blockchain performance. As more blockchain networks emerge, the public needs clear, efficiency-focused metrics, rather than exaggerated claims, to differentiate between them.
In a conversation with BeInCrypto, Taraxa Co-Founder Steven Pu explained that it’s becoming increasingly difficult to compare blockchain performance accurately because many reported metrics rely on overly optimistic assumptions rather than evidence-based results. To combat this wave of misrepresentation, Pu proposes a new metric, which he calls TPS/$.
Why Does the Industry Lack Reliable Benchmarks?
The need for clear differentiation is growing with the increasing number of Layer-1 blockchain networks. As various developers promote the speed and efficiency of their blockchains, relying on metrics that distinguish their performance becomes indispensable.
However, the industry still lacks reliable benchmarks for real-world efficiency, instead relying on sporadic sentimental waves of hype-driven popularity. According to Pu, misleading performance figures currently saturate the market, obscuring true capabilities.
“It’s easy for opportunists to take advantage by driving up over-simplified and exaggerated narratives to profit themselves. Every single conceivable technical concept and metric has at one time or another been used to hype up many projects that don’t really deserve them: TPS, finality latency, modularity, network node count, execution speed, parallelization, bandwidth utilization, EVM-compatibility, EVM-incompatibility, etc.,” Pu told BeInCrypto.
Pu focused on how some projects exploit TPS metrics, using them as marketing tactics to make blockchain performance sound more appealing than it might be under real-world conditions.
Examining the Misleading Nature of TPS
Transactions per second, more commonly known as TPS, is a metric that refers to the average or sustained number of transactions that a blockchain network can process and finalize per second under normal operating conditions.
However, it often misleadingly hypes projects, offering a skewed view of overall performance.
“Decentralized networks are complex systems that need to be considered as a whole, and in the context of their use cases. But the market has this horrible habit of over-simplifying and over-selling one specific metric or aspect of a project, while ignoring the whole. Perhaps a highly centralized, high-TPS network does have its uses in the right scenarios with specific trust models, but the market really has no appetite for such nuanced descriptions,” Pu explained.
Pu indicates that blockchain projects with extreme claims on single metrics like TPS may have compromised decentralization, security, and accuracy.
“Take TPS, for example. This one metric masks numerous other aspects of the network, for example, how was the TPS achieved? What was sacrificed in the process? If I have 1 node, running a WASM JIT VM, call that a network, that gets you a few hundred thousand TPS right off the bat. I then make 1000 copies of that machine and call it sharding, now you start to get into the hundreds of millions of ‘TPS’. Add in unrealistic assumptions such as non-conflict, and you assume you can parallelize all transactions, then you can get “TPS” into the billions. It’s not that TPS is a bad metric, you just can’t look at any metric in isolation because there’s so much hidden information behind the numbers,” he added.
The Taraxa Co-founder revealed the extent of these inflated metrics in a recent report.
The Significant Discrepancy Between Theoretical and Real-World TPS
Pu sought to prove his point by determining the difference between the maximum historical TPS realized on a blockchain’s mainnet and the maximum theoretical TPS.
Of the 22 permissionless and single-shard networks observed, Pu found that, on average, there was a 20-fold gap between theory and reality. In other words, the theoretical metric was 20 times higher than the maximum observed mainnet TPS.
Taraxa Co-founder finds 20x difference between the Theoretical TPS and the Max Observed Mainnet TPS. Source: Taraxa.
“Metric overestimations (such as in the case of TPS) are a response to the highly speculative and narrative-driven crypto market. Everyone wants to position their project and technologies in the best possible light, so they come up with theoretical estimates, or conduct tests with wildly unrealistic assumptions, to arrive at inflated metrics. It’s dishonest advertising. Nothing more, nothing less,” Pu told BeInCrypto.
Looking to counter these exaggerated metrics, Pu developed his own performance measure.
Introducing TPS/$: A More Balanced Metric?
Pu and his team developed the following: TPS realized on mainnet / monthly $ cost of a single validator node, or TPS/$ for short, to fulfill the need for better performance metrics.
This metric assesses performance based on verifiable TPS achieved on a network’s live mainnet while also considering hardware efficiency.
The significant 20-fold gap between theoretical and actual throughput convinced Pu to exclude metrics based solely on assumptions or lab conditions. He also aimed to illustrate how some blockchain projects inflate performance metrics by relying on costly infrastructure.
“Published network performance claims are often inflated by extremely expensive hardware. This is especially true for networks with highly centralized consensus mechanisms, where the throughput bottleneck shifts away from networking latency and into single-machine hardware performance. Requiring extremely expensive hardware for validators not only betrays a centralized consensus algorithm and inefficient engineering, it also prevents the vast majority of the world from potentially participating in consensus by pricing them out,” Pu explained.
Pu’s team located each network’s minimum validator hardware requirements to determine the cost per validator node. They later estimated their monthly cost, paying particular attention to their relative sizing when used to compute the TPS per dollar ratios.
“So the TPS/$ metric tries to correct two of the perhaps most egregious categories of misinformation, by forcing the TPS performance to be on mainnet, and revealing the inherent tradeoffs of extremely expensive hardware,” Pu added.
Pu stressed considering two simple, identifiable characteristics: whether a network is permissionless and single-sharded.
Permissioned vs. Permissionless Networks: Which Fosters Decentralization?
A blockchain’s degree of security can be unveiled by whether it operates under a permissioned or permissionless network.
Permissioned blockchains refer to closed networks where access and participation are restricted to a predefined group of users, requiring permission from a central authority or trusted group to join. In permissionless blockchains, anyone is allowed to participate.
According to Pu, the former model is at odds with the philosophy of decentralization.
“A permissioned network, where network validation membership is controlled by a single entity, or if there is just a single entity (every Layer-2s), is another excellent metric. This tells you whether or not the network is indeed decentralized. A hallmark of decentralization is its ability to bridge trust gaps. Take decentralization away, then the network is nothing more than a cloud service,” Pu told BeInCrypto.
Attention to these metrics will prove vital over time, as networks with centralized authorities tend to be more vulnerable to certain weaknesses.
“In the long term, what we really need is a battery of standardized attack vectors for L1 infrastructure that can help to reveal weaknesses and tradeoffs for any given architectural design. Much of the problems in today’s mainstream L1 are that they make unreasonable sacrifices in security and decentralization. These characteristics are invisible and extremely hard to observe, until a disaster strikes. My hope is that as the industry matures, such a battery of tests will begin to organically emerge into an industry-wide standard,” Pu added.
Meanwhile, understanding whether a network employs state-sharding versus maintaining a single, sharded state reveals how unified its data management is.
State-Sharding vs. Single-State: Understanding Data Unity
In blockchain performance, latency refers to the time delay between submitting a transaction to the network, confirming it, and including it in a block on the blockchain. It measures how long it takes for a transaction to be processed and become a permanent part of the distributed ledger.
Identifying whether a network employs state-sharding or a single-sharded state can reveal much about its latency efficiency.
State-sharded networks divide the blockchain’s data into multiple independent parts called shards. Each shard operates somewhat independently and doesn’t have direct, real-time access to the complete state of the entire network.
By contrast, a non-state-sharded network has a single, shared state across the entire network. All nodes can access and process the same complete data set in this case.
Pu noted that state-sharded networks aim to increase storage and transaction capacity. However, they often face longer finality latencies due to a need to process transactions across multiple independent shards.
He added that many projects adopting a sharding approach inflate throughput by simply replicating their network rather than building a truly integrated and scalable architecture.
“A state-sharded network that doesn’t share state, is simply making unconnected copies of a network. If I take a L1 network and just make 1000 copies of it running independently, it’s clearly dishonest to claim that I can add up all the throughput across the copies together and represent it as a single network. There are architectures that actually synchronize the states as well as shuffle the validators across shards, but more often than not, projects making outlandish claims on throughput are just making independent copies,” Pu said.
Based on his research into the efficiency of blockchain metrics, Pu highlighted the need for fundamental shifts in how projects are evaluated, funded, and ultimately succeed.
What Fundamental Shifts Does Blockchain Evaluation Need?
Pu’s insights present a notable alternative in a Layer-1 blockchain space where misleading performance metrics increasingly compete for attention. Reliable and effective benchmarks are essential to counter these false representations.
“You only know what you can measure, and right now in crypto, the numbers look more like hype-narratives than objective measurements. Having standardized, transparent measurements allows simple comparisons across product options so developers and users understand what it is they’re using, and what tradeoffs they’re making. This is a hallmark of any mature industry, and we still have a long way to go in crypto,” Pu concluded.
Adopting standardized and transparent benchmarks will foster informed decision-making and drive genuine progress beyond merely promotional claims as the industry matures.
Aave and Uniswap protocols recently created new records amid signs of a recovery in the cryptocurrency market.
Record-breaking achievements by Aave and Uniswap amid a recovering crypto market raise the question: Are we witnessing the start of a new DeFi boom, or is this just a short-term surge?
Whale Activity Signals Confidence in Aave
With Ethereum (ETH) surpassing $2,500, a key milestone in a volatile crypto market, whale activity on Aave and milestones from Uniswap paint a picture of the decentralized finance (DeFi) ecosystem.
A wallet linked to WLFI recently deposited 50 WBTC into Aave V3 and borrowed 400 million USDC to purchase 1,590 WETH at an average price of $2,515. This wallet now holds assets worth $15.11 million, including 3,924 WETH ($9.91 million) and 50 WBTC ($5.19 million). It has a healthy position on Aave (Health Rate of 2.0), reflecting confidence in ETH’s upside potential.
On the same day, a whale named nemorino.eth bought 3,088 WETH at an average price of $2,488, securing an unrealized profit of approximately $124,000. This reinforces bullish sentiment around ETH as large investors accumulate near the $2,500 level. However, not all whales are optimistic.
On May 12, 2025, EmberCN reported that a whale borrowed 5,000 ETH from Aave in 50 minutes and shorted it at $2,491, highlighting divergent investment strategies.
Is DeFi Poised for a Boom?
The surge in whale activity on Aave aligns with remarkable DeFi milestones. Aave’s founder, Stani Kulechov, announced on May 11, 2025, that Aave reached a record Total Value Locked (TVL) of $25 billion, making it one of the largest DeFi protocols.
According to DeFiLlama data from May 14, 2025, Aave accounts for over 21% of the DeFi market’s TVL, surpassing competitors like Lido (LDO) and EigenLayer (EIGEN). This growth is largely driven by large investors depositing substantial assets into the protocol.
Meanwhile, Uniswap, a leading decentralized exchange (DEX), achieved a historic milestone. On May 12, 2025, Uniswapreported that its all-time trading volume surpassed $3 trillion, showing DeFi’s appeal.
DefilLama data from May 14, 2025, shows that Uniswap processes over $3.6 billion in transactions in 24 hours, capturing 24% of global DEX trading volume and solidifying its dominance.
These milestones from Aave and Uniswap reflect DeFi’s growth and a shift of capital from traditional finance to decentralized protocols.
Implications of Whale Movements and DeFi Growth
These developments carry significant implications for ETH and the DeFi ecosystem. Active whale participation on Aave signals a strong belief in ETH, particularly as its price exceeds $2,500. This optimism supports the broader DeFi narrative.
Aave’s $25 billion TVL highlights its role in providing liquidity and supporting complex investment strategies. Similarly, Uniswap’s $3 trillion trading volume shows the popularity of DEXs, enabling direct, intermediary-free trading that reduces costs and enhances transparency.
The DeFi boom could propel ETH’s long-term growth. The price surpassing $2,500, coupled with whale activity, indicates DeFi is becoming a cornerstone of Ethereum’s ecosystem.
The rise of Aave and Uniswap, fueled by record TVL and trading volumes, alongside significant whale activity, suggests DeFi is entering a new growth phase. While short-term market fluctuations remain possible, these protocols’ increasing institutional interest and strong fundamentals point to a sustained DeFi boom, with Ethereum at its core. However, investors should monitor market movement and whale strategies, as divergent approaches signal potential volatility.
Layer-1 (L1) coin LTC is today’s top gainer, climbing 10% in the past 24 hours. The double-digit surge comes following a regulatory setback, as the US SEC delayed its decision on Canary Capital’s application for a spot Litecoin ETF.
However, the current LTC token upward momentum may be on shaky ground as technical indicators suggest a potential bearish reversal.
On Tuesday, after the SEC called for public comments on Canary Capital’s application for a spot Litecoin ETF, LTC plunged to a two-week low of $81.03.
However, the resurgence in trading activity across the broader crypto market over the past day has helped LTC rebound from this dip. It now trades at $91.68, with daily trading volume exceeding $850 million.
But, there is a catch. Key technical and on-chain indicators suggest a potential bearish reversal in the short term, as buyer exhaustion appears on the horizon.
For example, despite LTC’s rally, its Chaikin Money Flow (CMF), which measures buying and selling pressure, has declined, forming a bearish divergence. Readings from the daily chart show that this momentum indicator is declining and poised to breach the center line.
A CMF bearish divergence occurs when the price of an asset makes higher highs while the indicator makes lower highs. This suggests that buying pressure is weakening despite rising prices. The trend indicates a potential reversal or loss of upward momentum in the LTC market.
Moreover, on-chain readings show that LTC’s Network Realized Profit/Loss (NPL) is rising, indicating that coin holders are sitting on unrealized gains and may be tempted to sell. At press time, the NPL sits at 1.7 million.
This metric reflects the net profit or loss of all coins moved on-chain, based on the price at which they were last moved. A rising NPL suggests increasing profitability across the network.
This, in combination with LTC’s weakening buy pressure as reflected by its CMF, heightens the risk of short-term selling pressure as traders look to lock in profits.
Can Litecoin Hold Its Gains?
With strengthening bearish pressure, LTC buyers risk facing exhaustion soon. If new demand fails to come into the spot markets to support the LTC token rally, it could lose its current gains and fall to $82.88.
However, a bullish shift in market sentiment could prevent this. If buying activity soars, it could drive LTC’s price to $95.13. A breach of this resistance could catapult the altcoin toward $105.04.