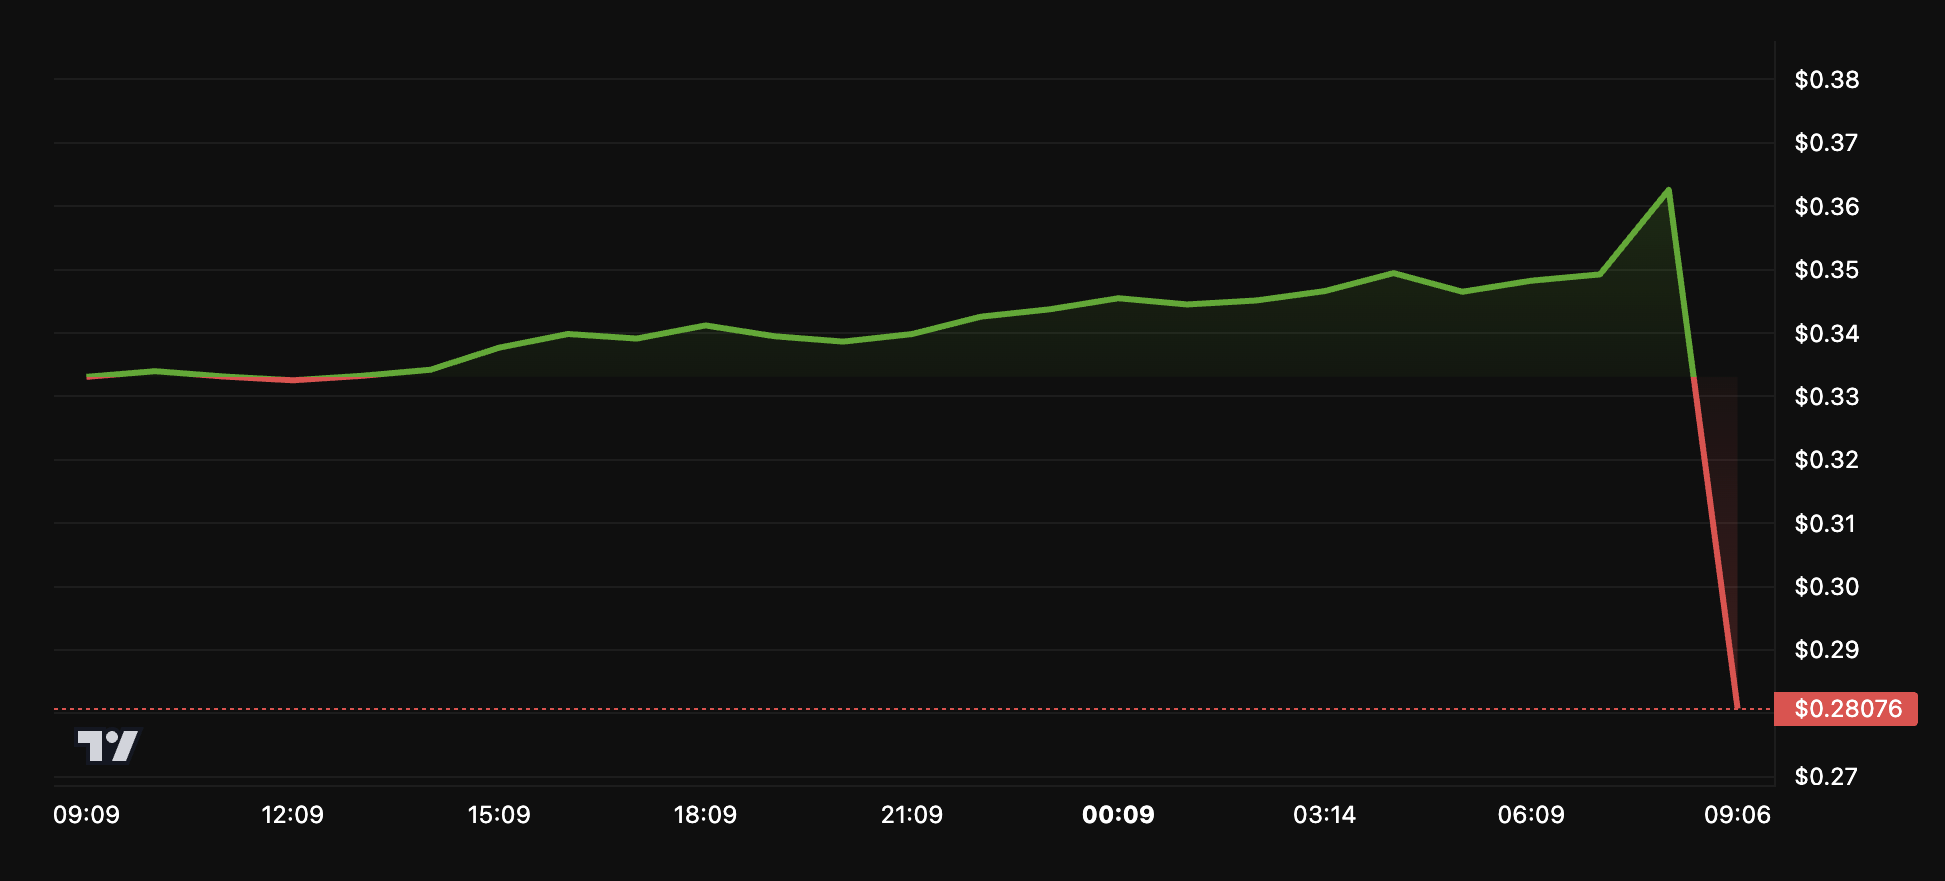
The markets are recovering from the trade-war turmoil, which has dragged the Solana price below $100 for a while. The bears did try to drag the price below the range for two consecutive days but failed, with the price reclaiming $120 in no time. Since then, the price has been consolidating around the gains, aiming to reclaim the crucial resistance at $125, which could clear the path to $135. With this, the SOL price could probably rise above the bearish influence, but if the selling pressure mounts, the token may face a significant setback.
Solana was one of the most exposed tokens after FTT following the collapse of the FTX exchange back in 2022. The SOL price faced a massive pullback and dropped to a single-digit figure from the highs above $240 following a huge uncertainty over the token. However, the token rebounded finely and surged close to $300, forming a new ATH. In a new update ahead of FTX’s repayment program scheduled for May, the exchange has unstaked large amounts of SOL, raising concerns over the upcoming price action.
The FTX exchange has just unstaked over 186,000 SOL worth nearly $22 million, which may push the price into a decisive phase. Although unstaking does not directly mean dumping, as the creditors may certainly not sell out their holding as soon as they get it, some probability of a pullback remains higher. Currently, no major price change is seen as the market sentiment remains bullish after the Bitcoin price climbed back above $81,000.
Should you be worried about the SOL price rally?
The SOL price in the short term is trading within an ascending triangle and is testing the upper resistance zone between $119.54 and $120.84. The RSI is rising while the Stochastic RSI has entered the overbought zone. Therefore, this carries some possibility of a pullback but as long as RSI maintains a strong ascending trend, the Solana price is believed to maintain a strong upswing and test the higher targets mentioned above.
In a convoluted and dramatic scandal, HyperLiquid was rocked today by a massive JELLY short squeeze. It was forced to assume one trader’s liabilities, leaving it on the hook for $230 million.
As this situation developed, major CEXs like Binance and OKX listed JELLY perpetuals in what looks like a direct attack. HyperLiquid delisted the token, sparking extreme controversy.
Essentially, massive JELLY whales managed to manipulate the meme coin price, causing losses in HyperLiquid’s HLP vault.
“A massive whale with 124.6 million JELLYJELLY ($4.85 million) is manipulating its price to make Hyperliquidity Provider (HLP) face a loss of $12 million. He first dumped the token, crashing the price and leaving HLP with a passive short position of $15.3 million. Then he bought it back, driving the price up—causing HLP to suffer a loss of nearly $12 million,” LookonChain claimed via social media.
So, essentially, JELLY JELLY initially surged nearly 500% today. This dramatic jump was sparked by what’s called a “short squeeze.” It occurs when someone bets heavily that a coin’s price will fall (known as “shorting”), but instead, the price unexpectedly rises.
In this case, a trader borrowed a massive amount of JELLY tokens and sold them immediately. He expected the price to drop, buy the tokens back cheaper, and keep the difference as profit.
Unfortunately for the trader, the price didn’t fall—it skyrocketed, forcing them to buy back the coins at much higher prices, creating massive losses.
This sudden forced buying pushed the price even higher, catching the attention of traders and investors who jumped in to ride the wave. In under an hour, JELLY’s market cap rapidly increased from $10 million to $43 million.
This frenzy also left Hyperliquid, the exchange involved, holding a big loss of $6.5 million from the trader’s failed short position, sparking speculation about potential financial stress on the platform.
Meanwhile, Binance and OKX listed JELLY perpetuals, further driving its price up. So the potential loss became even larger for Hyperliquid. Some users even urged Binance and other competitors to list the token and deal a ‘death blow’ to Hyperliquid.
Binance Users Urging Officials to List JELLY JELLY and Trigger Losses for Hyperliquid. Source: X (formerly Twitter)
Binance is Apparently Trying to Liquidate HyperLiquid
In a very interesting twist, it looks like these competitors are heeding the call. Binance, the world’s largest crypto exchange, was hit with a wave of requests to list JELLY JELLY, thereby causing big losses for HyperLiquid.
Yi He, one of its co-founders, said she would consider a listing, and crypto sleuth ZachXBT claimed that the original whale was funded via Binance.
Shortly after these developments happened, Binance announced that it would begin offering perpetuals contracts for JELLY.
OKX also jumped on the bandwagon with perpetuals trading of its own. After this, HyperLiquid announced that it would delist JELLY JELLY, seemingly erasing its unrealized losses.
“After evidence of suspicious market activity, the validator set convened and voted to delist JELLY perps. All users apart from flagged addresses will be made whole from the Hyper Foundation. This will be done automatically in the coming days based on onchain data. There is no need to open a ticket. Methodology will be shared in detail in a later announcement,” HyperLiquid’s statement claimed.
This radical action immediately caused an explosion on social media. HyperLiquid’s supporters expressed unease over the JELLY JELLY incident, while its detractors accused the firm of criminal activity.
The firm’s validators confirmed that they unanimously took the decision, partially rebutting rumors that its CEO acted alone.
Still, there are no mincing words here. If HyperLiquid can simply declare its JELLY JELLY liabilities null and void, that’s a highly destabilizing act.
The way it handled the $JELLY incident was immature, unethical, and unprofessional, triggering user losses and casting serious doubts over its integrity. Despite presenting itself as an innovative decentralized exchange with a…
Ripple rival Stellar Lumen (XLM) is poised for massive upside momentum as it has formed a bullish price action pattern on the daily timeframe and is now garnering significant attention from traders and investors. On March 19, 2025, as sentiment across the crypto landscape shifts, XLM breached the resistance of the 200 Exponential Moving Average (EMA) on the daily timeframe.
Why is XLM Price RIsing?
This breakout of the resistance level and the shift in sentiment began after the United States Securities and Exchange Commission (SEC) dropped its lawsuit against Ripple Labs.
XLM is currently trading near $0.29 and has surged over 11% in the past 24 hours. This price jump suggests that it is mirroring its rival’s upside momentum. Meanwhile, its trading volume has increased by 135% during the same period, indicating heightened participation from traders and investors following the end of the legal battle.
XLM Price Analysis and Upcoming Levels
Since November 2024, XLM has been on a downward trajectory, forming a falling wedge price action pattern on the daily timeframe. However, with the recent price jump, the asset is approaching the breakout area.
Based on its recent price action and historical patterns, if XLM closes a daily candle above the $0.29 level, there is a strong possibility it could initially soar by 30% to reach $0.37 in the coming days. Furthermore, if XLM sustains this rally and closes a daily candle above $0.35, it could witness another 40% surge, reaching $0.488.
Source: Trading View
XLM’s Over-Leveraged Levels
With this positive development and bullish price action, traders have begun betting on the long side, as reported by the on-chain analytics firm Coinglass.
Data reveals that traders are currently over-leveraged at $0.2725 on the lower side, with bulls having built $5 million worth of long positions, while $0.3025 is another over-leveraged level where bears hold $2.20 million worth of short positions.
When combining this on-chain metric with technical analysis, it appears that bulls are back and will support the asset in reclaiming its all-time high in the coming days.
The post Stellar Lumen (XLM) Price Prediction for March 19 appeared first on Coinpedia Fintech News
Ripple rival Stellar Lumen (XLM) is poised for massive upside momentum as it has formed a bullish price action pattern on the daily timeframe and is now garnering significant attention from traders and investors. On March 19, 2025, as sentiment across the crypto landscape shifts, XLM breached the resistance of the 200 Exponential Moving Average …
Welcome to the US Morning Crypto News Briefing—your essential rundown of the most important developments in crypto for the day ahead.
Grab a coffee to see what experts have to say about Bitcoin’s (BTC) price outlook. Key investment strategies are driving the next directional bias for the pioneer crypto.
Is a $90,000 Breakout Imminent for Bitcoin?
Crypto markets continue to reel from Trump-infused volatility, which weighs heavily on investor sentiment. Traders and investors are bracing for macroeconomic headwinds that continue to temper modest gains.
However, despite the concerns, analysts are still optimistic, citing key investment or trading strategies. BeInCrypto contacted Blockhead Research Network (BRN) analyst Valentin Fournier, who alluded to the Wyckoff price cycle.
“Our base case remains an accumulation phase, with occasional dips likely before Bitcoin can make a clean break above the $89,000–$90,000 resistance,” Fournier told BeInCrypto.
The Wyckoff Price Cycle, developed by Richard Wyckoff, is a technical analysis framework to identify market trends and trading opportunities. It consists of four phases:
Accumulation: Where smart money buys at low prices, often marked by a “spring” (a false breakdown).
Markup: A bullish phase with rising prices.
Distribution: Where smart money sells at highs, also featuring a “spring” (false breakout).
Markdown: A bearish phase with declining prices.
Fournier added that because Bitcoin dominance continues to rise, this suggests altcoins could continue underperforming in the short term.
He also noted that, in contrast to Bitcoin’s strength, trade tensions have affected traditional markets more.
“This is highlighted by Nvidia’s decline following new export restrictions on chips to China,” he said.
What Does Options Data Say?
If the accumulation phase thesis is true, it aligns with a recent analysis by Deribit’s Tony Stewart, highlighting trader sentiment favoring the upside.
The bullish cohort is buying $90,000 to $100,000 Calls, suggesting bets on a price rise for Bitcoin. However, others are bearish, buying $80,000 Puts and selling $100,000+ Calls, indicating they expect a decline or hedging.
Likewise, funding strategies reveal bullish traders are rolling up positions from $84,000 to $90,000 Calls and selling lower Puts ($75,000) to finance their bets. This indicates confidence in a near-term rally.
Traders analyze these repeating phases’ price action, volume, and market structure. Based on that, they can spot reversals and time entries or exits while understanding institutional behavior.