The Euro (EUR) is inching higher against the US Dollar (USD) on Monday, December 9th, demonstrating a tentative recovery after finding support at a key technical level. This upward move highlights the importance of the 20-day Simple Moving Average (SMA) for the EUR/USD pair, suggesting a cautiously optimistic short-term outlook.
Technical Indicators Hint at Building Momentum
While the EUR/USD remains below the psychologically significant 1.0600 level, technical indicators are flashing signs of potential improvement. The Relative Strength Index (RSI) is currently trending upwards, indicating a recovery in momentum. However, the RSI remains below the neutral 50 mark, suggesting a cautious approach as the recovery is still in its early stages.
The Moving Average Convergence Divergence (MACD) indicator adds further weight to the potential for a bullish resurgence. The MACD is printing rising green bars, signifying building bullish momentum. However, a decisive breakout above resistance is still needed to confirm a clear uptrend.
Key Levels to Watch: Bulls Aim for 1.0600, Bears Eye Support
For the EUR/USD to extend its gains, traders will be closely watching the 1.0600 resistance level. A successful break above this level would open up further upside potential for the Euro. Conversely, a break below the crucial support level at the 20-day SMA, currently hovering around 1.0550, could trigger renewed selling pressure. If this support level fails to hold, the EUR/USD could revisit the 1.0530 level and potentially even test the psychological barrier of 1.0500.
Despite the tentative recovery, overall market sentiment surrounding the EUR/USD pair remains cautious. The ongoing geopolitical tensions and economic uncertainties continue to weigh on the Euro. Investors will be monitoring upcoming economic data releases and central bank decisions from both the Eurozone and the United States for further direction.
Earlier today, Israel launched a ‘pre-emptive strike’ on Tehran and declared a state of emergency. This rapid escalation of the conflict drove the crypto market into a freefall.
Over the past 24 hours, total liquidations amounted to $1.15 billion. Additionally, the overall market is down by 6.6%.
Crypto Market Plunges Amid Israel-Iran Conflict
According to CNN, Israel’s strikes targeted Iran’s nuclear program and missile capabilities, affecting dozens of locations. The attack reportedly eliminated Iran’s top military leaders and senior nuclear scientists. It was confirmed that General Hossein Salami, the Commander-in-Chief of Iran’s Islamic Revolutionary Guard Corps (IRGC), was killed.
“Iran’s state television says Deputy Commander in Chief of all Armed Forces, General Gholam Ali Rashid, has been killed, along with nuclear scientist Fereydoon Abbasi,” The Kobeissi Letter posted.
To prepare for potential retaliation, Israel has declared a state of emergency, closing schools, banning gatherings, and mobilizing tens of thousands of soldiers.
Furthermore, Iran is preparing a ‘lethal‘ response against Israel following the attacks. It has already appointed General Vahidi, the former head of the Quds Force, as the new commander of the IRGC.
Admiral Habibollah Sayyari has succeeded the late General Bagheri as the acting Commander-in-Chief of the Armed Forces of the Islamic Republic of Iran.
Statement No. 1 of the General Staff of the Armed Forces
In the early hours of Friday, 23 Khordad (June 12), the Zionist regime carried out an aggressive and reckless attack on several areas of the country, including both civilian and military zones. This assault resulted in… pic.twitter.com/TyQtkxPMmU
The rising tension between the two nations has caused significant turbulence in the market. Dow Jones Industrial Average futures fell by 1.3%, S&P 500 futures dropped 1.4%, and Nasdaq 100 futures plunged by 1.6%.
Nine of the top ten coins saw losses over the past day. Bitcoin (BTC) nosedived from over $108,000 to $104,112. However, altcoins suffered the harshest blow.
Crypto Market Cap Post Israel’s Attack On Iran. Source: BeInCrypto
Solana (SOL) lost nearly 10% over the past day. Ethereum (ETH) trailed closely with a 9.3% downtick. Among the top 100 coins, Fartcoin (FARTCOIN) and Ethena (ENA) stood out for double-digit losses of 17.3% and 15.9%, respectively.
These declines forced 247,769 traders out of their positions over the past 24 hours. According to Coinglass data, $1.15 billion has been liquidated from the crypto market.
Bitcoin faced $427.75 million in long and $19.10 million in short liquidations. Ethereum followed with $244.74 million in long liquidations and $43.57 million in short liquidations, highlighting the scale of market turmoil.
Nonetheless, the conflict drove oil and gold up. Oil prices spiked by more than 10%. U.S. West Texas Intermediate rose to $74.99 per barrel, marking a 10.21% uptick.
The global benchmark Brent increased by 10.28% to $76.48 per barrel. Gold also gained 1.2% to reach $3,426.
Analysts Divided Over Israel-Iran Conflict’s Impact on Crypto
As Iran prepares for retaliatory actions, it’s clear that the impact will be felt across markets. Amid this volatility, the cryptocurrency market, particularly Bitcoin, has become a focal point of debate among analysts.
“Bitcoin’s failure to rise against gold—despite over 3.5 years of hype, including a dozen ETFs, Super Bowl ads, El Salvador, NFTs, tens of billions of leveraged buying by MSTR, other Bitcoin treasury companies, the election of a Bitcoin president, and the establishment of a Bitcoin Strategic Reserve—is strong evidence that the bubble has peaked,” Schiff said.
Another analyst echoed his view, claiming that Bitcoin is not a safe haven but more akin to a tech stock.
“It is important to understand that Bitcoin shows its true colors as Israel attacks Iran. It is not an alternative-currency, it is not a safe haven, it is a risk asset, just like another tech stock, that will decline when the market goes to a risk-off posture,” the post read.
However, crypto advocate Anthony Pompliano maintained an optimistic outlook. Drawing parallels to an earlier incident when Iran launched 300 missiles at Israel, Pompliano noted that Bitcoin rebounded to outperform both oil and gold.
“Bitcoin ended up outperforming the other two over the first 48 hours in that situation. Will be interesting to see what happens here,” Pompliano stated.
Moreover, a recent BlackRock report revealed that while Bitcoin may underperform in the short term during geopolitical shocks, it has historically rallied double digits within 60 days post-crisis, outpacing gold and equities.
Despite immediate market jitters, this suggests a longer-term bullish outlook for the cryptocurrency. Still, the divide reflects broader uncertainties about Bitcoin’s maturity as an asset, with gold’s millennia-long stability pitted against Bitcoin’s 16-year track record. As markets stabilize, analysts will closely monitor price movements, with some betting on Bitcoin’s recovery and others clinging to gold’s proven reliability.
HBAR has seen a notable uptick in recent days, showing signs of recovery after the significant losses recorded in March. If this momentum continues, the cryptocurrency could soon make a comeback, potentially pushing its price higher.
HBAR’s positive movement in April provides hope that it may avoid repeating past patterns of sharp declines, offering a chance for sustained growth in the coming weeks.
Hedera Is Observing A Strong Bullish Momentum
The Relative Strength Index (RSI) for HBAR is currently above the neutral mark at 50.0, which indicates positive market sentiment. This is generally seen as a bullish signal. However, historical instances show that HBAR has experienced corrections following sharp rises in the RSI, driven by volatile price movements.
This time, however, the market’s volatility appears to be much lower, suggesting that the current bullish momentum for HBAR is more organic. If the RSI remains steady in the positive zone, it could signal a more sustainable rally for the cryptocurrency.
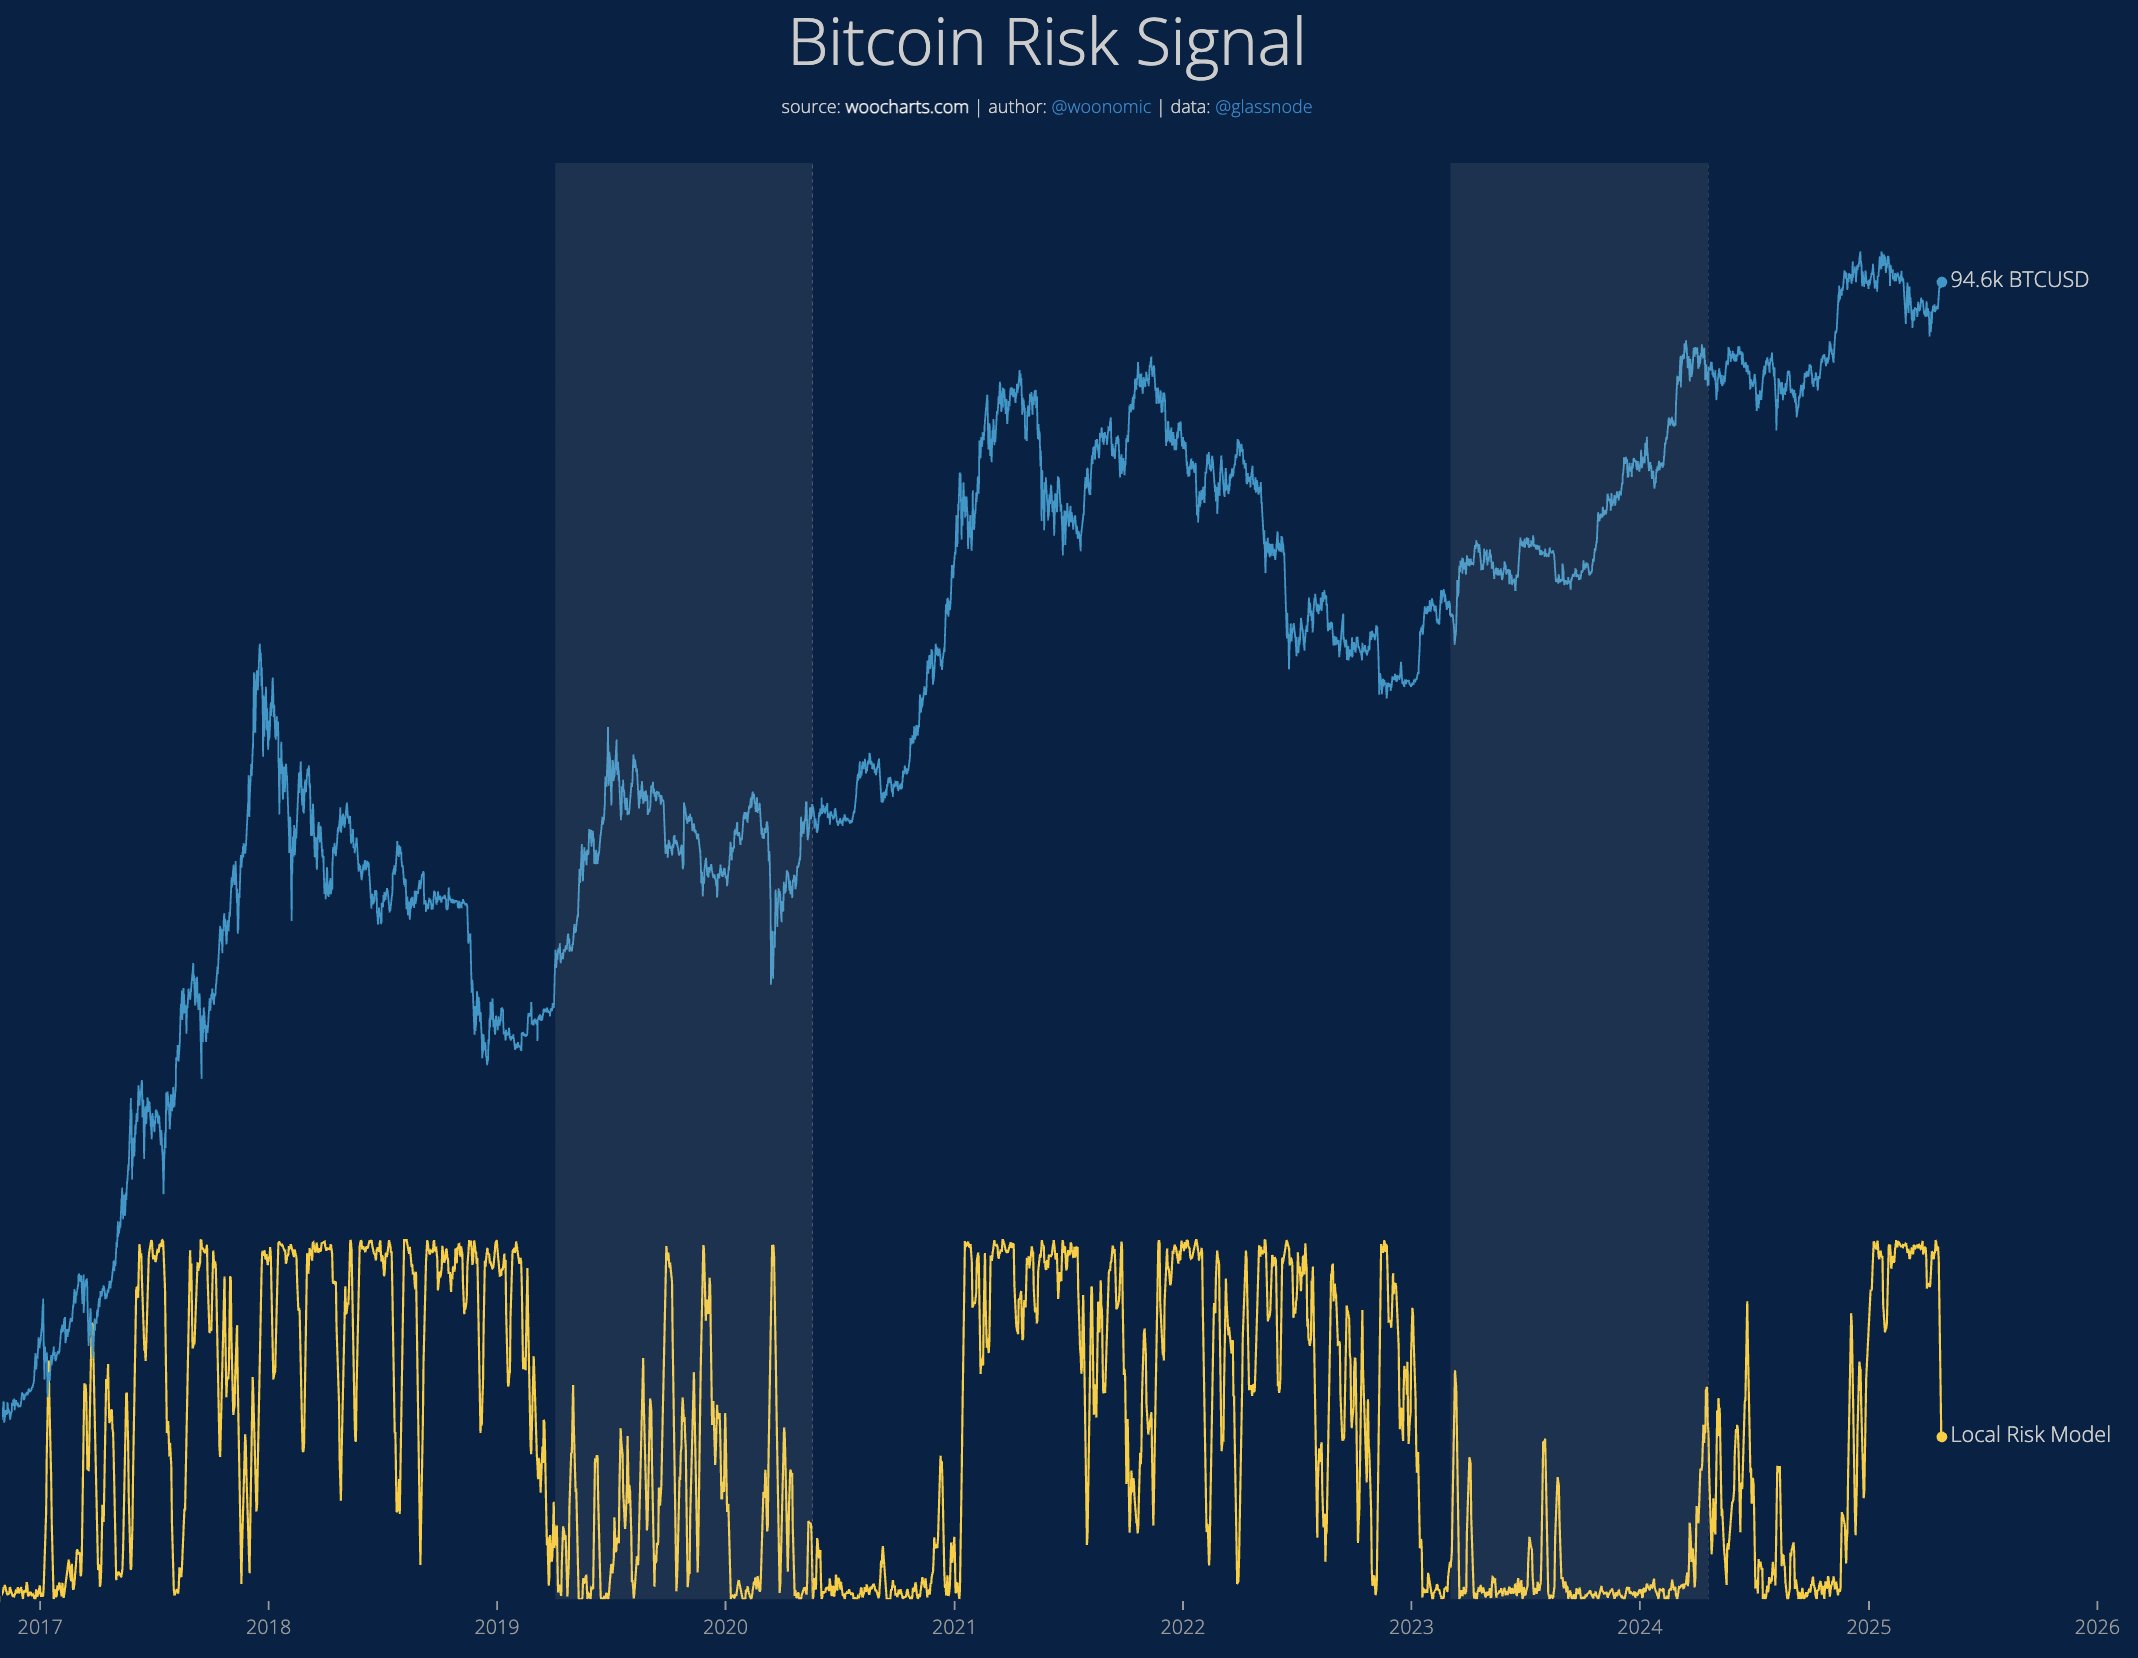
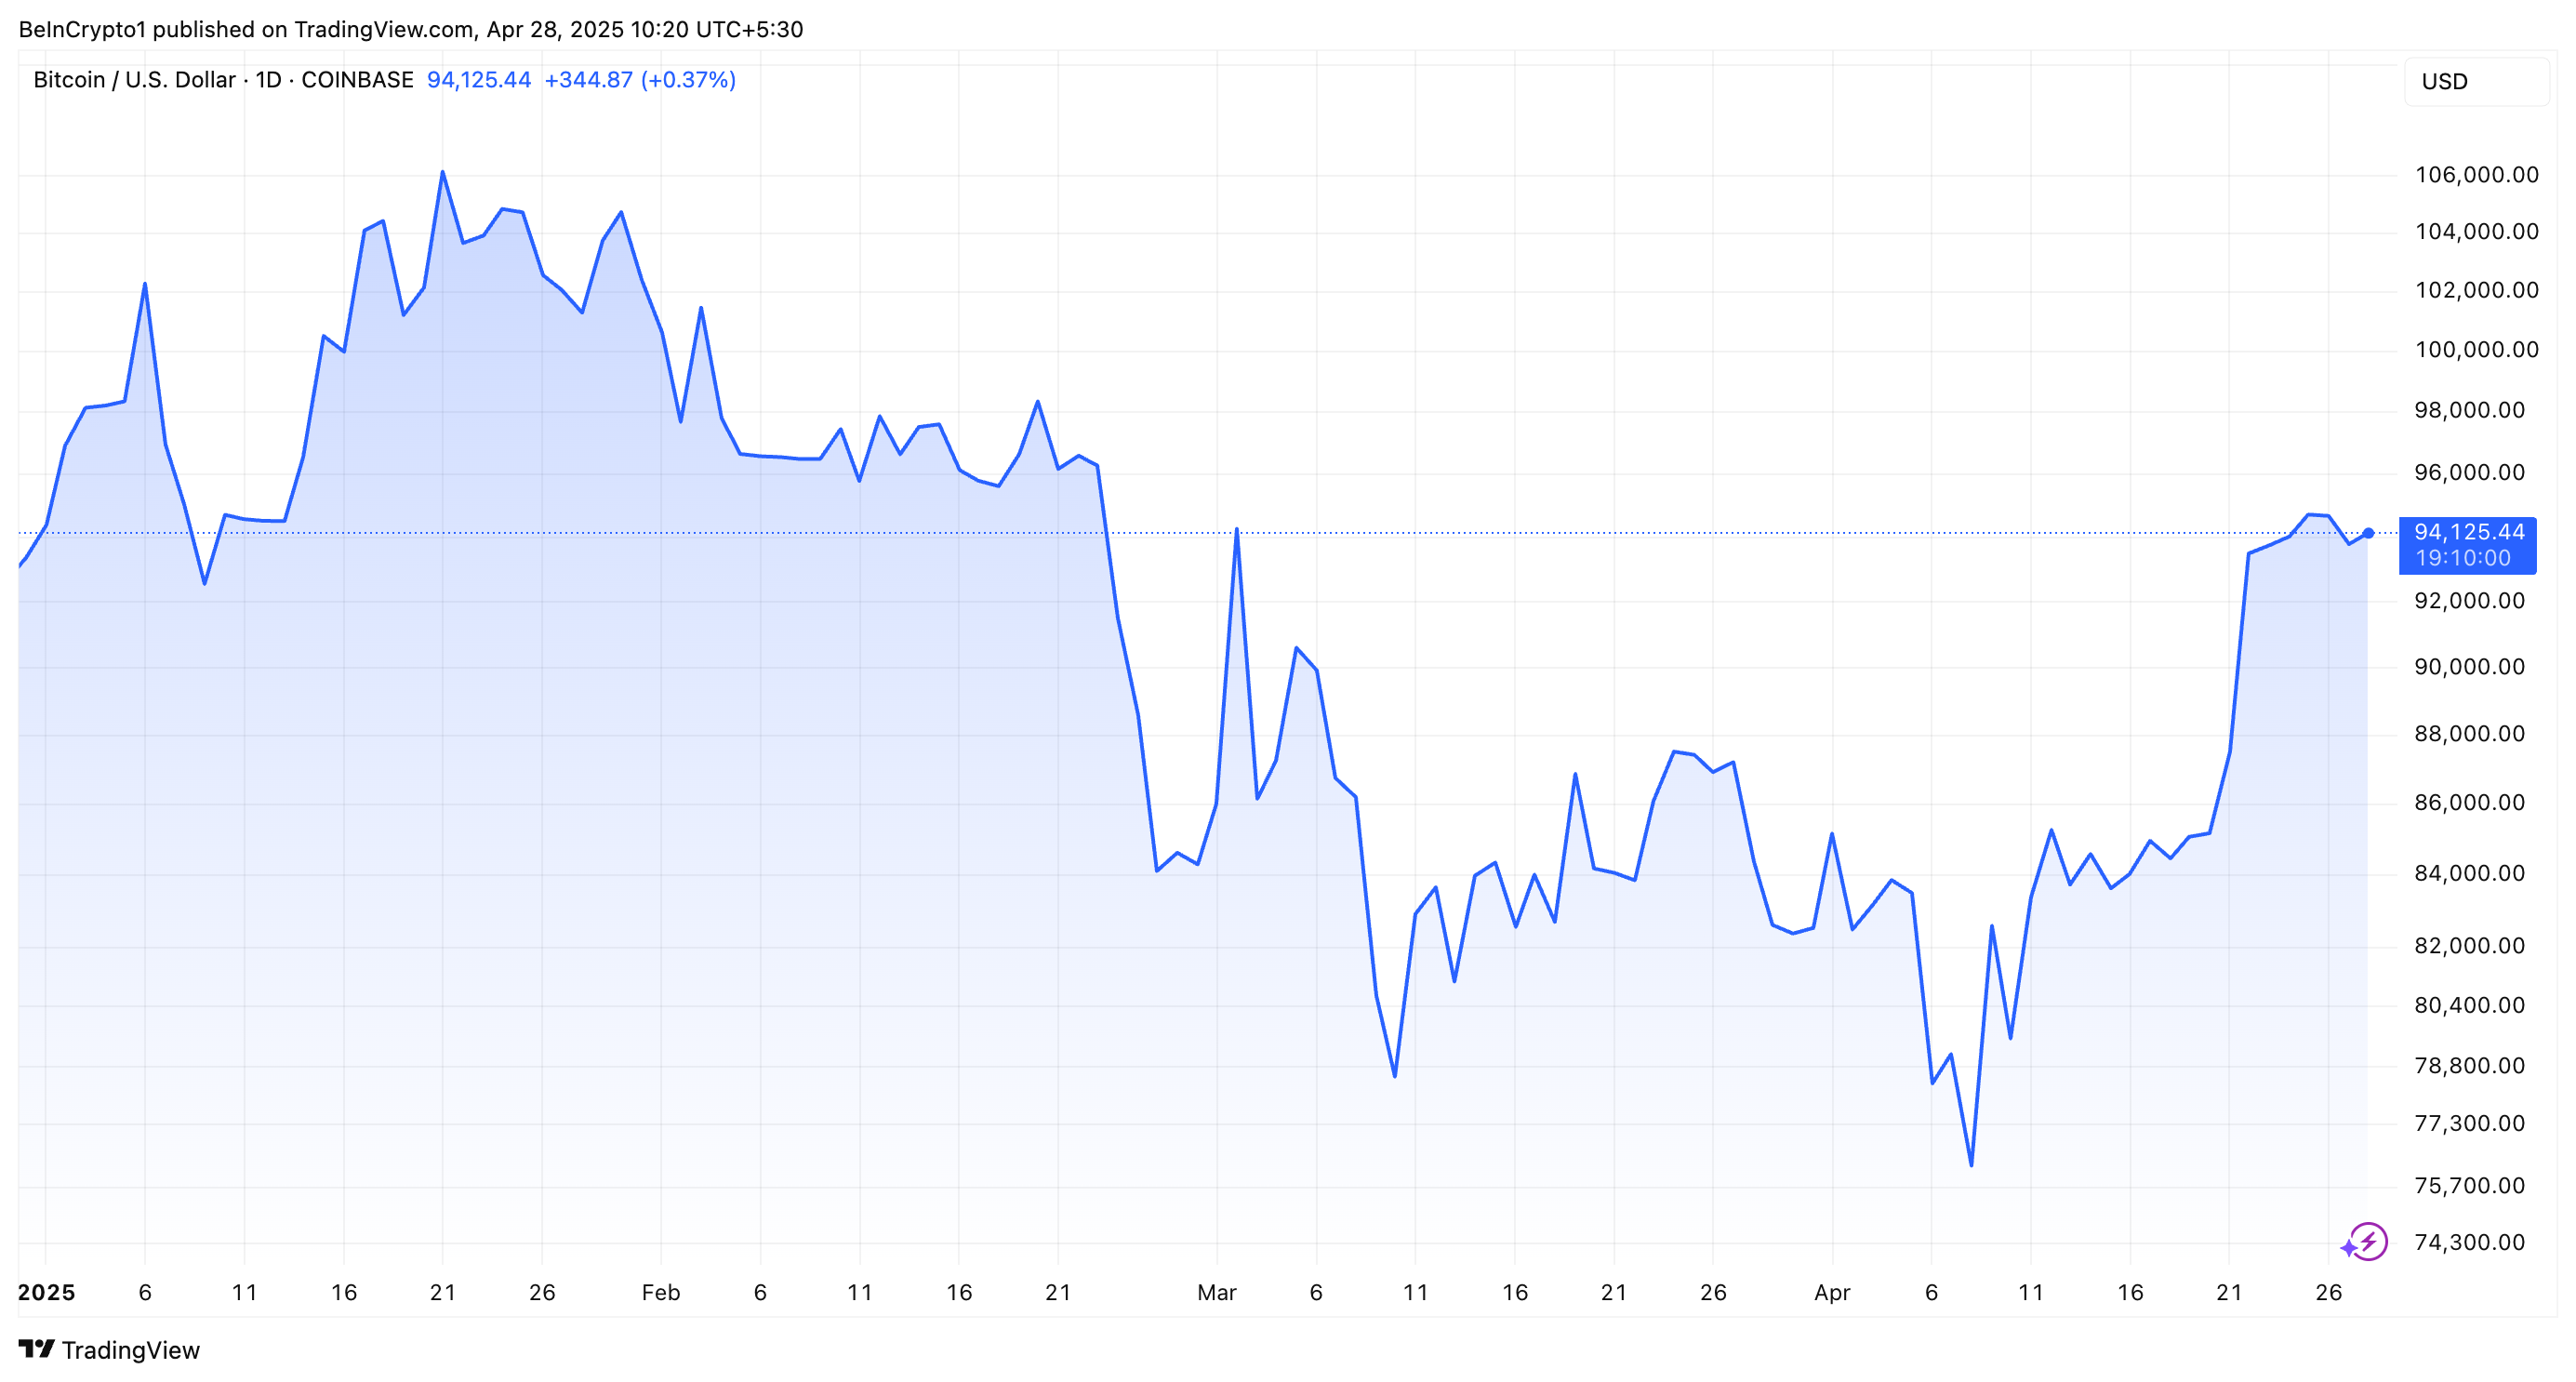
HBAR’s performance also seems closely tied to Bitcoin’s price action, with a strong correlation of 0.93 between the two. As Bitcoin continues to rise, currently approaching $95,000, HBAR is likely to follow suit.
Given Bitcoin’s strong market position, any further gains for the leading cryptocurrency will likely spill over into altcoins like HBAR. If Bitcoin continues its bullish path, pushing past key resistance levels, HBAR could see similar gains, propelled by the overall market optimism and BTC’s positive influence.
Throughout April, HBAR has maintained an uptrend, which is crucial for its recovery from the 43% losses seen in March. The price action in April will be a pivotal factor for HBAR as it looks to regain lost ground. Maintaining this upward trajectory is essential for the altcoin to recover and build on its current momentum.
Currently trading at $0.183, HBAR is aiming to break the key resistance level of $0.200. This level represents a psychological barrier for investors, and successfully flipping it into support could trigger further bullish reactions. If this happens, HBAR could see a rise to $0.222 as investor confidence strengthens and more market participants enter the space.
However, if HBAR fails to breach the $0.200 mark, it could face a decline to $0.167. If this happens, further selling pressure from investors looking to minimize losses could push the price down to $0.154. Such a drop would invalidate the short-term bullish outlook, potentially leading to more significant losses if the market sentiment turns bearish.
Welcome to the US Morning Crypto News Briefing—your essential rundown of the most important developments in crypto for the day ahead.
Grab a coffee to see what analysts say about Bitcoin amid the showdown between BTC behemoth Strategy (formerly MicroStrategy) and Jack Mallers’ investment firm, 21 Capital. With their Bitcoin models coming into question, is there a specific definition of what winning means in Bitcoin?
Strategy Grows Bitcoin Stockpile, Buys $1.42 Billion in BTC
Strategy announced that it recently purchased another 15,355 BTC worth approximately $1.42 billion at an average price of $92,737 last week.
The firm currently holds 553,555 BTC, valued at approximately $52.7 billion. The average buying price is $68,459, and the unrealized profit is $14.8 billion.
“By continuing to grow its Bitcoin holdings, the company maintains its status as a major force in the cryptocurrency market, drawing interest from investors and industry analysts. Strategy is the largest Bitcoin Treasury Company, an independent, publicly traded business intelligence company, and a Nasdaq 100 stock,” Phoenix reported.
A recent US Crypto News publication highlighted the advent of 21 Capital. The Bitcoin investment firm sprouted after Cantor Fitzgerald, SoftBank, Tether, and Bitfinex pooled $3 billion in capital.
Based on sentiment, this new venture could inadvertently challenge Strategy’s position at the helm of corporate Bitcoin ownership in a model sense. According to 21 Capital, Strategy size could make increasing its Bitcoin per share difficult, a metric investors tend to consider.
Amid chatter that 21 Capital could threaten the Michael Saylor-led firm, BitStrategy, a shareholder at Strategy, challenged the prospective market rival’s business model.
Tension Grows in Bitcoin Treasury Space
In a detailed post on X (Twitter), BitStrategy acknowledged the brewing tension in the Bitcoin treasury arena. However, it holds that Strategy is way ahead of the competition.
“Their company is in direct competition with ours, and they seek to exploit a perceived vulnerability in our structure, openly highlighting their strengths relative to ours to win investment,” BitStrategy challenged in a recent post.
Beyond BTC Yield, also reported in a recent US Crypto News publication, the firm initiated key performance indicators months ago- BTC Gain and BTC $ Gain.
Bitcoin Gain multiplies the BTC Yield by Strategy’s aggregate balance, reflecting the scale of the firm’s operations.
Bitcoin $ Gain takes this further, converting the BTC Gain into dollar terms, for added transparency.
This proactivity by Strategy suggests a commitment to defend its position as a leading Bitcoin-holding corporation amidst rising rivals.
“You can fake an impressive BTC Yield. You cannot fake an impressive BTC Gain,” BitStrategy chimed.
However, analyst KenjiKoshu argues that while Strategy may show substantial Bitcoin gains, smaller companies like 21 Capital could achieve higher Bitcoin per share.
“As someone who has done deep thinking about why MSTR is undervalued, it might be true BTC gain can still be substantial if not higher for MSTR. On a per-share basis, however, which would be what supports the stock; it will be hard to deny a smaller, similarly reputable company is going to make more Bitcoin per share when on the same strategy,” the analyst wrote.
This outlook aligns with sentiment from 21 Capital that Strategy’s large size impedes increasing its Bitcoin per share.
However, BitStrategy articulated that the point of BTC Gain and BTC $ Gain signals the importance of a whole-of-company view of performance relative to a per-share view.
Per the shareholder, there is no agreed-upon conventional valuation methodology for Bitcoin companies. This means any metric is somewhat arbitrary.
Investors increasingly turn to digital assets as a safe haven, with Bitcoin becoming a hedge against the US dollar’s volatility as crypto inflows surge to $3.4 billion.