Ethereum’s Pectra upgrade has successfully launched on the mainnet at epoch 364032. This update introduces new smart account wallet features, boosting user experience. It also doubles the Layer 2 blob data capacity, improving scalability. Additionally, validator user experience sees important enhancements. The Ethereum community will keep a close watch on the network over the next 24 hours to ensure everything runs smoothly.
The Binance listing is one of the bullish events in the crypto market, but that’s not what happened with the Mubarak meme coin price. As a newly launched token, it is often in the limelight, especially as the former Binance CEO Changpeng Zhao showed support for this meme-themed cryptocurrency. As a result, its price saw many uptrends, but today, it is different as it is down by 40%. Why? Let’s discuss this.
Mubarak Meme Coin Price Crashes With Binance Listing
Binance recently listed four cryptocurrencies, including Mubarak. Although it was expected, the Mubarak meme coin price crash came unexpectedly. Experts believe this happened as the sellers were prepared to benefit from the potential rally.
Although the token did witness a rally at first, hitting $0.011, it soon crashed amid seller’s activity. At present, it trades at $0.08652 after bearing a 40% loss today and 60% away from the ATH of $0.2158, set ten days ago.
Interestingly, when this token plummeted, the three other listed tokens, i.e., BROCCOLI, TUT, and BANANAS31, had significant uptrends, disappointing investors.
Crypto Whales to Blame For Mubarak Crash
Talking of the Mubarak coin price crash, the 205% surge in the trading volume reveals that the investors’ activity is high. A significant portion of this is from the crypto whales, which are on a selling spree and fueling this crash.
Lookonchain X’s post revealed one such whale who had deposited 6.14M Mubarak earlier in the day. Interestingly, the whale itself made nearly $760k in profits, but the activity resulted in increasing the selling pressure on the token.
Another whale has deposited 10.28M Mubarak on Binance and sold it at a loss. Experts claim such sell-offs are made voluntarily to bring the token down before fueling a price reversal.
Experts Predict Mubarak Meme Coin Price to Surge 5x
According to crypto experts, Changpeng Zhao’s connection to Mubarak will bring price rallies. One such claim is that even though the initial outcome of the Binance listing turned into correction, it is up for a 5x surge due to historical trends and upcoming Eid Mubarak celebrations.
Another pointed out a potential breakout from the symmetrical triangle pattern. He claimed that the bull’s presence would push its price above key resistances before predicting a Mubarak meme coin price rally to $0.17.
However, the ongoing bearish trend is hard to ignore, where the key resistance is at $0.14 and $0.16. More importantly, the RSI, MACD, and key moving average indicate a bearish momentum.
Investors must keep an eye on the performance, as its key support is $0.086. A bounce from this could bring an uptrend. In contrast, a drop can push it toward $0.08.
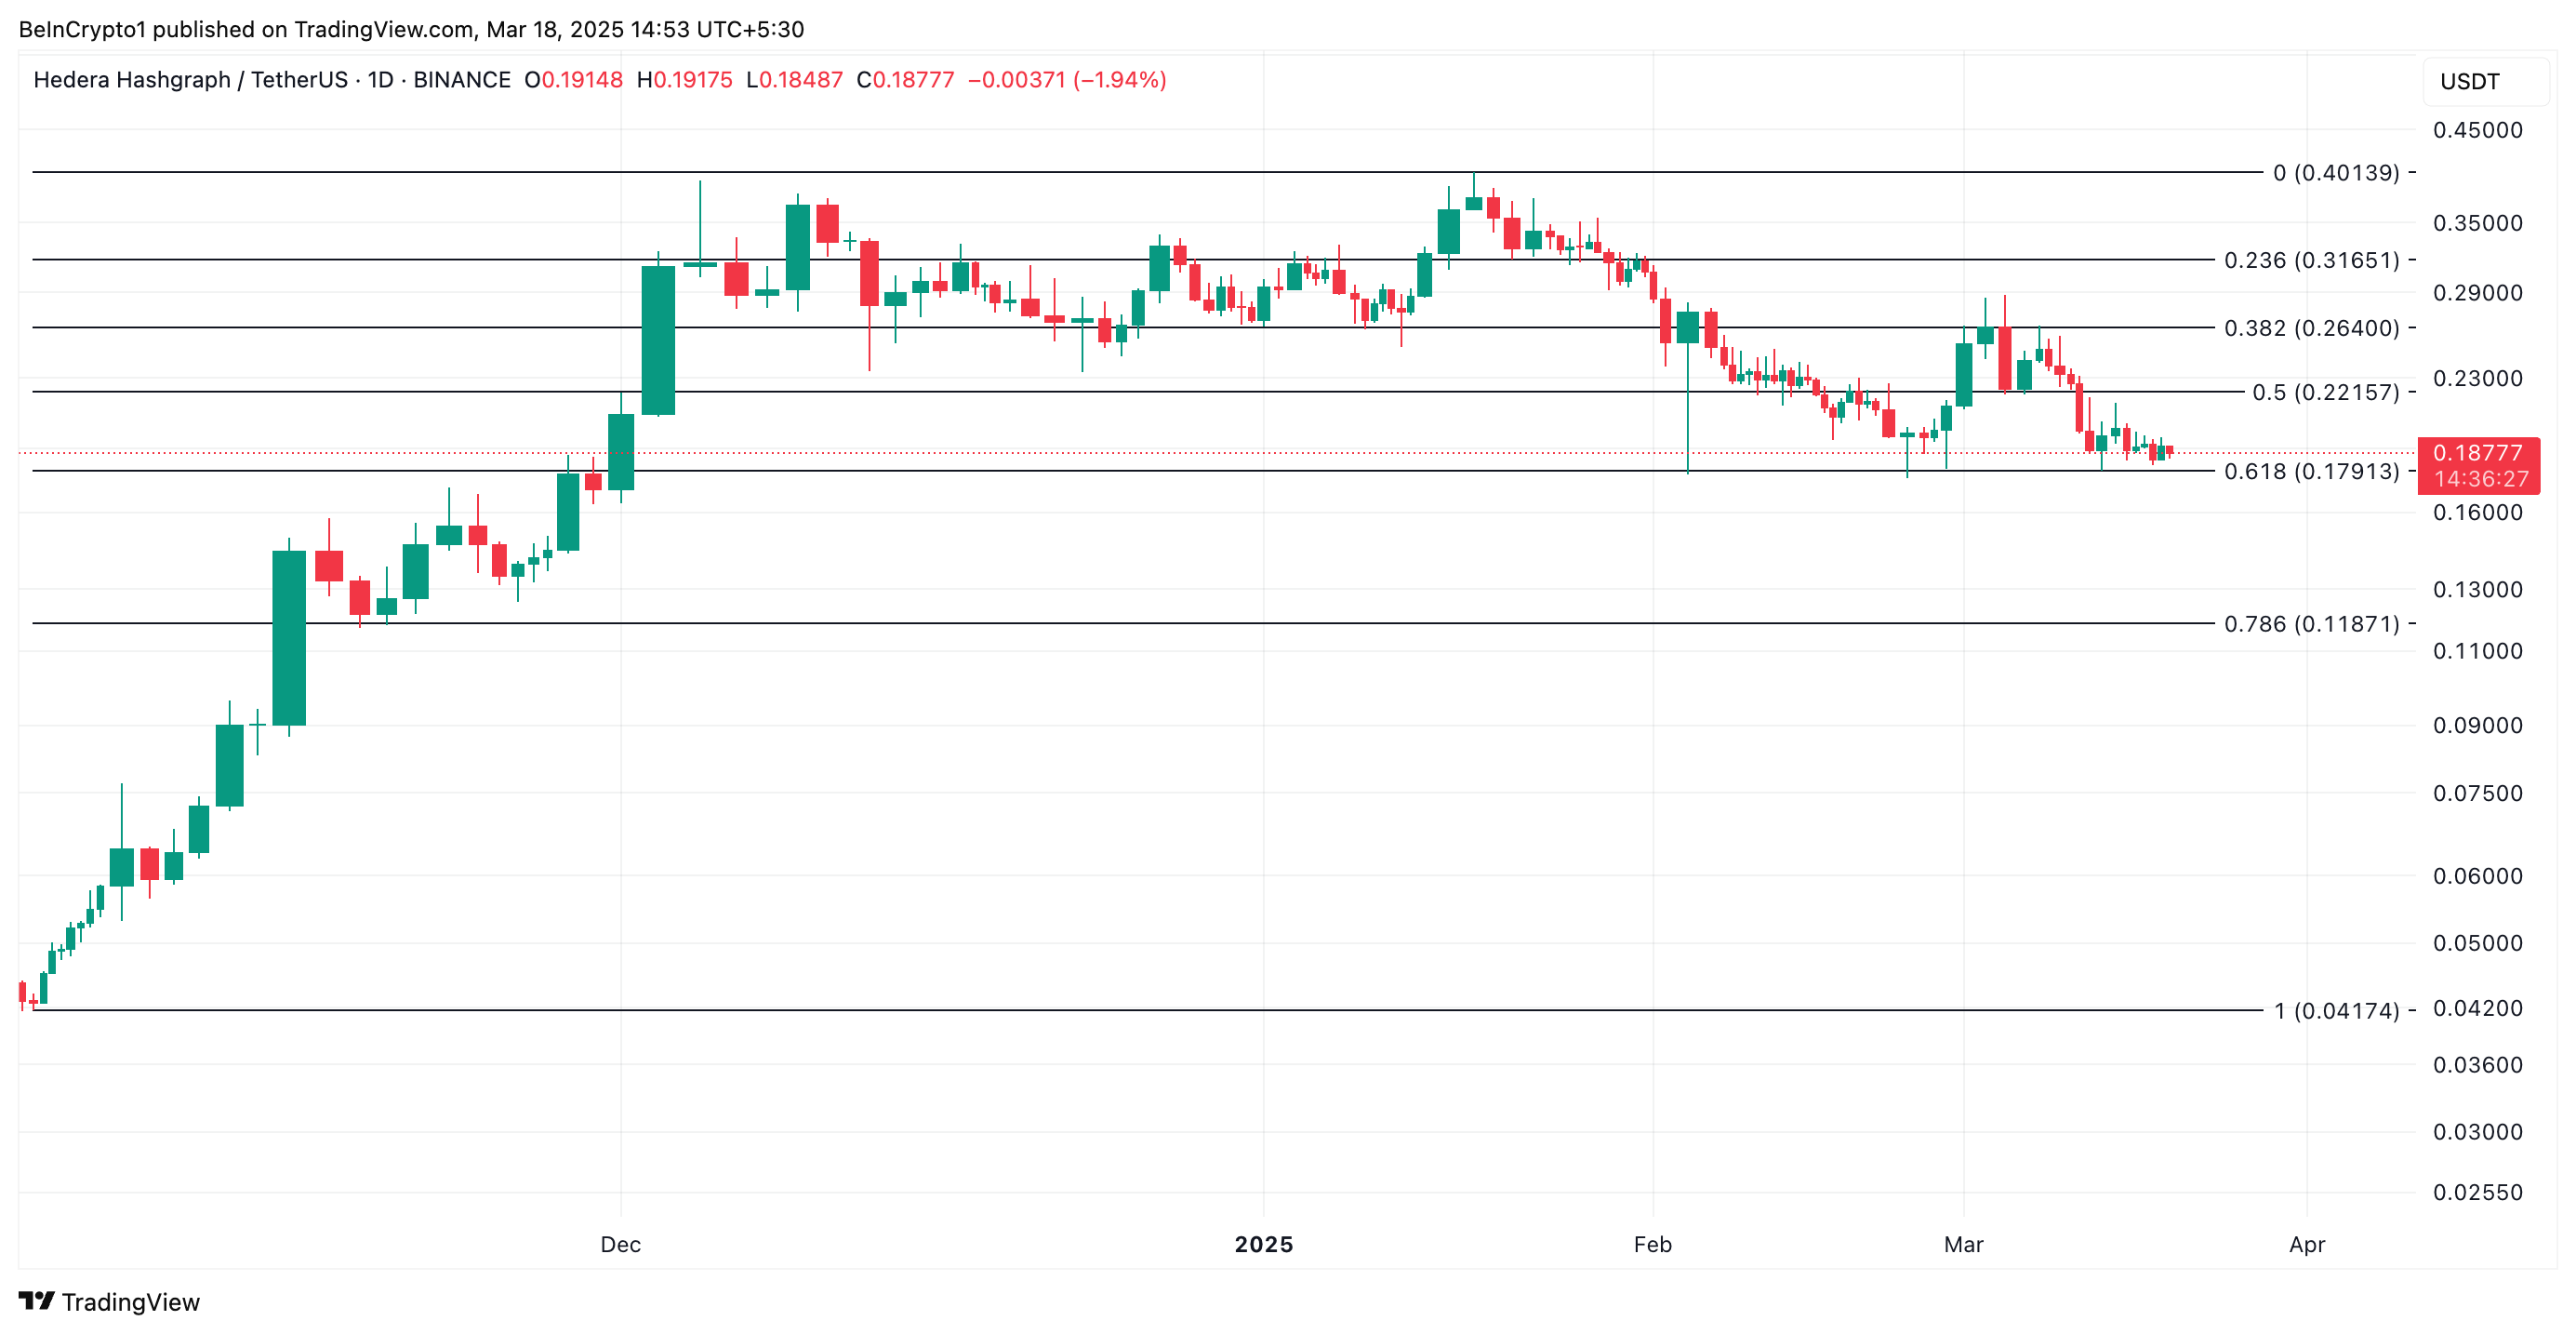
Hedera remains under heavy pressure, marking yet another day of decline as traders continue to bet against the altcoin. It trades at $0.18 at press time, noting a 2% price drop over the past 24 hours.
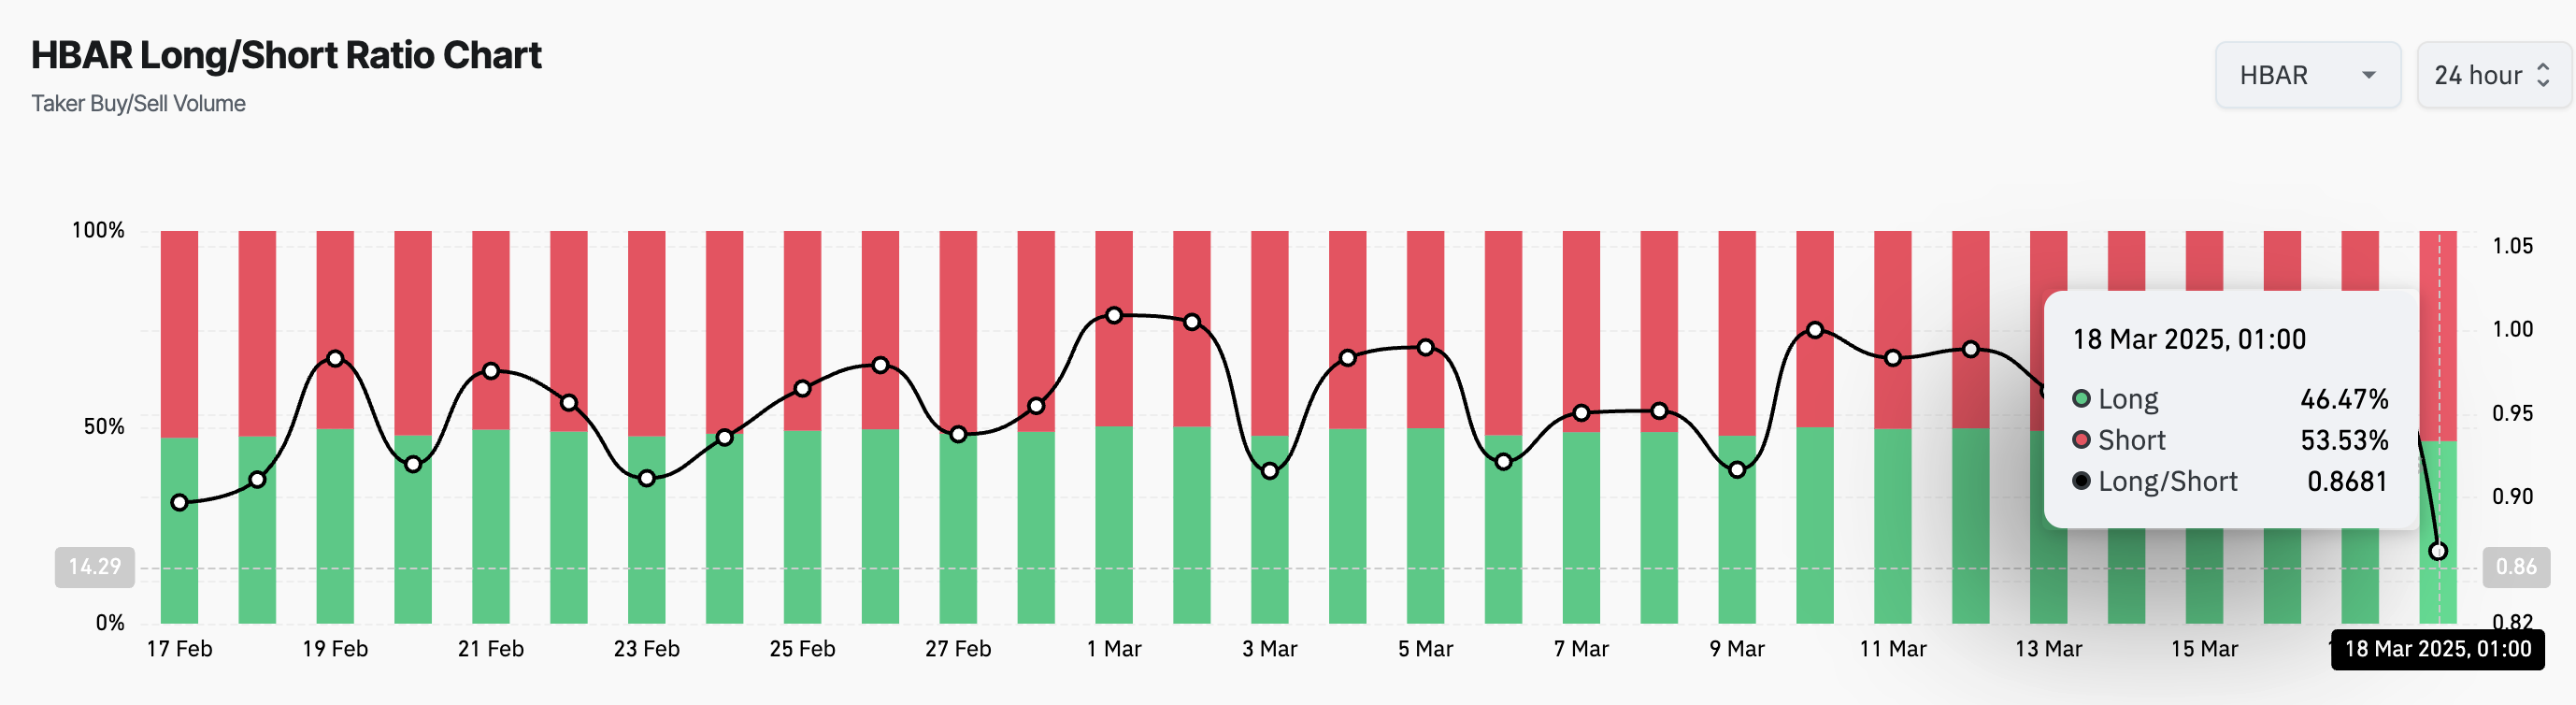
With its long/short ratio signaling a surge in short interest, market sentiment has turned increasingly pessimistic.
Short Sellers Tighten Grip on HBAR
HBAR’s long/short ratio has dropped to 0.86, its lowest level in a month. This reflects a sharp increase in short positions among derivatives traders.
The long/short ratio measures the proportion of long positions (bets on price increases) to short positions (bets on price declines) in the market. A ratio below one means there are more short positions than long ones. This indicates that traders are predominantly bearish on HBAR and hints at a higher likelihood of continued downside movement.
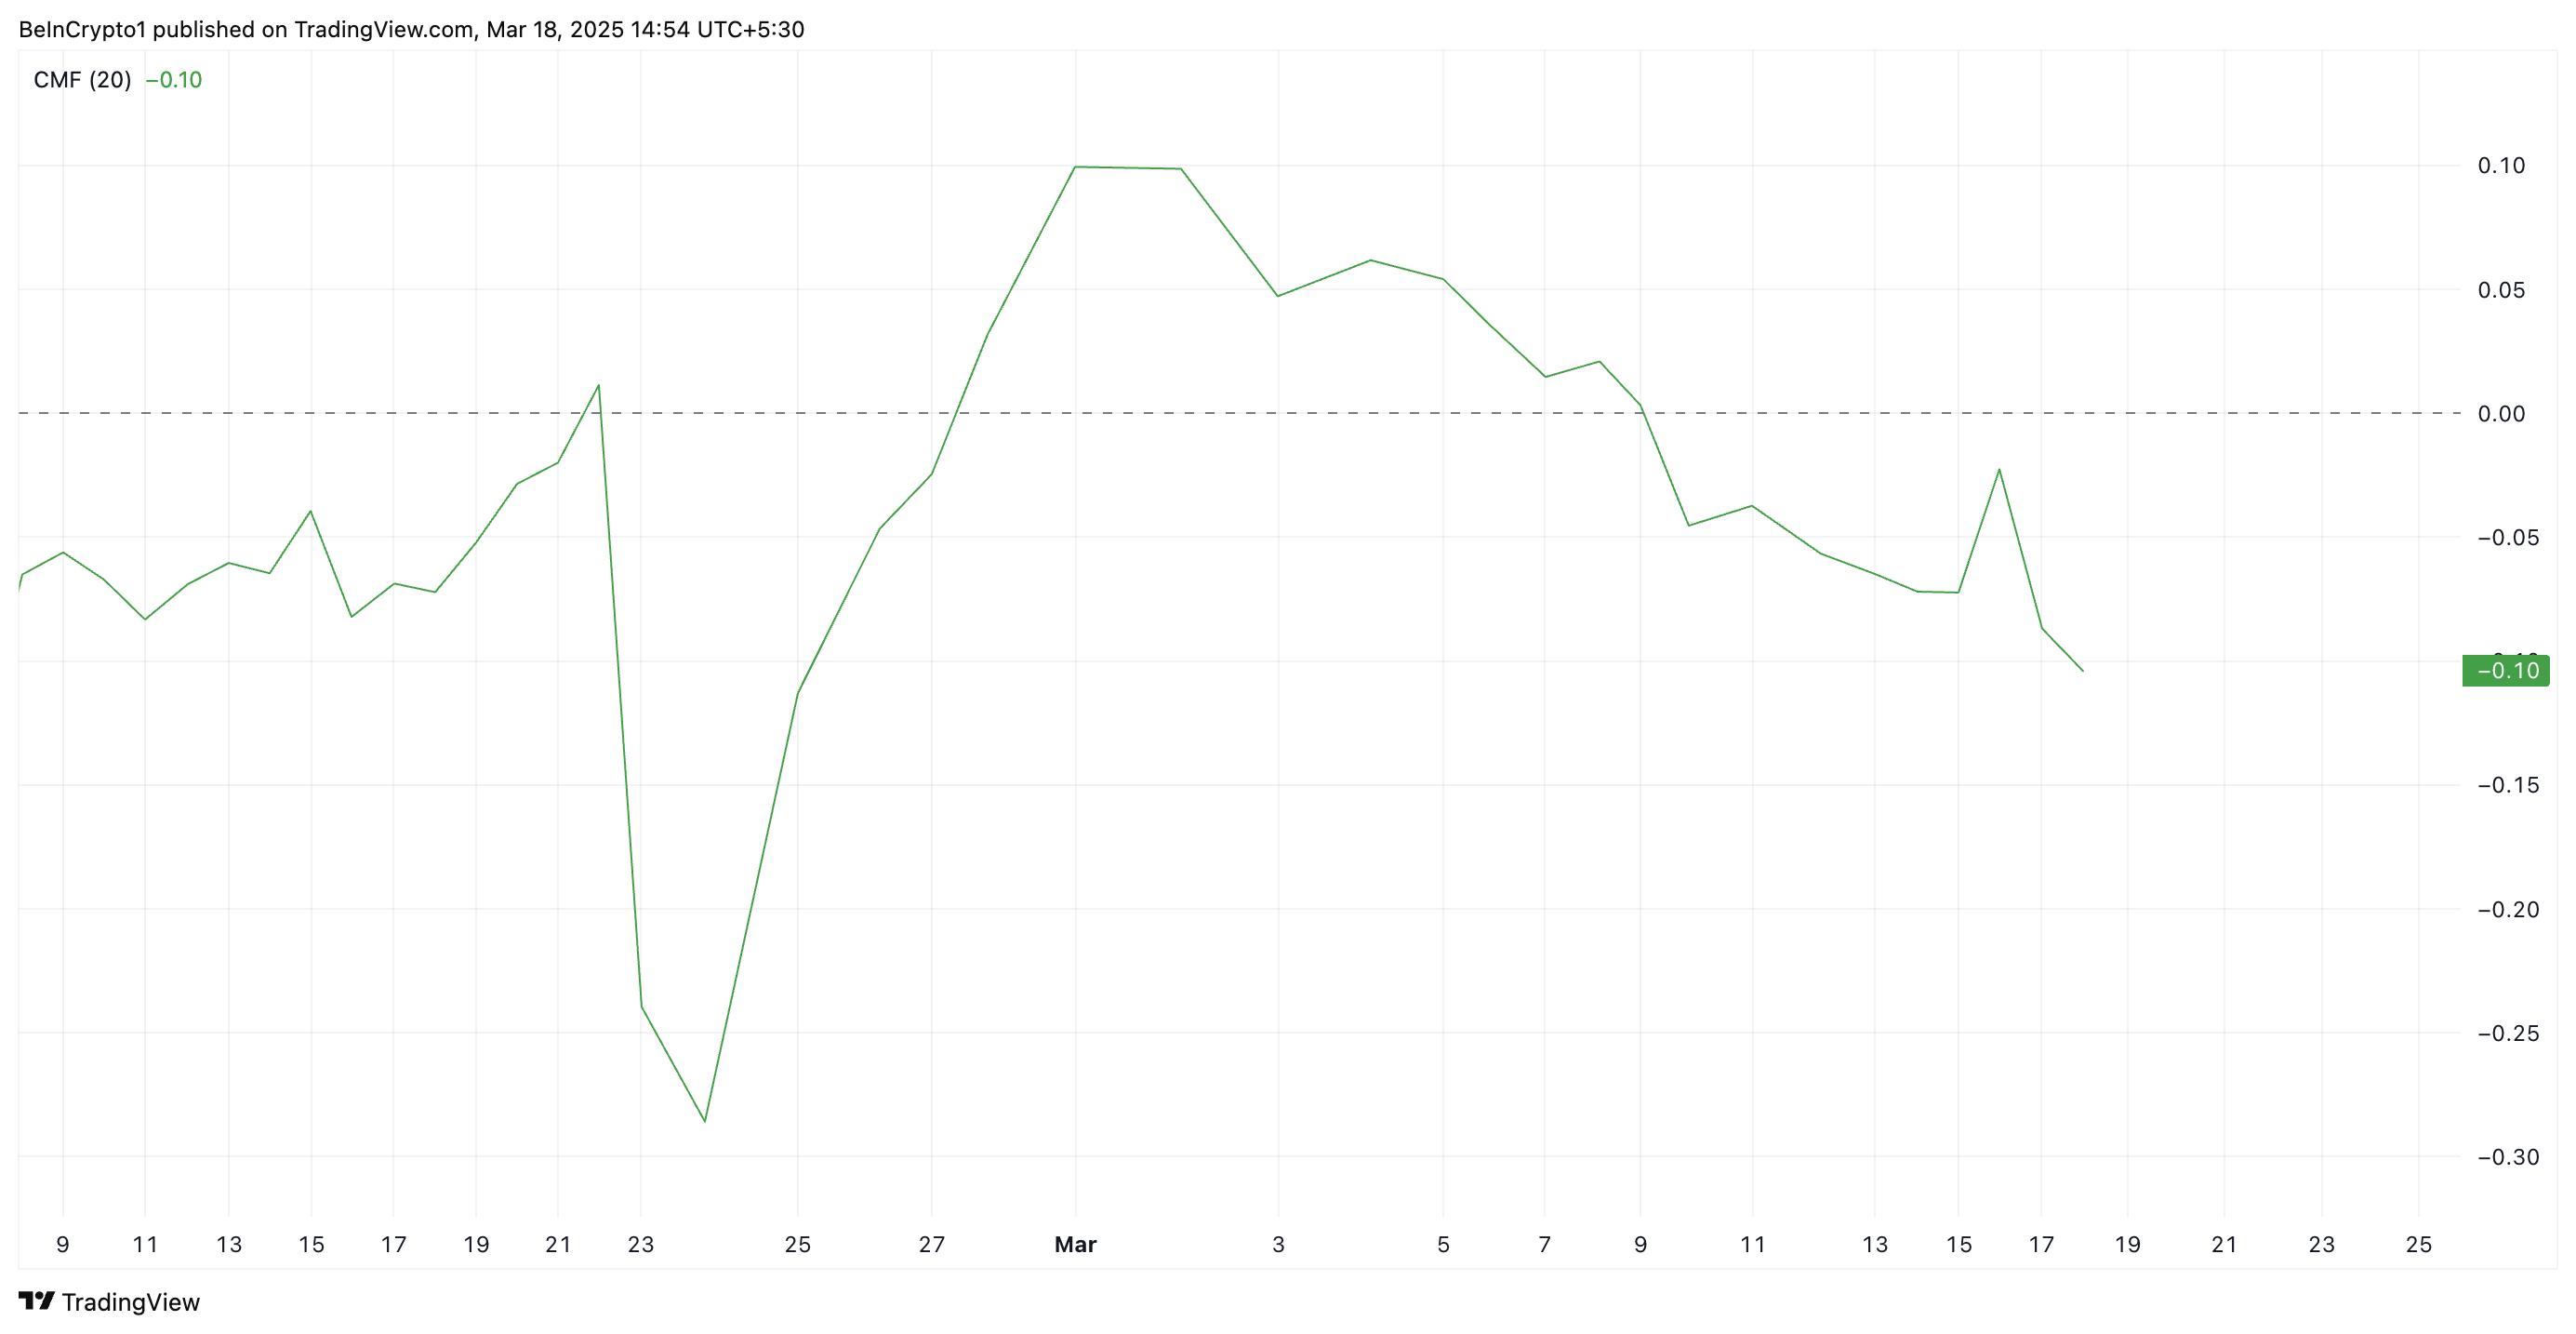
Further, HBAR’s negative Chaikin Money Flow (CMF) on the daily chart supports this bearish outlook. This indicator, which measures how money flows into and out of the asset, is below zero at -0.10 when writing.
HBAR’s negative CMF reading suggests high selling activity, with its sellers dominating the market and looking to push prices lower.
HBAR Traders Brace for Volatility as Price Flirts with Key Support Levels
The growing demand for short positions highlights investors’ expectations of further downside, raising concerns about HBAR’s ability to hold above the critical support level formed at $0.17.
If it fails to hold, the token’s price could plummet to a multi-month low of $0.11, which it last traded at in November.
However, a resurgence in demand for the altcoin could invalidate this bearish projection. If buyers regain market dominance and increase demand, HBAR could rebound toward $0.22.
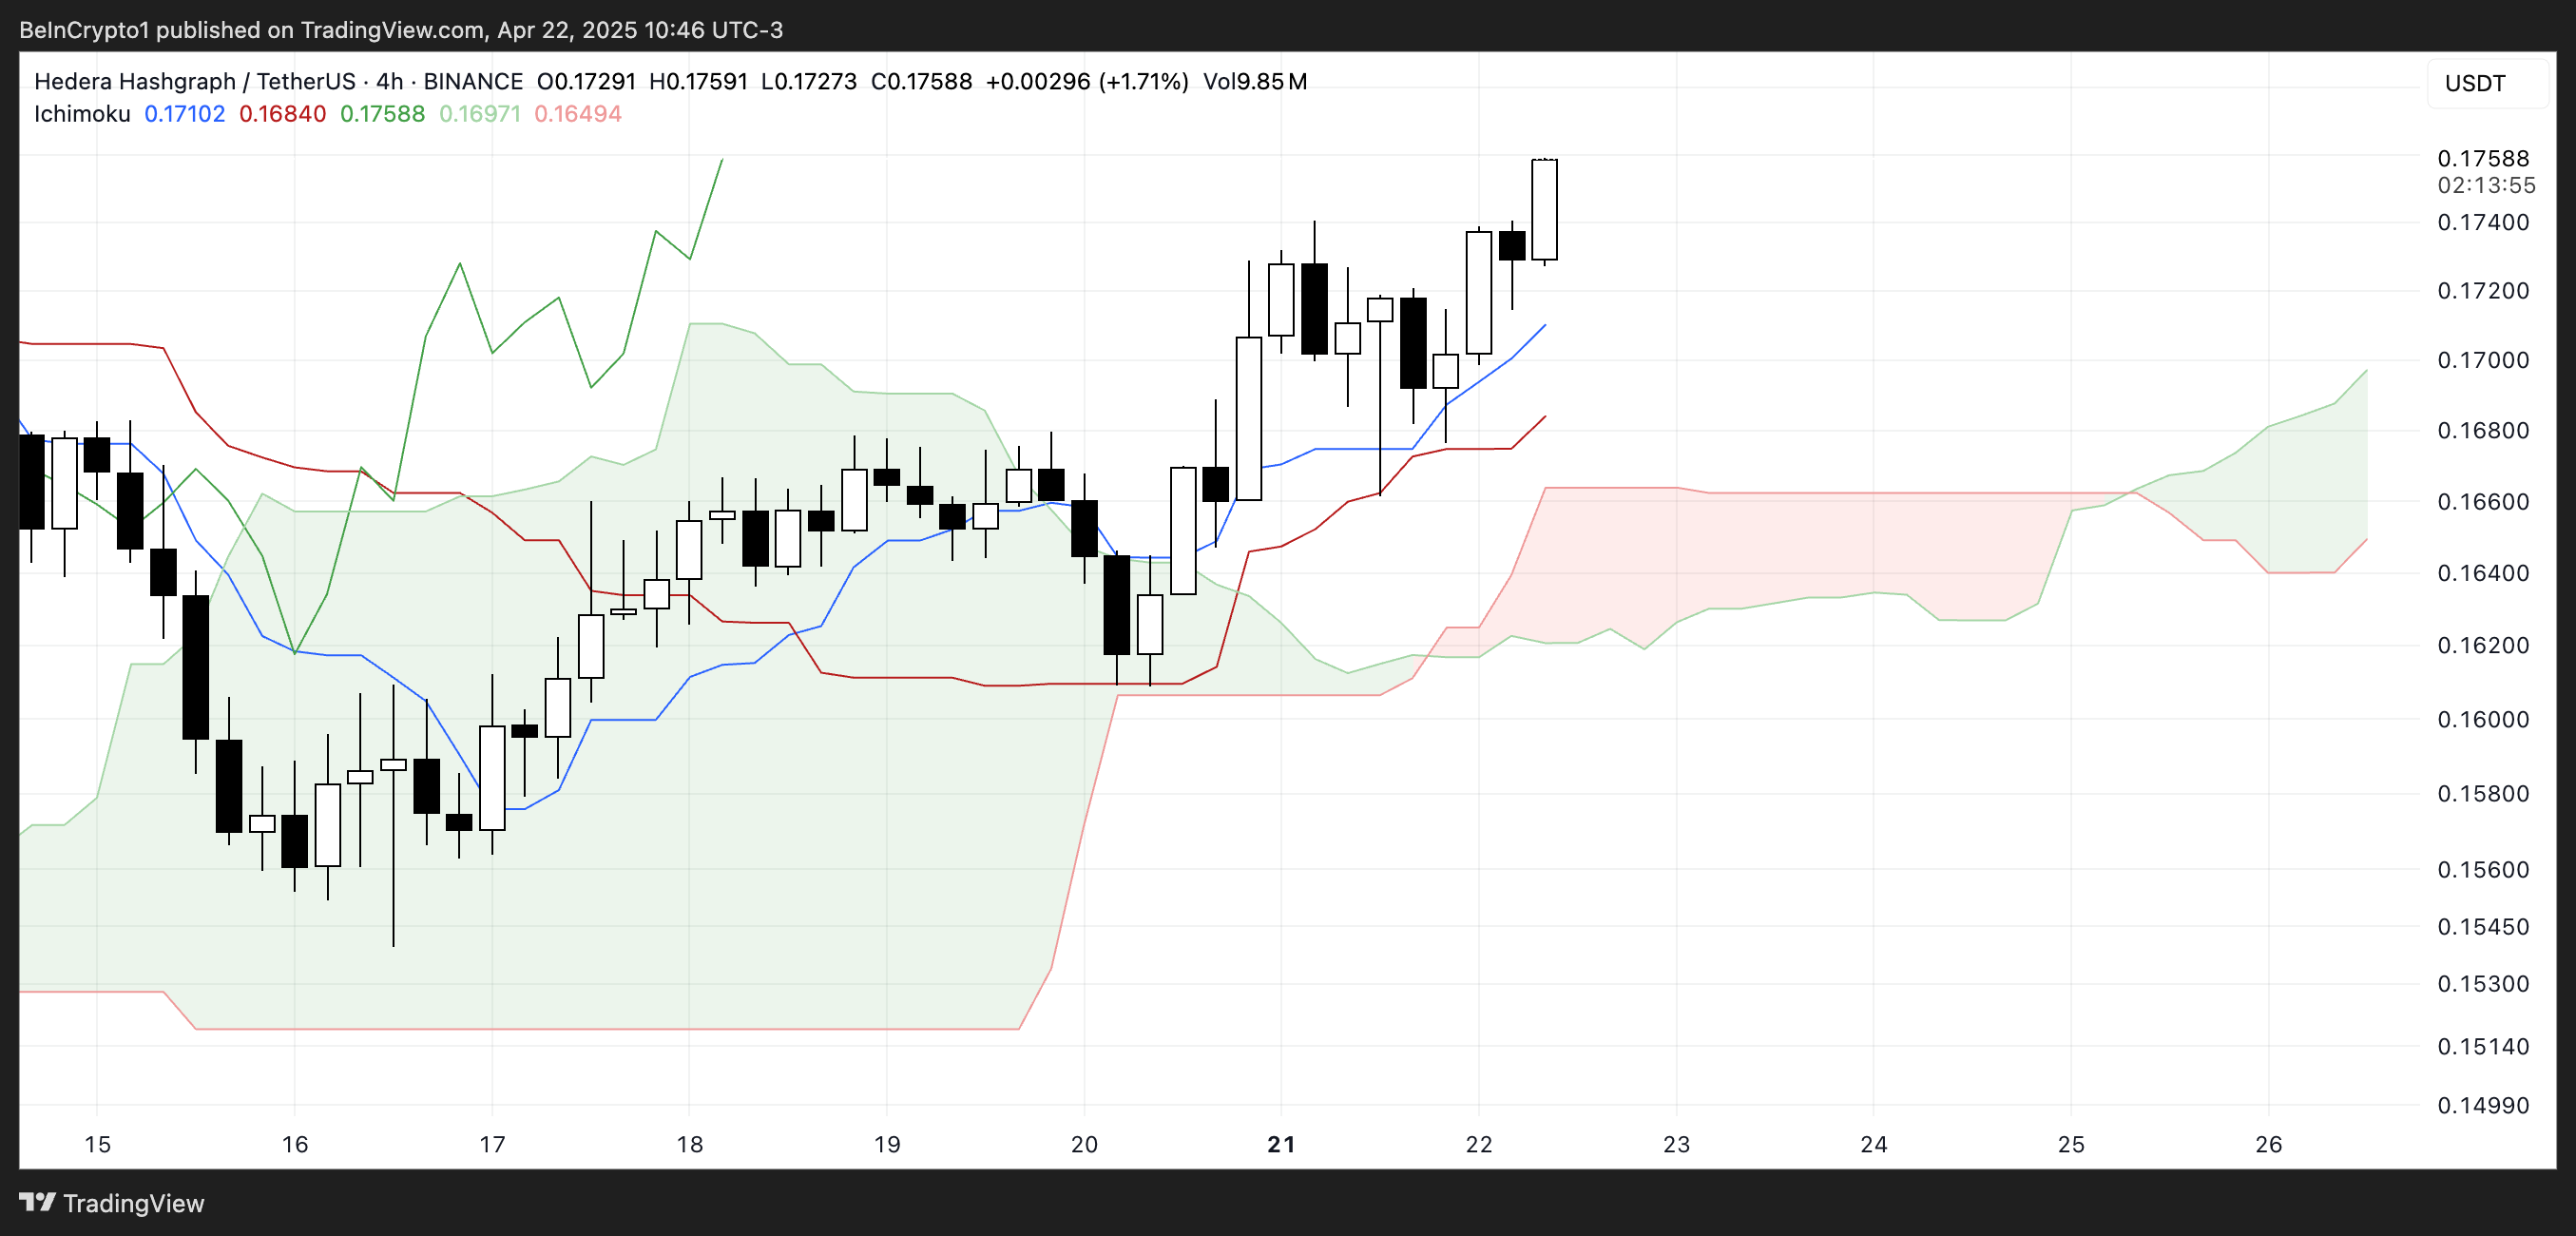
Hedera (HBAR) is up more than 6% in the last 24 hours, showing renewed signs of strength across multiple technical indicators. Momentum is building, with the DMI suggesting buyers are starting to take control and the Ichimoku Cloud showing a clean bullish structure.
A potential golden cross on the EMA lines could further fuel the uptrend, opening the door for a breakout above $0.178 and possibly even $0.20. With sentiment improving and resistance levels in sight, HBAR is positioning itself for a key move after weeks of consolidation.
Hedera Signals a Potential Shift as Buyers Regain Momentum
Hedera’s Directional Movement Index (DMI) is showing early signs of momentum building, with its ADX rising to 16.27, up from 13.54 two days ago.
The ADX (Average Directional Index) measures the strength of a trend, regardless of direction. Readings below 20 indicate a weak or sideways market, while values above 25 suggest a strong and sustained trend is forming.
With the ADX still under 20, HBAR isn’t trending strongly yet, but the recent increase points to a potential shift in momentum.
The +DI (positive directional indicator) is currently at 22.6 — up from 14.19 two days ago, though slightly down from 26.17 yesterday, and rebounding from 17.8 earlier today.
This shows buying pressure has picked up recently, even if there’s short-term fluctuation. Meanwhile, the -DI (negative directional indicator) has dropped to 13.24 from 17.54 yesterday, signaling weakening selling pressure.
Together, these movements suggest bulls are starting to take control, and if the ADX continues to rise above 20, it could confirm a strengthening uptrend for HBAR.
Hedera Maintains Bullish Momentum as Trend Structure Holds Firm
Hedera’s Ichimoku Cloud chart is currently flashing strong bullish signals. Price action is well above the Kumo (cloud), which indicates clear upward momentum.
The cloud has transitioned from red to green, signaling a shift in sentiment from bearish to bullish.
This transition often suggests that the current trend could sustain if no significant reversal emerges.
The Tenkan-sen (blue line) is positioned above the Kijun-sen (red line), reinforcing a short-term bullish bias. Additionally, the future cloud is sloping upward, hinting at continued strength ahead.
The Chikou Span (green lagging line) is also above the price candles and cloud, further confirming the alignment of all Ichimoku elements in favor of the bulls.
Unless the price breaks down below the Tenkan-sen or the cloud itself, the outlook remains positive.
Hedera Eyes $0.20 Breakout as Golden Cross Nears
Hedera’s EMA lines are showing signs of convergence, indicating that a golden cross could form soon — a classic bullish signal. If that happens, HBAR could break the resistance at $0.178, and if the uptrend continues, it may climb to test $0.20.
Should bullish momentum fully return, Hedera price could rise toward $0.258, marking its first move above $0.25 since early March.