As Bitcoin (BTC) price signals a potential rebound beyond $90k soon, Dogecoin (DOGE), the leading dog-themed memecoin secured via the proof-of-work (PoW) consensus method, has hinted at possible bottoming. Since March 11, Dogecoin price has rebounded over 15 percent to trade at about $0.1721.
Dogecoin price has depicted a high correlation with Bitcoin price, thus likely to rebound in the near future. Moreover, the crypto market is bound to significantly benefit from the easing yields in the U.S. bond market amid the ongoing bull rally for gold.
Dogecoin Price Expectations
From a technical analysis standpoint, Dogecoin price has been forming a macro rising trend, characterized by higher highs and higher lows. After a notable decline since the second inauguration of U.S. President Donald Trump, Dogecoin price has been retesting the lower border of a rising channel in the past two weeks.
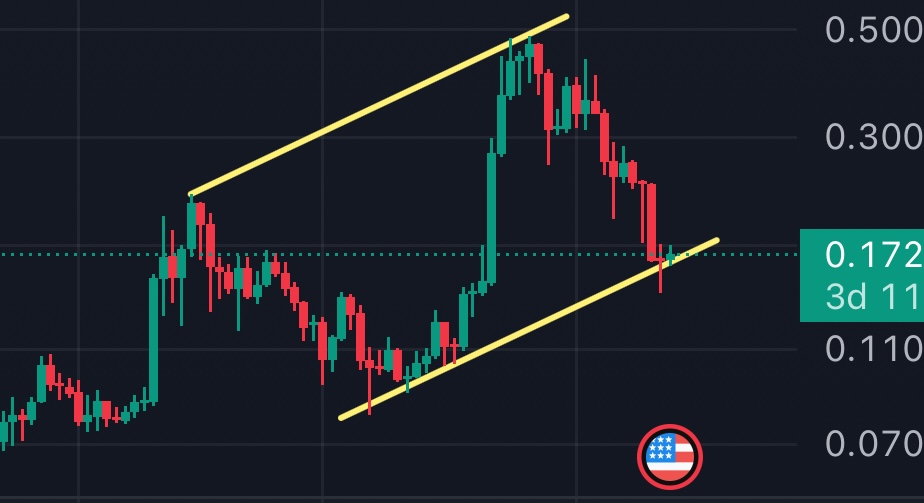
In the daily time frame, Dogecoin price has been forming an ascending triangle, after being trapped in a parallel falling trend. As a result, a consistent close above the resistant level around $0.178 will result in a 15-20 percent spike in the coming days to retest the upper border of the falling logarithmic trend.
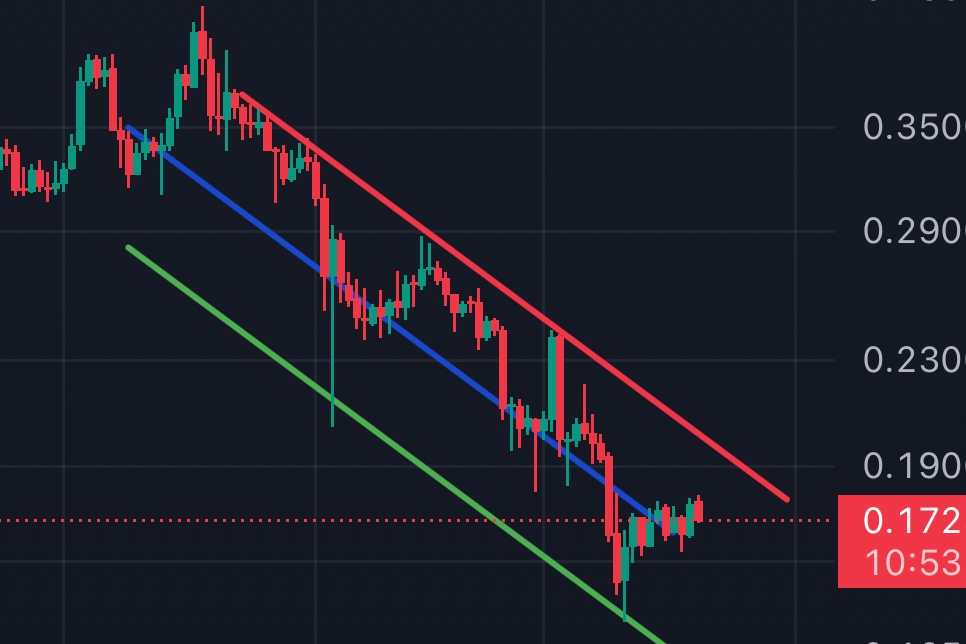
However, a consistent close below 16 cents could trigger further sell-off towards the next target of about 14 cents.
Fundamental Outlook
Dogecoin has grown to a vibrant memecoin ecosystem backed by institutional investors participating in mining processes and global merchants accepting it for payments. As of this writing, the Dogecoin network has about 6.2 million on-chain holders.
According to on-chain data analysis, the Dogecoin network has recorded a significant spike in whale activities during the last week. In the past week, Dogecoin investors with an account balance of between 1 million and 10 million added around 110 million coins to currently hold about 10.44 billion.
Meanwhile, the number of active addresses on the Dogecoin network has doubled in the past few weeks to about 280k at the time of this writing.
Pi Coin price has gained by 18% in the last two weeks and outperformed some of the top altcoins by market cap. These gains have left investors wondering whether Pi Network might be one of the best investments to make in 2025. In this article, we explore various reasons why a trader should consider holding at least 10,000 PI tokens before the end of the year.
Why You Should Hold 10K Pi Coin Before 2025 Ends
One of the top reasons why a trader should consider holding at least 10,000 Pi Coins before 2025 ends is due to the bullish Pi Network price forecast, shared by Grok3, suggesting that traders who buy now could make returns of up to 700% by 2026.
Grok forecasts that the Pi Coin price might attain a $5 target by 2026, and attributes this price rally to multiple factors, including the adoption of the Pi Open Mainnet and top crypto exchanges listing the token. If a trader buys 10,000 PI tokens today for $6,300 and the price reaches $5, their investment will balloon to $50,000.
Besides posting massive gains in 2026, Pi Coin could also rally to as high as $20 by 2030 per Grok’s prediction. It also added that in a moderate and risky scenario, Pi Coin could reach $200 and $500, respectively, in the next four years.
What Will Drive Pi Network Price Rally?
The main factor that could fuel a massive surge in Pi Coin price is heightened adoption from institutions. As Coingape reported, some of the leading US banks might adopt Pi Network in the coming years, which will bolster investor confidence in the project and drive price gains.
At the same time, Dr. Altcoin has opined that Pi Coin could hit $314 in the next five years amid ongoing efforts by the Pi Core team to support the community. His forecast comes after the team bought back a large number of token unlocks.
“I still believe Pi will reach $314 within the next five years, and I have never been more confident in its future than I am today.”
As the community awaits the adoption of the Pi Network by top institutions, Pi Coin price might likely spearhead crypto market gains towards the end of the year. Traders holding at least 10,000 Pi Coins are poised to make solid returns.
Short-term Target for Pi Coin Price
According to the four-hour Pi Coin price chart, the bearish momentum around the altcoin is weakening, increasing the chances that the altcoin might move past $1. The SMA indicator supports this thesis after the 20-day SMA converged with the 100-day SMA from below, indicating that bullish momentum is building up.
At the same time, the AO histogram bars have crossed the zero line and flipped positive, further confirming that bulls are regaining control. Traders should watch out for a confirmed bullish crossover of the 20-day SMA to confirm that an uptrend will occur.
If Pi Coin price extends its gains, the next resistance level lies at $0.75. If it can break out from this price level, it may flip the market structure to bullish, and kickstart a strong uptrend to this altcoin past $1.
PI/USDT: 4-Hour Chart
In conclusion, the long-term forecast for Pi Coin price is bullish amid signs that the project might receive widespread adoption and usage. Meanwhile, the four-hour chart also shows that bullish momentum is building up. Therefore, traders should consider holding at least 10,000 Pi Network tokens to make significant returns before 2025 ends.
Ethereum (ETH) is under pressure as it attempts to recover from one of its worst-performing years among major cryptocurrencies, down nearly 50% in 2025. Despite signs of improving momentum, with RSI climbing and EMA lines hinting at a potential breakout, ETH continues to lag behind competitors like Solana in multiple metrics.
The ETH/BTC ratio has plunged to multi-year lows amid heavy institutional sell-offs. As ETH approaches key resistance, the market remains divided, with bulls eyeing a breakout and skeptics questioning the chain’s long-term relevance.
Ethereum Becomes 2025’s Worst Performer Among Top 5 Cryptos
Ethereum is currently the worst-performing major crypto asset in 2025, with its price down nearly 51% year-to-date, significantly underperforming Bitcoin (-5 %), Solana (-25.5 %), BNB (-13.5 %), and even XRP, which is up 1%.
This steep underperformance has sparked growing concerns about Ethereum’s future, especially as alternative chains like Solana and Base continue to gain momentum.
Solana is now leading the sector in key on-chain metrics such as DEX volume, apps revenue, and user activity, while Base is quickly capturing developer interest.
As these competitors rise, Ethereum’s dominance is being increasingly challenged across both narrative and usage, with some analysts even suggesting that XRP’s market cap could soon surpass Ethereum’s.
Biggest Cryptos Performance in 2025. Source: Messari.
The ETH/BTC ratio has collapsed to 0.01791 — its lowest point since 2020 — highlighting the scale of Ethereum’s decline relative to Bitcoin.
Compounding the issue are Ethereum’s low staking rates and Bitcoin’s growing dominance, both of which are shifting market sentiment and capital away from ETH.
As a result, Ethereum’s position as the leading smart contract platform is being questioned more seriously than ever before.
Ethereum Shows Signs of Recovery, But Momentum Remains Capped
Ethereum’s Relative Strength Index (RSI) has climbed to 57.26, up from 42.43 just a day ago, signaling a notable uptick in short-term momentum.
The RSI is a technical indicator that measures the speed and magnitude of recent price changes to evaluate whether an asset is overbought or oversold. It ranges from 0 to 100, with values above 70 typically indicating overbought conditions and values below 30 pointing to oversold levels.
Readings between 50 and 70 usually suggest moderate bullish momentum, while those between 30 and 50 lean bearish or neutral.
With ETH’s RSI now at 57.26, the asset is in bullish-neutral territory. It shows improving momentum but is not yet strong enough to indicate overheating.
Importantly, Ethereum hasn’t seen an RSI reading above 70 since March 24 — nearly a month ago — which signals that despite the recent bounce, it hasn’t entered overbought territory or shown signs of a sustained breakout.
This suggests cautious optimism: while buyers are regaining control, Ethereum still lacks the aggressive momentum that typically drives significant price rallies. If the RSI continues to rise and breaks above 70, it could point to stronger bullish sentiment returning.
Ethereum Battles Resistance as Market Questions Its Future
Ethereum’s EMA lines are starting to show signs of a potential bullish reversal. The price is now approaching a key resistance level at $1,669. If that level breaks, Ethereum price could target $1,749 next.
With strong momentum, it may even reach $1,954 — its first time above $1,900 since April 2. Short-term EMAs are moving closer to longer-term ones, a setup that supports this bullish outlook. Rising trading volume would further strengthen the case.
A successful breakout could help restore some investor confidence amid a challenging year for ETH.
If ETH fails to maintain upward momentum, it could retest the $1,535 support zone. A breakdown below that level would shift the structure back to bearish, opening downside targets at $1,412 and potentially $1,385.
In that scenario, Ethereum’s inability to reclaim key levels could further fuel doubts about its competitive edge, especially in light of rising activity on faster and cheaper alternatives.