Cardano’s price has surged 10% over the past 24 hours, riding the wave of a broader crypto market rally to reach a two-month high.
The sharp move upward has pushed ADA to levels last seen in early March and has reignited bullish sentiment among spot and derivatives traders.
Cardano’s 10% Pump Sparks Surge in Profitable Supply
On-chain data from Santiment reveals that Cardano’s double-digit rally has boosted the percentage of its supply in profit. As of this writing, approximately 74.14% of ADA’s circulating supply—equivalent to 26.91 billion tokens—is now held at a profit.
Cardano Percent of Total Supply in Profit. Source: Santiment
When an asset’s profit supply spikes, it means that a significant portion of its circulating supply is now worth more than when it was acquired. Historically, a rise in profit supply correlates with renewed accumulation and often hints at further upward momentum as market sentiment improves.
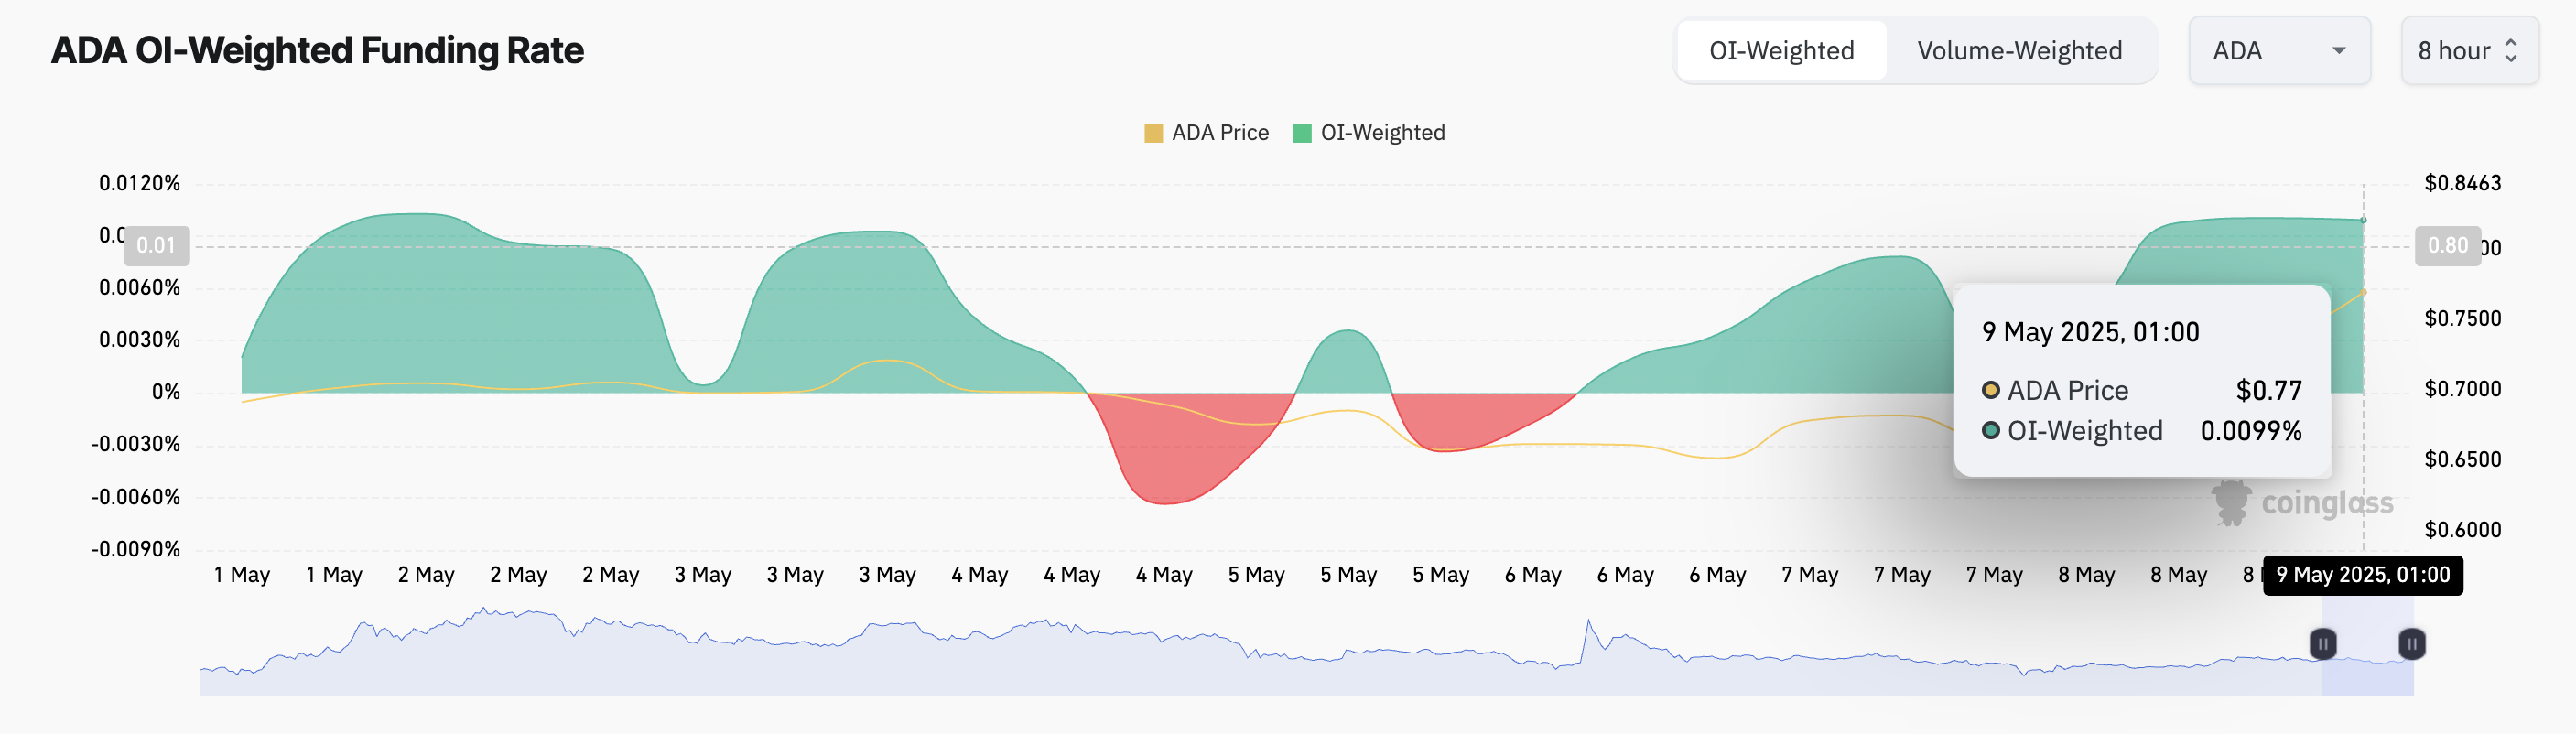
Moreover, in the ADA derivatives market, the coin’s funding rate remains firmly positive, indicating that traders are increasingly taking long positions in anticipation of continued gains. This is currently at 0.0099%.
The funding rate is a recurring payment between traders in perpetual futures contracts, designed to keep the contract price aligned with the spot market.
When positive like this, traders holding long positions are paying those with shorts, indicating bullish sentiment and expectations of further price increases.
ADA Rally Gains Steam, but Profit-Taking Could Threaten $0.76 Support
With technical indicators flashing bullish and sentiment strengthening, ADA buyers have regained control, at least for now. If buying pressure strengthens and bull dominance remains, ADA could maintain its upward trend and rally to $0.84.
However, once buyers’ exhaustion sets in and traders begin to lock in their soaring profits, ADA could break below the support at $0.76 and fall toward $0.66.
ENA, the native token of the Ethereum-based synthetic dollar protocol Ethena, is today’s top-performing crypto asset. Currently trading at $0.60, its price is up by 11% over the past day.
This rally follows a sharp rise in the circulating supply of USDe, Ethena’s synthetic dollar-pegged stablecoin. With aligning bullish technical indicators, ENA appears poised to keep climbing in the short term.
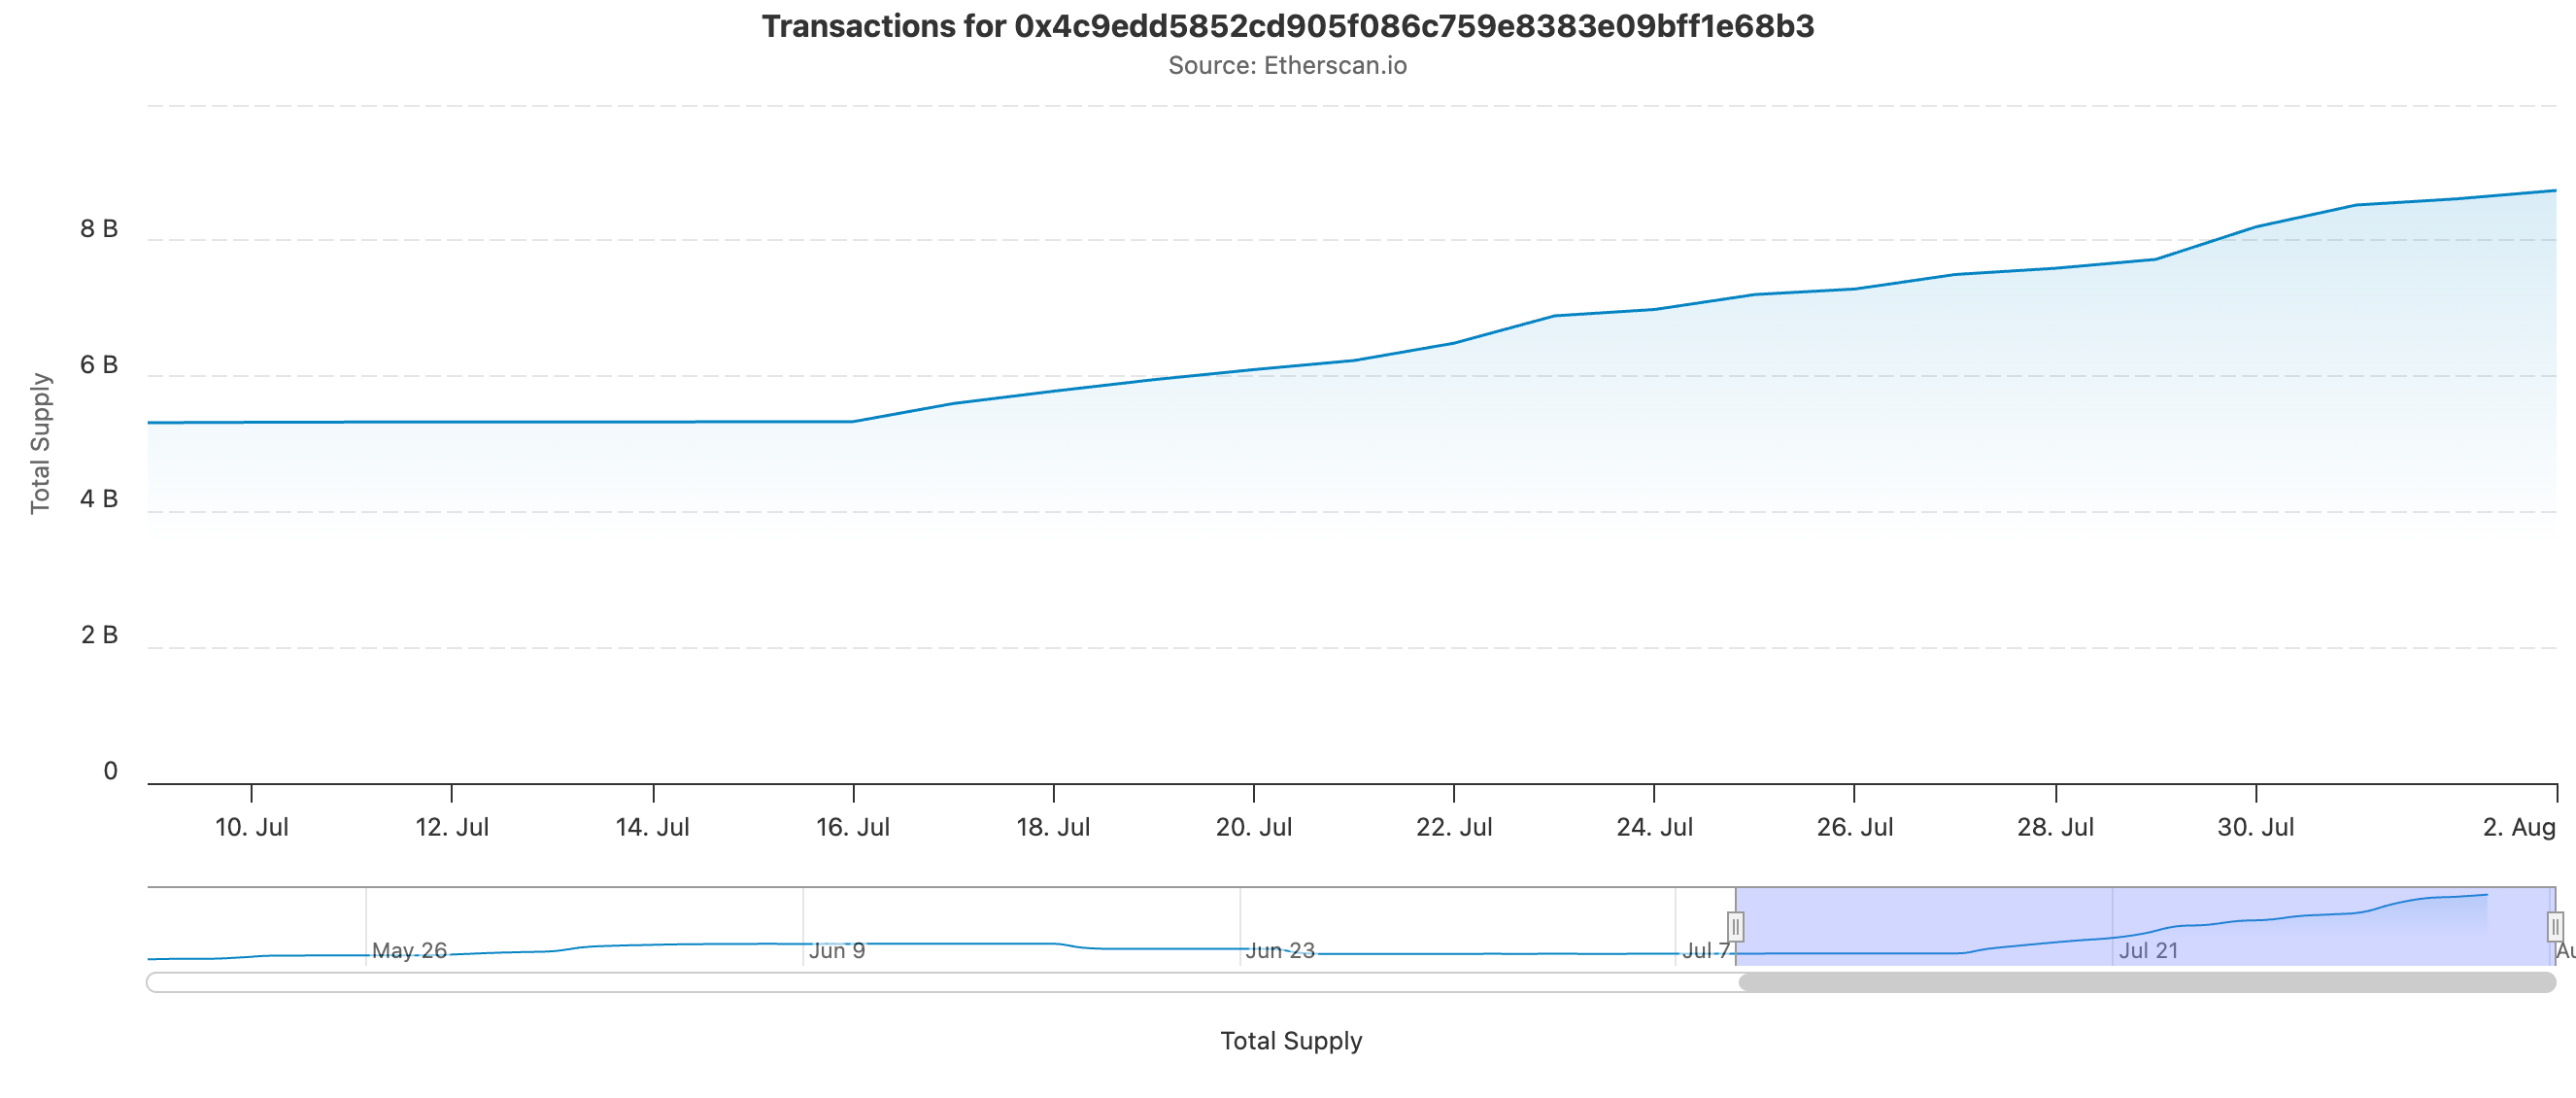
ENA Surges as USDe Supply Hits Record $8.73 Billion
According to data from Etherscan, USDe’s circulating supply is at an all-time high of $8.73 billion, up more than $3.4 billion since July 16.
For token TA and market updates: Want more token insights like this? Sign up for Editor Harsh Notariya’s Daily Crypto Newsletter here.
This increase reflects the growing user adoption and increased capital inflows into the protocol as more investors seek stable, yield-generating dollar exposure.
The uptick in stablecoin supply has boosted the positive sentiment around ENA even as broader market conditions remain uncertain and volatile. Its price is up by double digits today, with key technical indicators pointing to increasing bullish momentum.
ENA’s Momentum Builds Despite Recent Dip
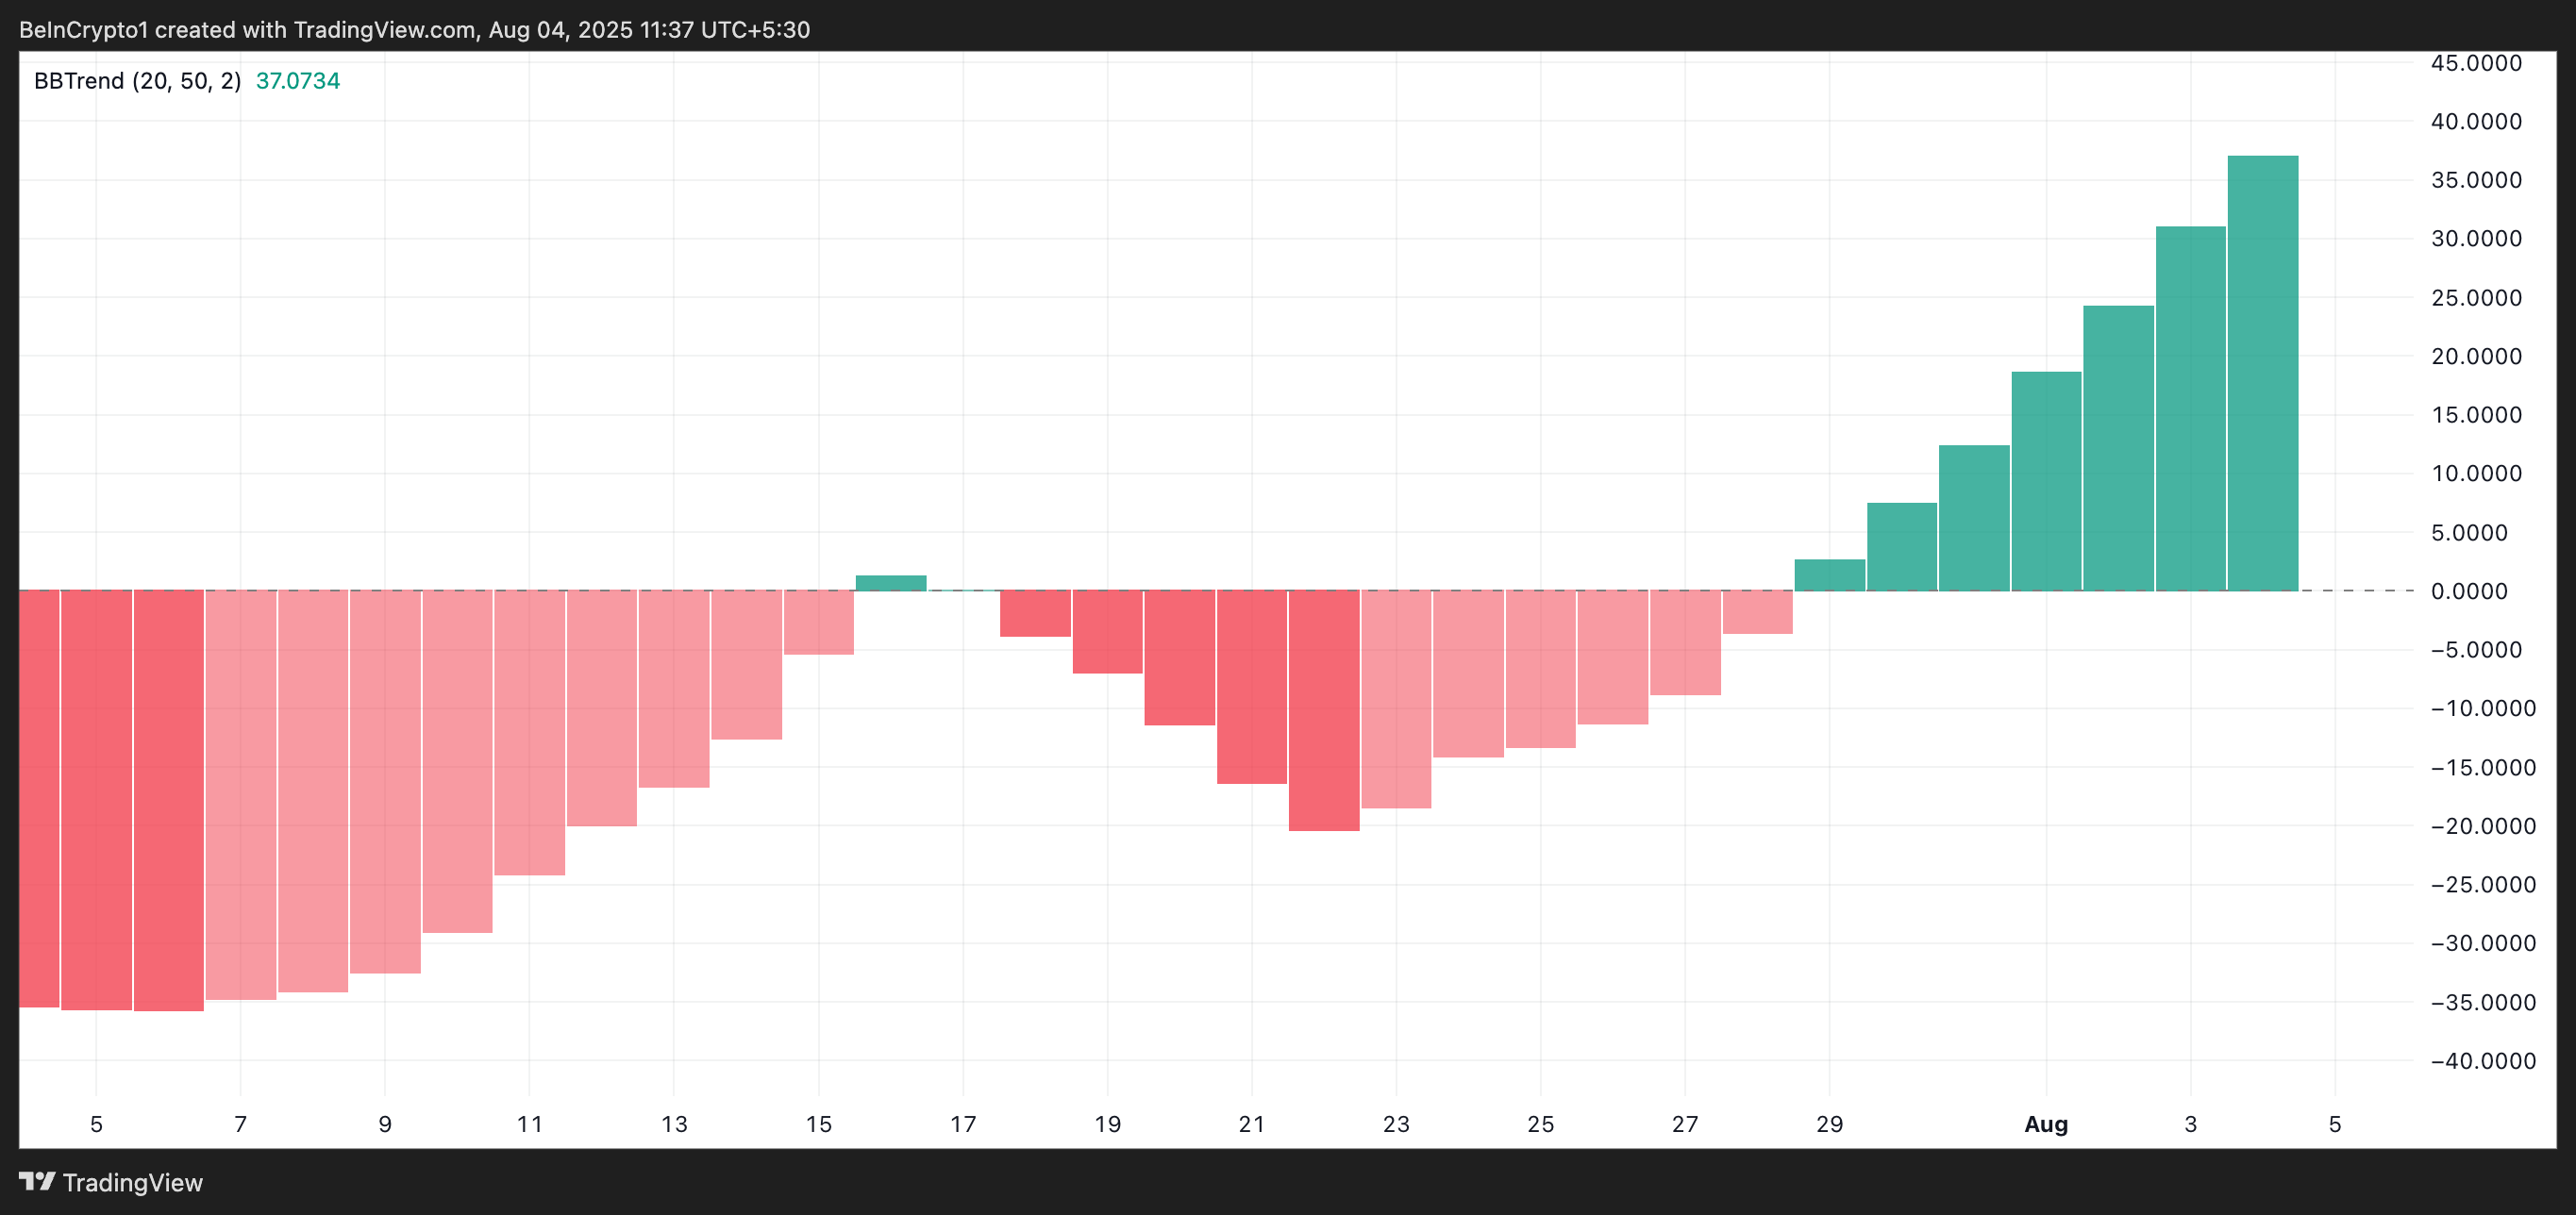
Technical readings from the ENA/USD one-day chart reveal that the token’s BBTrend (Bollinger Band Trend) indicator has printed a series of green bars that have grown steadily in size since June 29.
This steady build-up has occurred even as ENA’s price has experienced a downward trajectory over the past week. For context, today’s rally marks the most significant price improvement the token has seen in that period, indicating a potential reversal.
When BBTrend bars expand while prices consolidate, it reflects latent bullish pressure that eventually surfaces. If this momentum holds, ENA may be poised for further gains in the coming sessions.
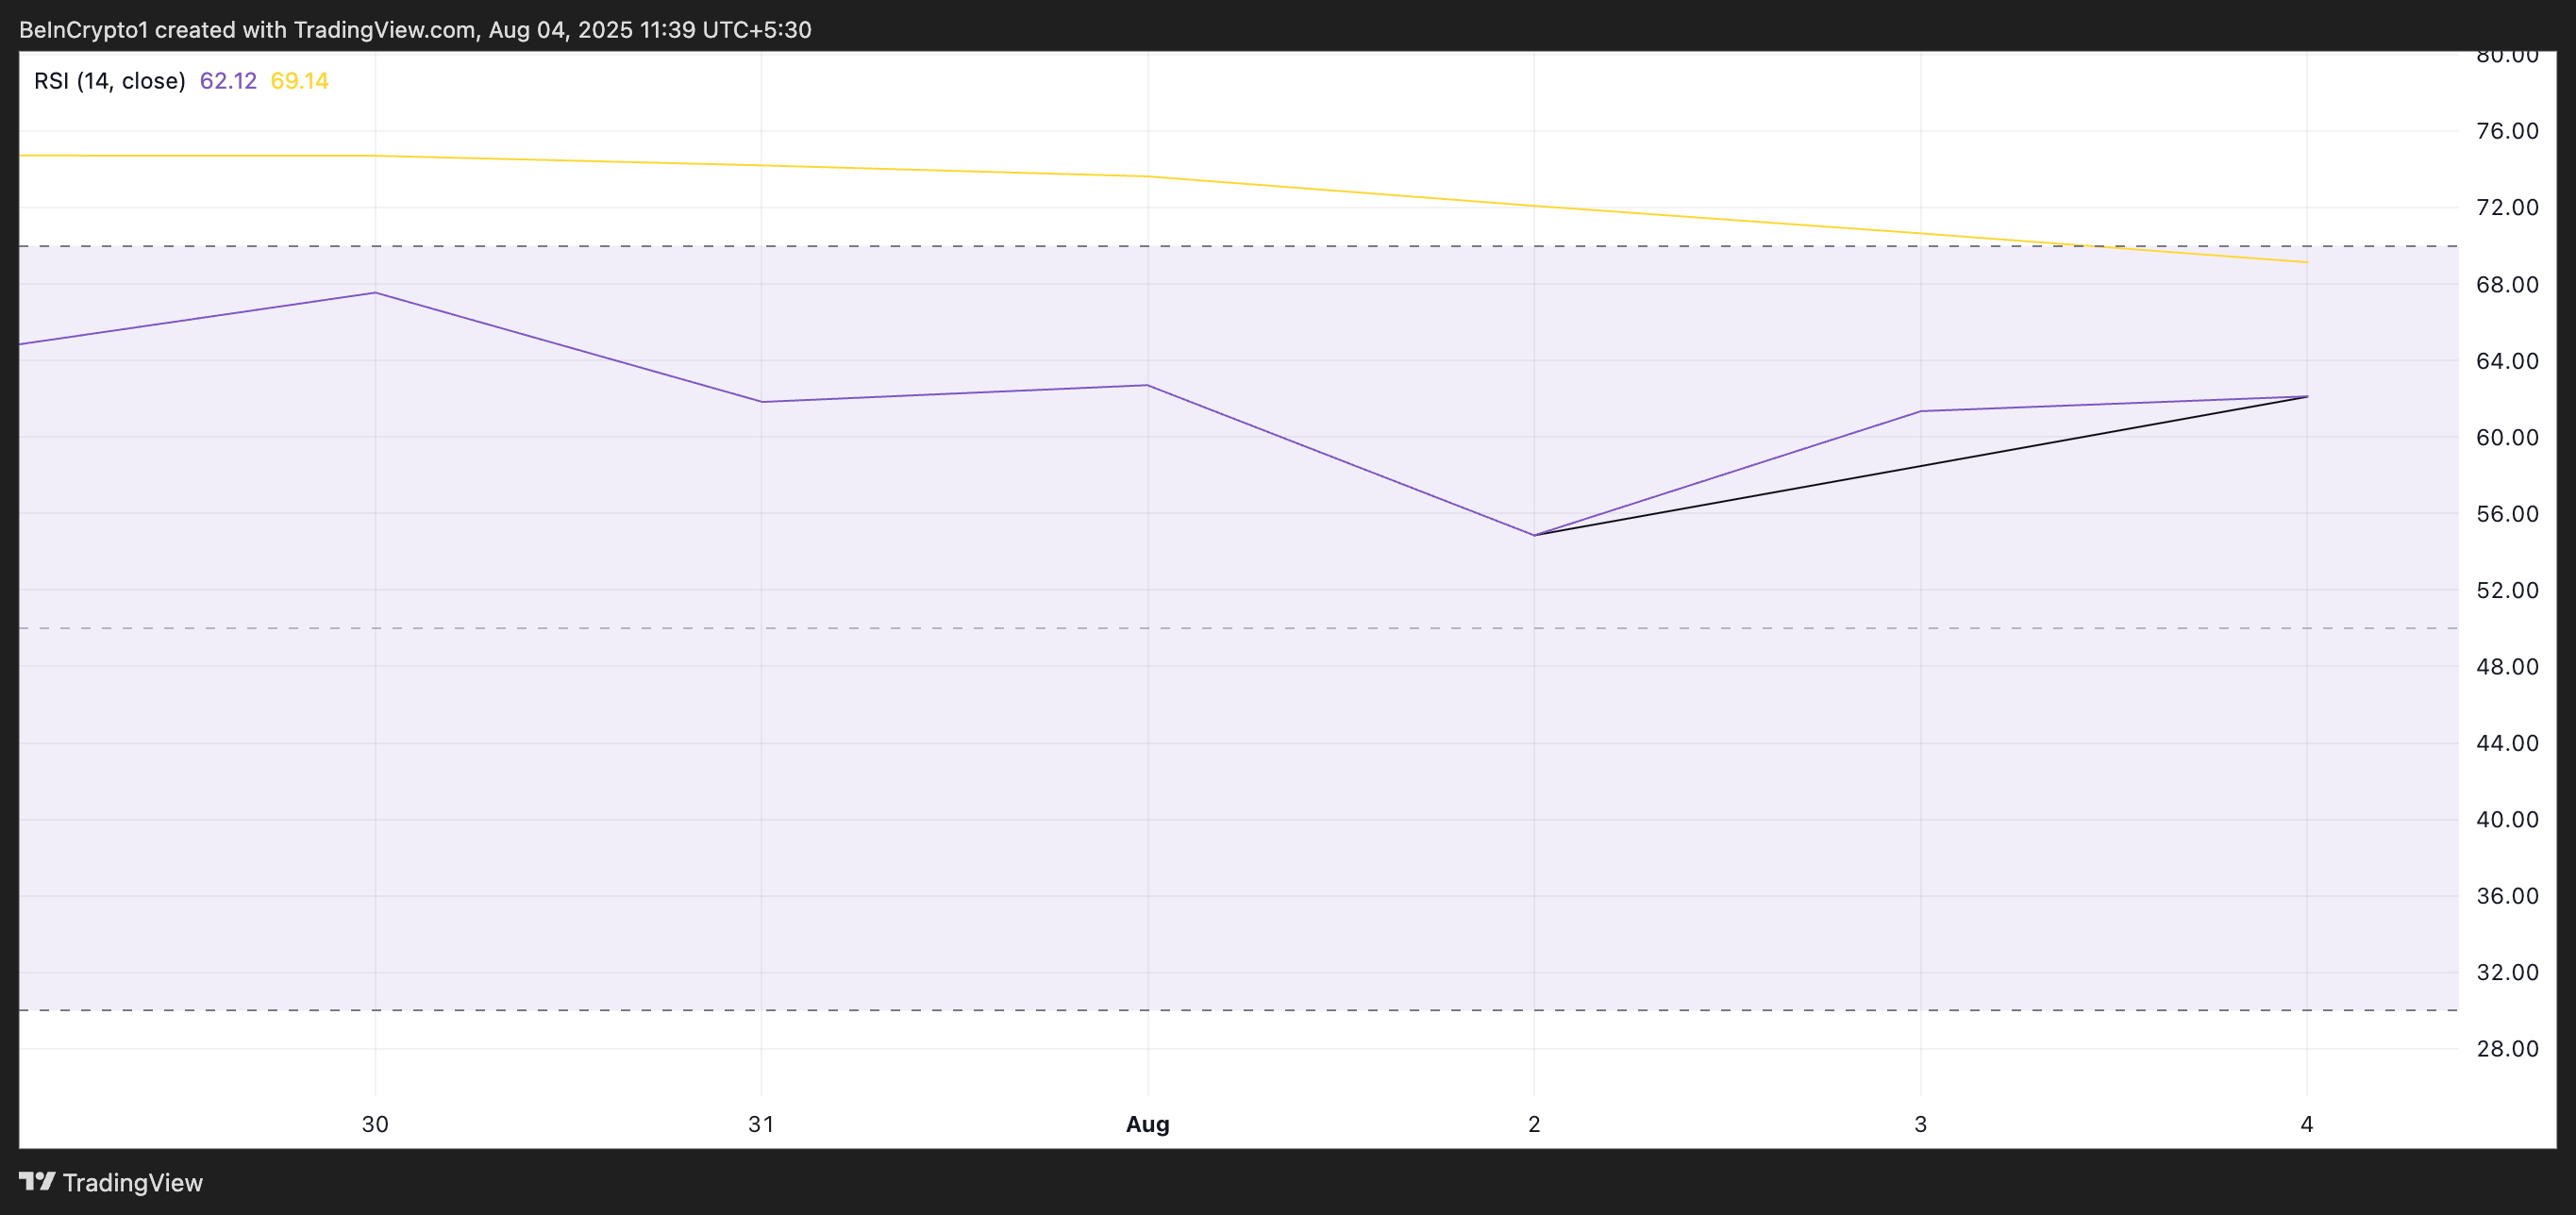
Moreover, the token’s Relative Strength Index (RSI) confirms this bullish outlook. As of this writing, this momentum indicator is at 62.12 and is in an uptrend.
The RSI indicator measures an asset’s overbought and oversold market conditions. It ranges between 0 and 100. Values above 70 suggest that the asset is overbought and due for a price decline, while values under 30 indicate that the asset is oversold and may witness a rebound.
ENA’s RSI readings indicate market participants prefer accumulation over distribution. If this trend continues, its price could keep rising in the short term.
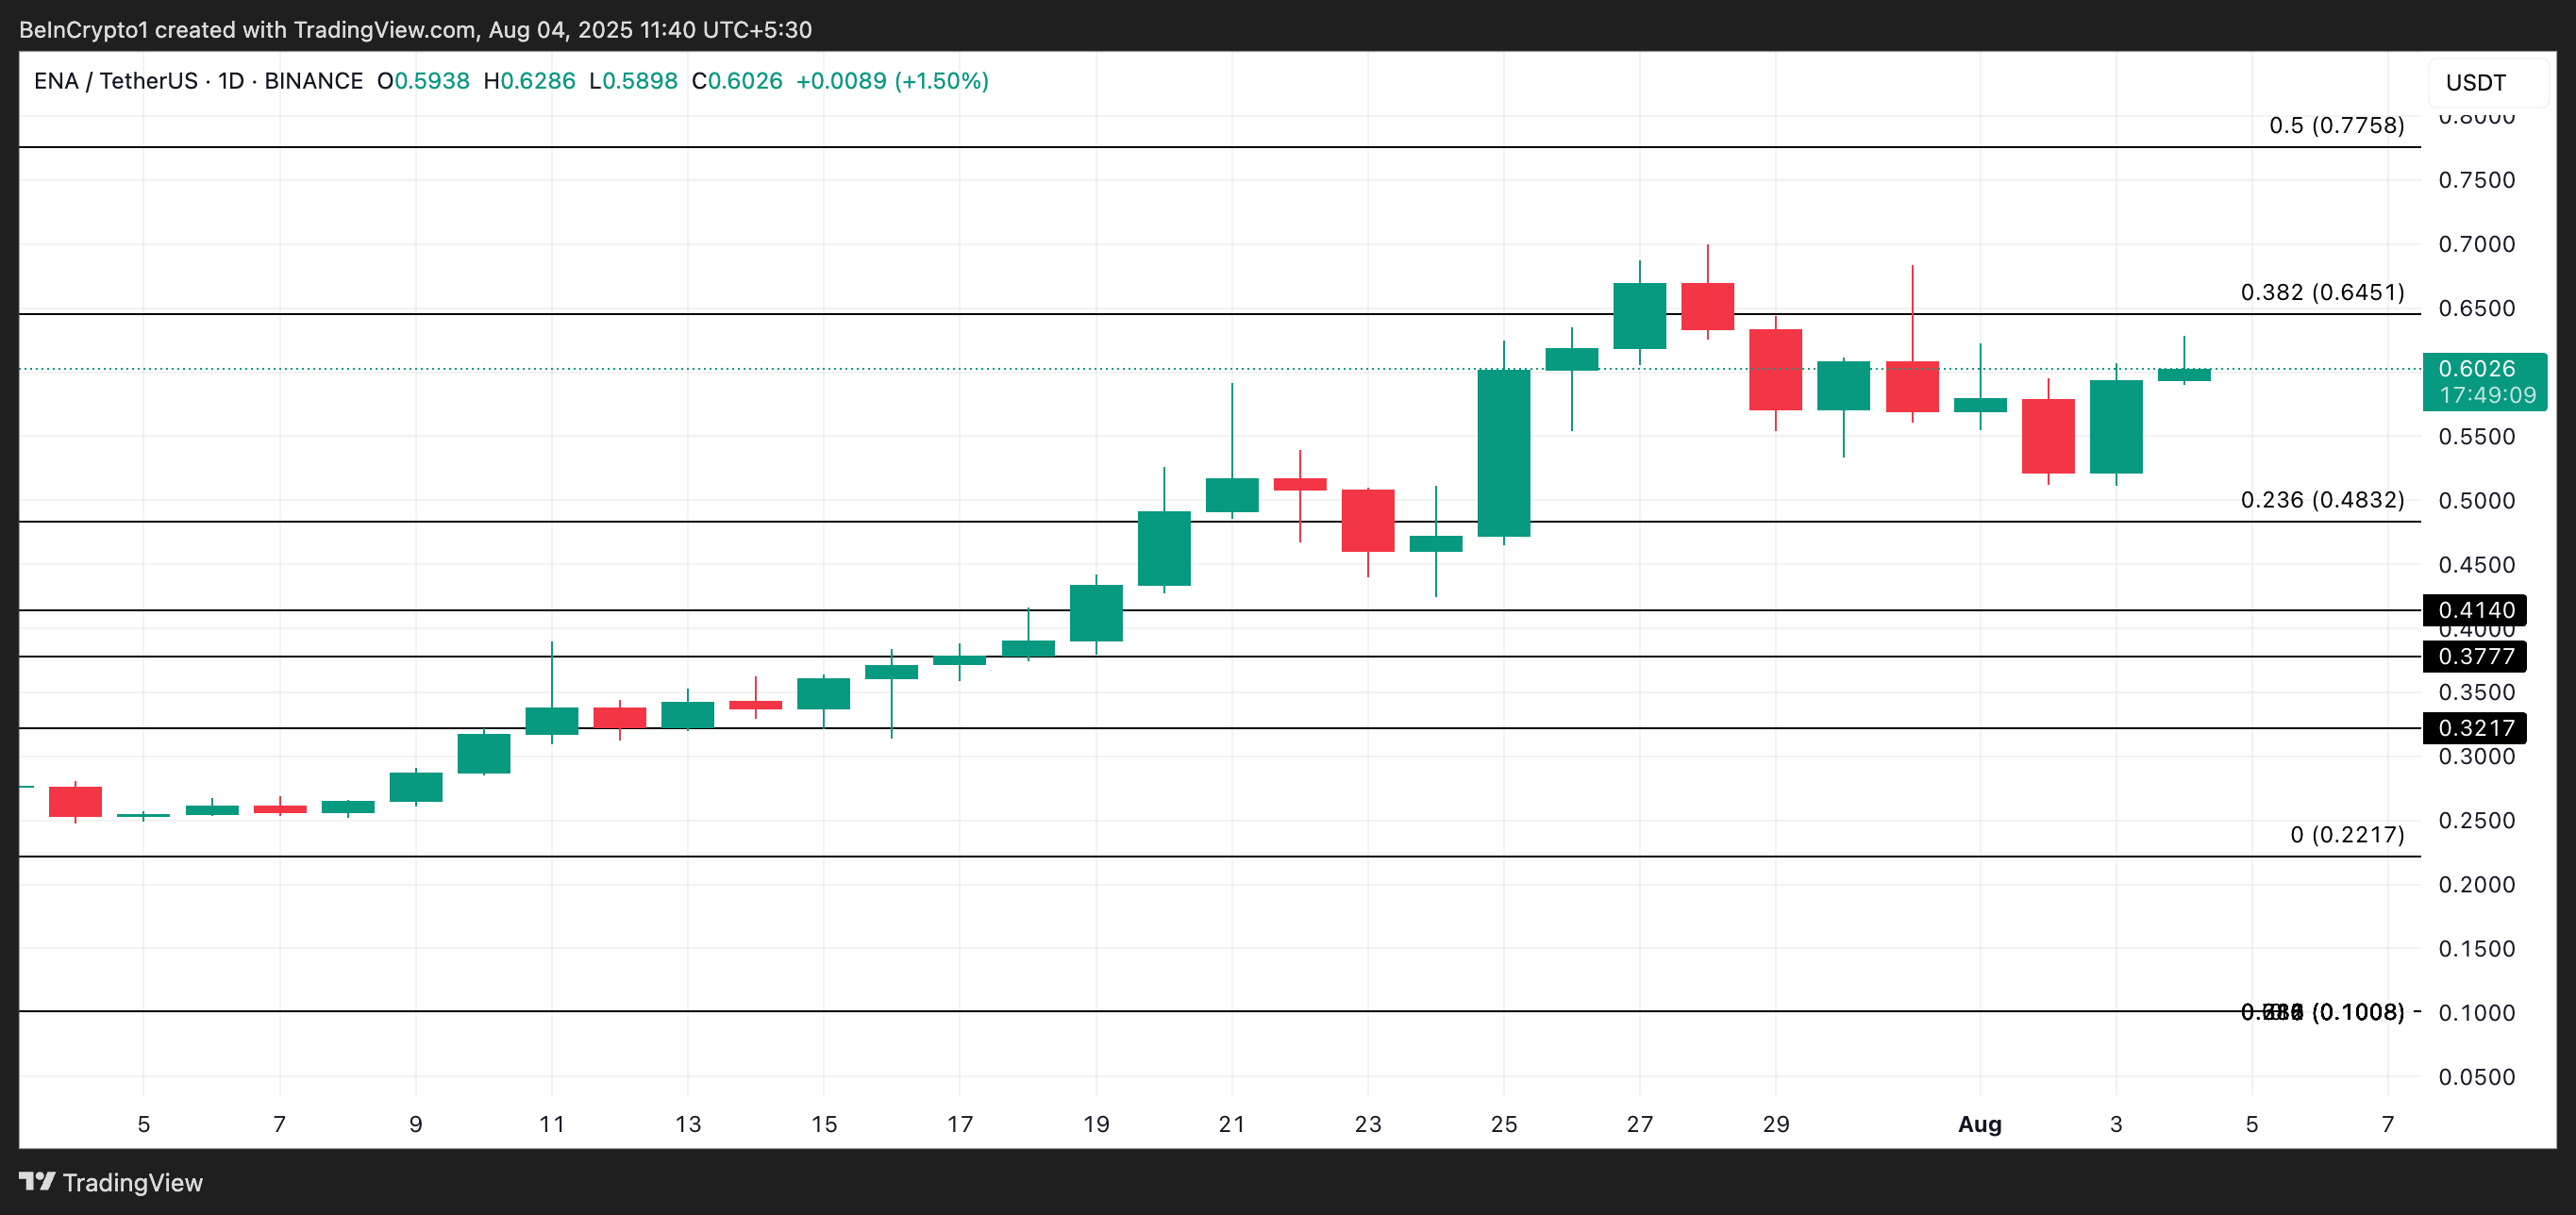
ENA Bulls Target $0.77—But Can They Overcome This Crucial Wall?
At its current price, ENA holds just below a key resistance level at $0.64. This critical price point could determine the altcoin’s next move.
If bullish momentum intensifies and buy-side pressure continues to build, a breakout above this level could propel ENA toward the next major resistance around $0.77.
Several experienced investors suggest it may be time for altcoin traders to shift their mindset rather than wait for market conditions to improve. Half of 2025 has already passed, and nothing guarantees the second half will be easier.
Meanwhile, the buy-and-hold approach for altcoins has failed as Bitcoin Dominance (BTC.D) has risen for two consecutive years.
Why Shifting From Buy-and-Hold to Disciplined Trading
Facing widespread losses among altcoin traders, Stockmoney Lizards, a well-known investor on X, shared a straightforward strategy designed for those with limited experience. Named the “Low-IQ Altcoin Strategy,” it consists of four main steps.
Choose reputable altcoins: Focus on coins that have proven resilient over multiple market cycles, such as SOL, ADA, or ETH. These coins usually have stronger foundations and lower risk than new, smaller projects.
Allocate capital carefully: Divide trading capital into five equal parts to spread risk across different buying points.
Define clear entry points: Enter positions when the daily RSI drops below 30 (an oversold signal). Continue adding after each further 10% price drop from the last purchase.
Set strict exit points: Exit the entire position once profits reach 30–50%. Avoid hesitation or waiting for even higher gains, as altcoin markets remain highly volatile and vulnerable to sudden moves by whales.
Stockmoney Lizards emphasized that this method does not promise quick wealth but aims to help traders avoid losing everything, like most altcoin investors. The recommendation includes reinvesting half of the profits into stablecoins and the other half into Bitcoin for long-term accumulation.
“You won’t get rich quick. But you also won’t lose everything like 99% of altcoin traders do…This boring strategy is exactly how I survived my early trading days,” Stockmoney Lizards noted.
Michaël van de Poppe, CIO and founder of MNFund, also highlighted a common mistake: many investors rush in to buy only when prices have already soared, which raises the risk of losses.
The disciplined method suggested by Stockmoney Lizards helps lower risk and reduce the FOMO mindset described by Michaël van de Poppe.
However, maintaining discipline can be challenging, as many traders still hope for rapid and large profits.
“Not the strategy most people in crypto believe in, but need to. They want that Lambo yesterday,” another investor on X commented.
Will Altcoin Season Arrive in H2 2025?
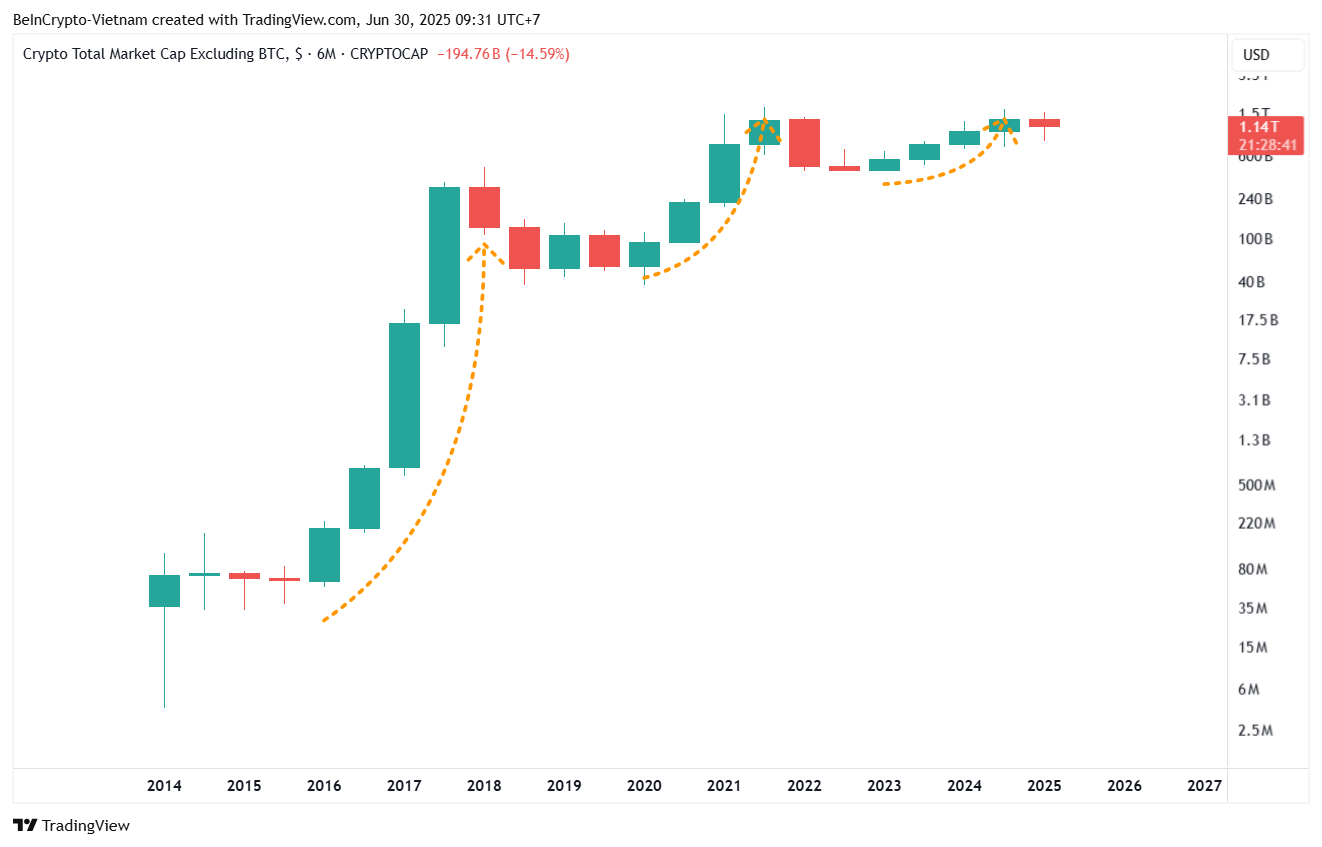
A recent BeInCrypto report identified signs that the altcoin winter may continue. Analysis of the altcoin market cap (TOTAL2) on a six-month chart shows that TOTAL2 has completed four consecutive green candles and now appears to be entering a red candle phase.
Total MarketCap Excluding BTC. Source: TradingView
In previous cycles, four green six-month candles typically ended with two red candles, suggesting that the second half of 2025 could remain challenging for altcoins.
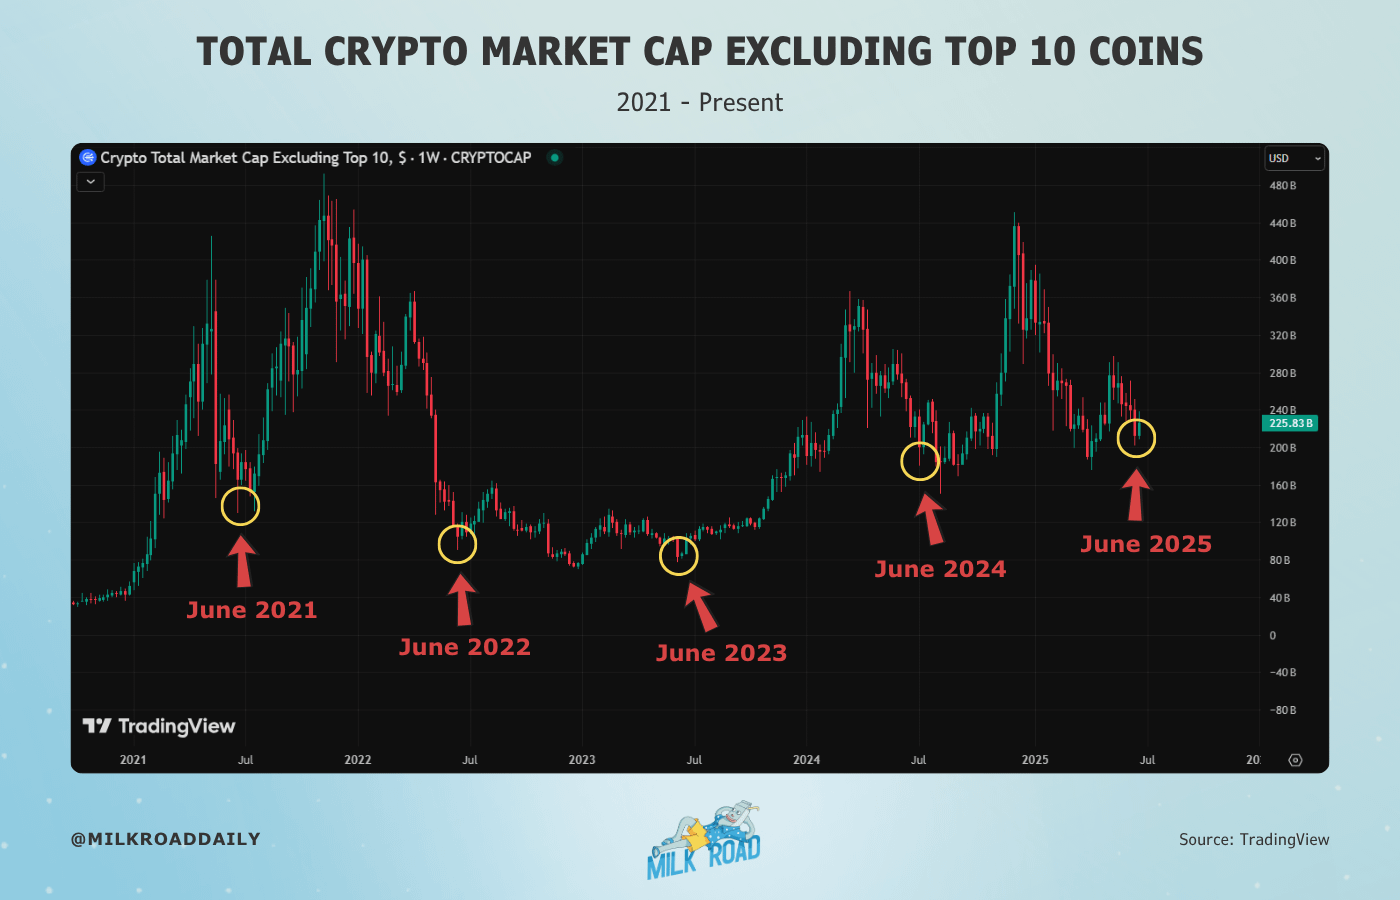
However, investor Milk Road observed a more optimistic historical pattern: the market cap bottom for altcoins excluding the top 10 often forms in June each year.
Crypto Total Market Cap Excluding TOP 10. Source: Milk Road
“Every June since 2021 has marked a key turning point in the altcoin market… And June 2025 could be following the same script,” Milk Road observed.
This perspective is supported by other investors who hope the altcoin market cap could reach new highs in late 2025.
Conflicting signals from different data models add uncertainty to forecasts for H2 2025. At the same time, Bitcoin Dominance (BTC.D), which typically needs to decline to signal an altcoin season, remains above 65%, its highest level since February 2021, with no signs of retreat.
Altcoin investors remain divided. Some try to adjust expectations and strategies after previous losses, while others continue to wait for significant returns to justify years of holding.
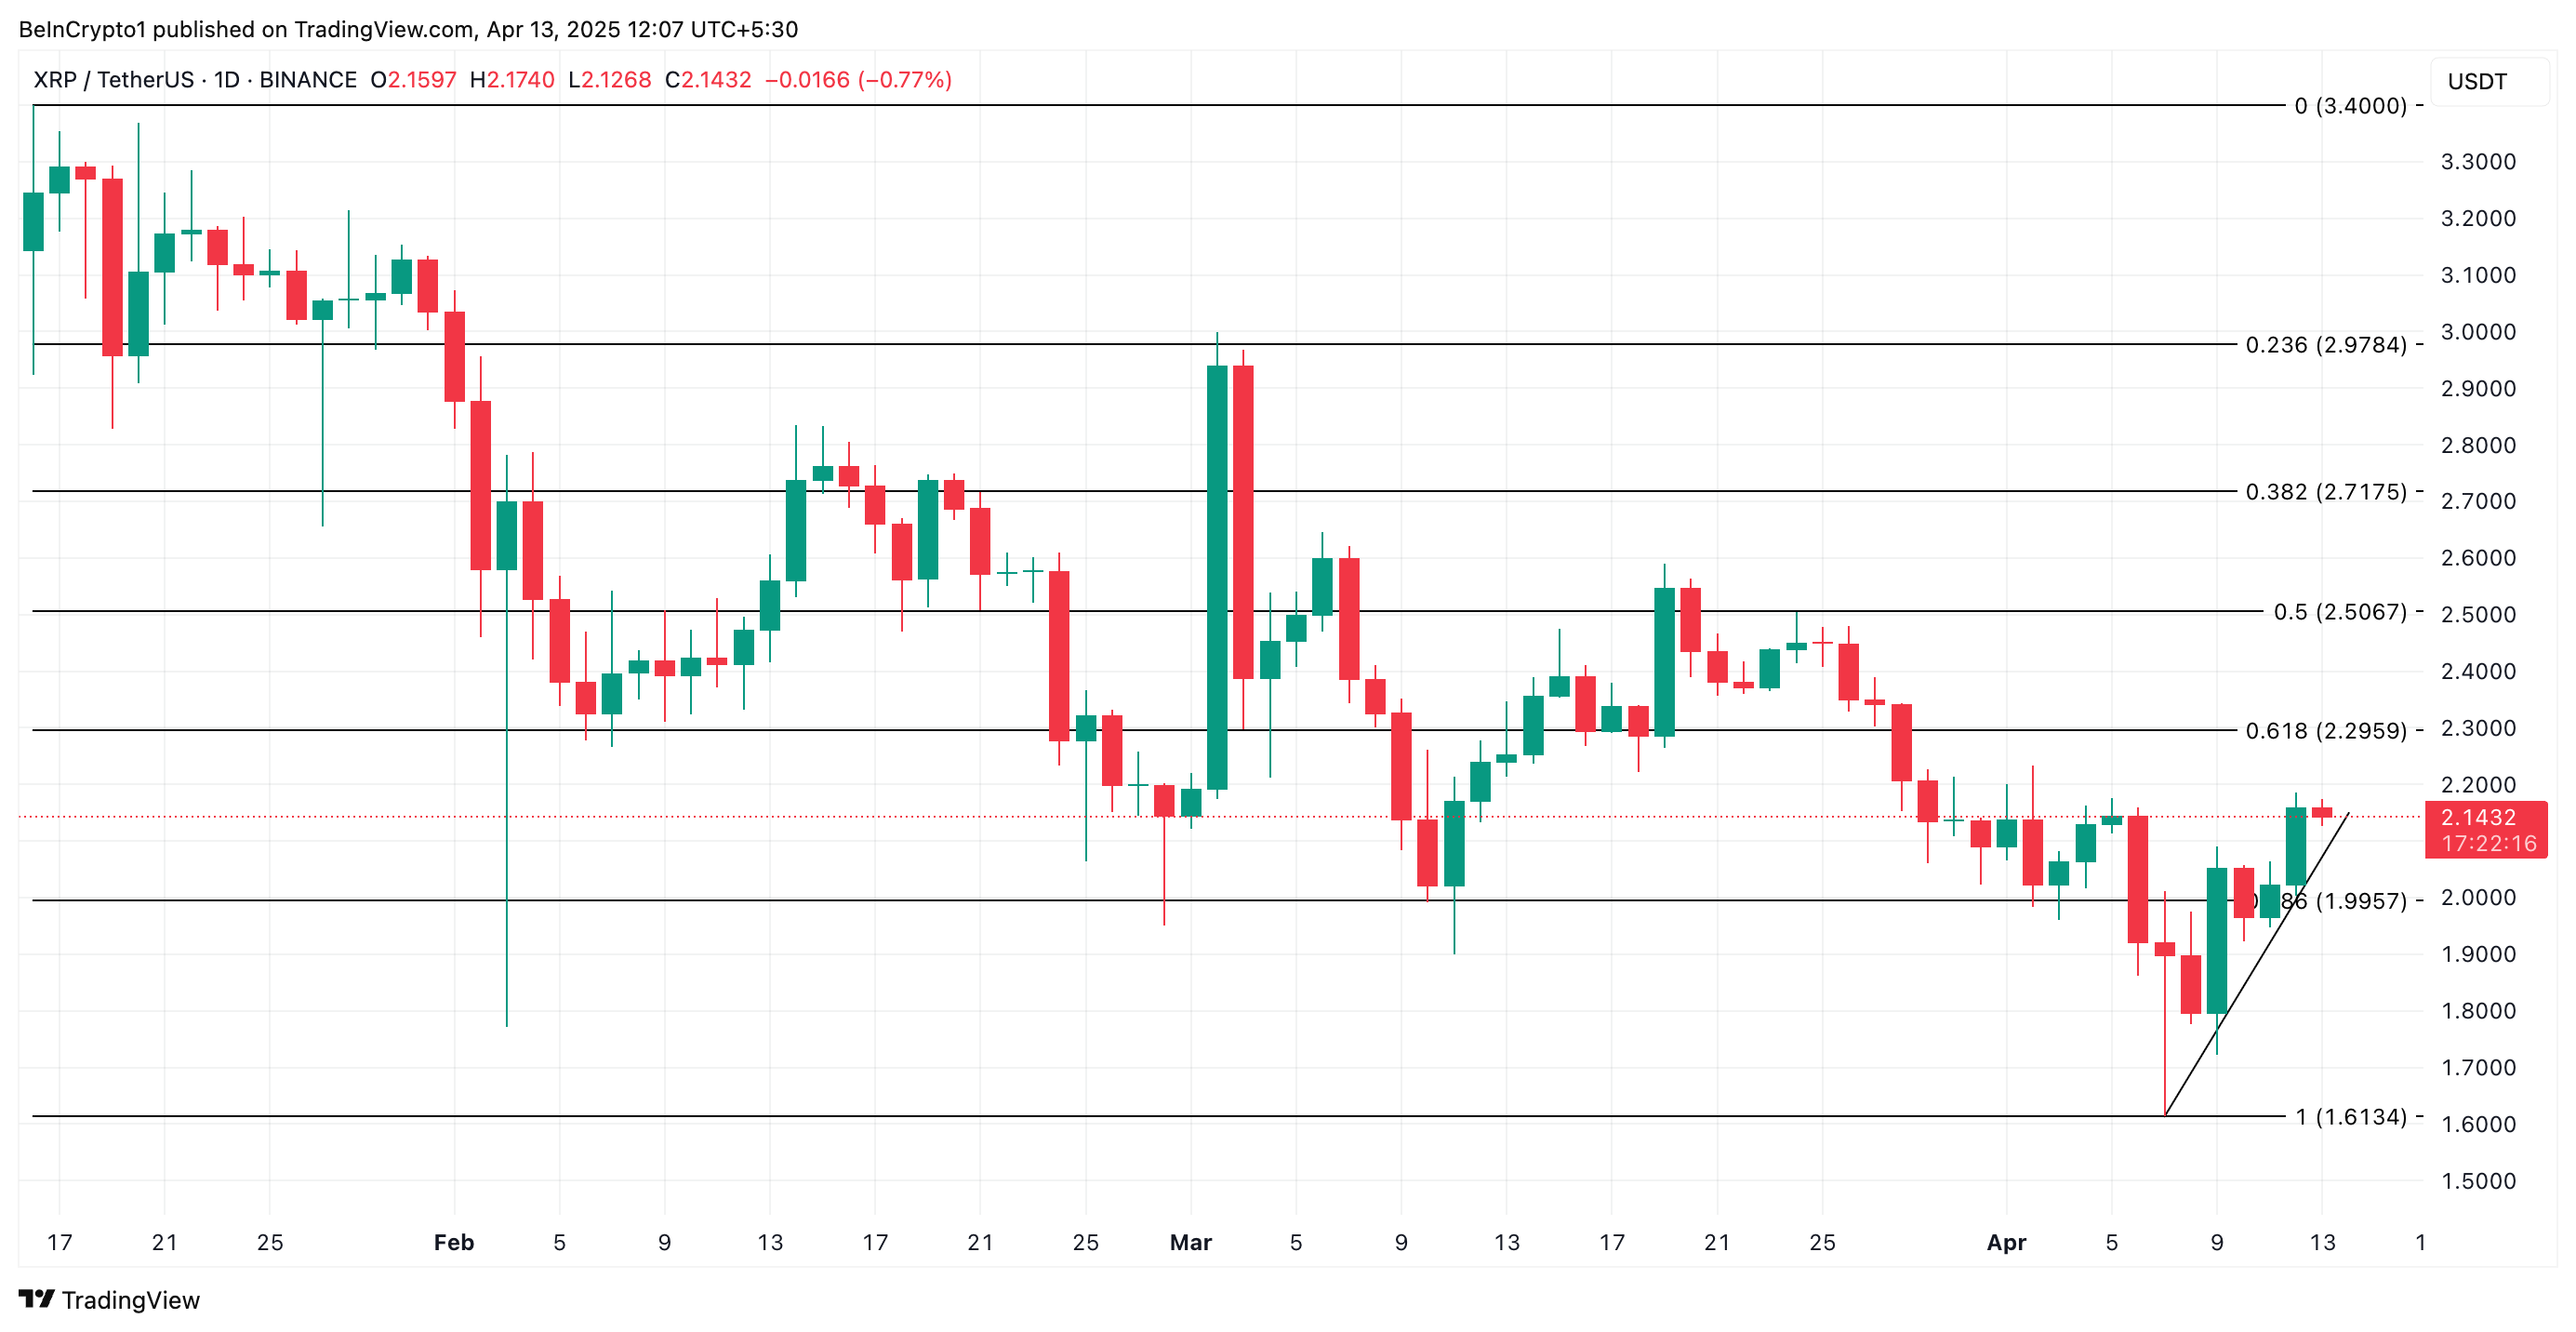
Since plunging to its year-to-date low of $1.61 on April 7, XRP holders have taken full advantage of the dip, ramping up accumulation efforts. This buying pressure has steadily increased the asset’s value over the past week.
At press time, XRP trades at a seven-day high of $2.19 and technical indicators show that it’s positioned to extend the gains.
XRP Golden Cross Drives Bullish Momentum
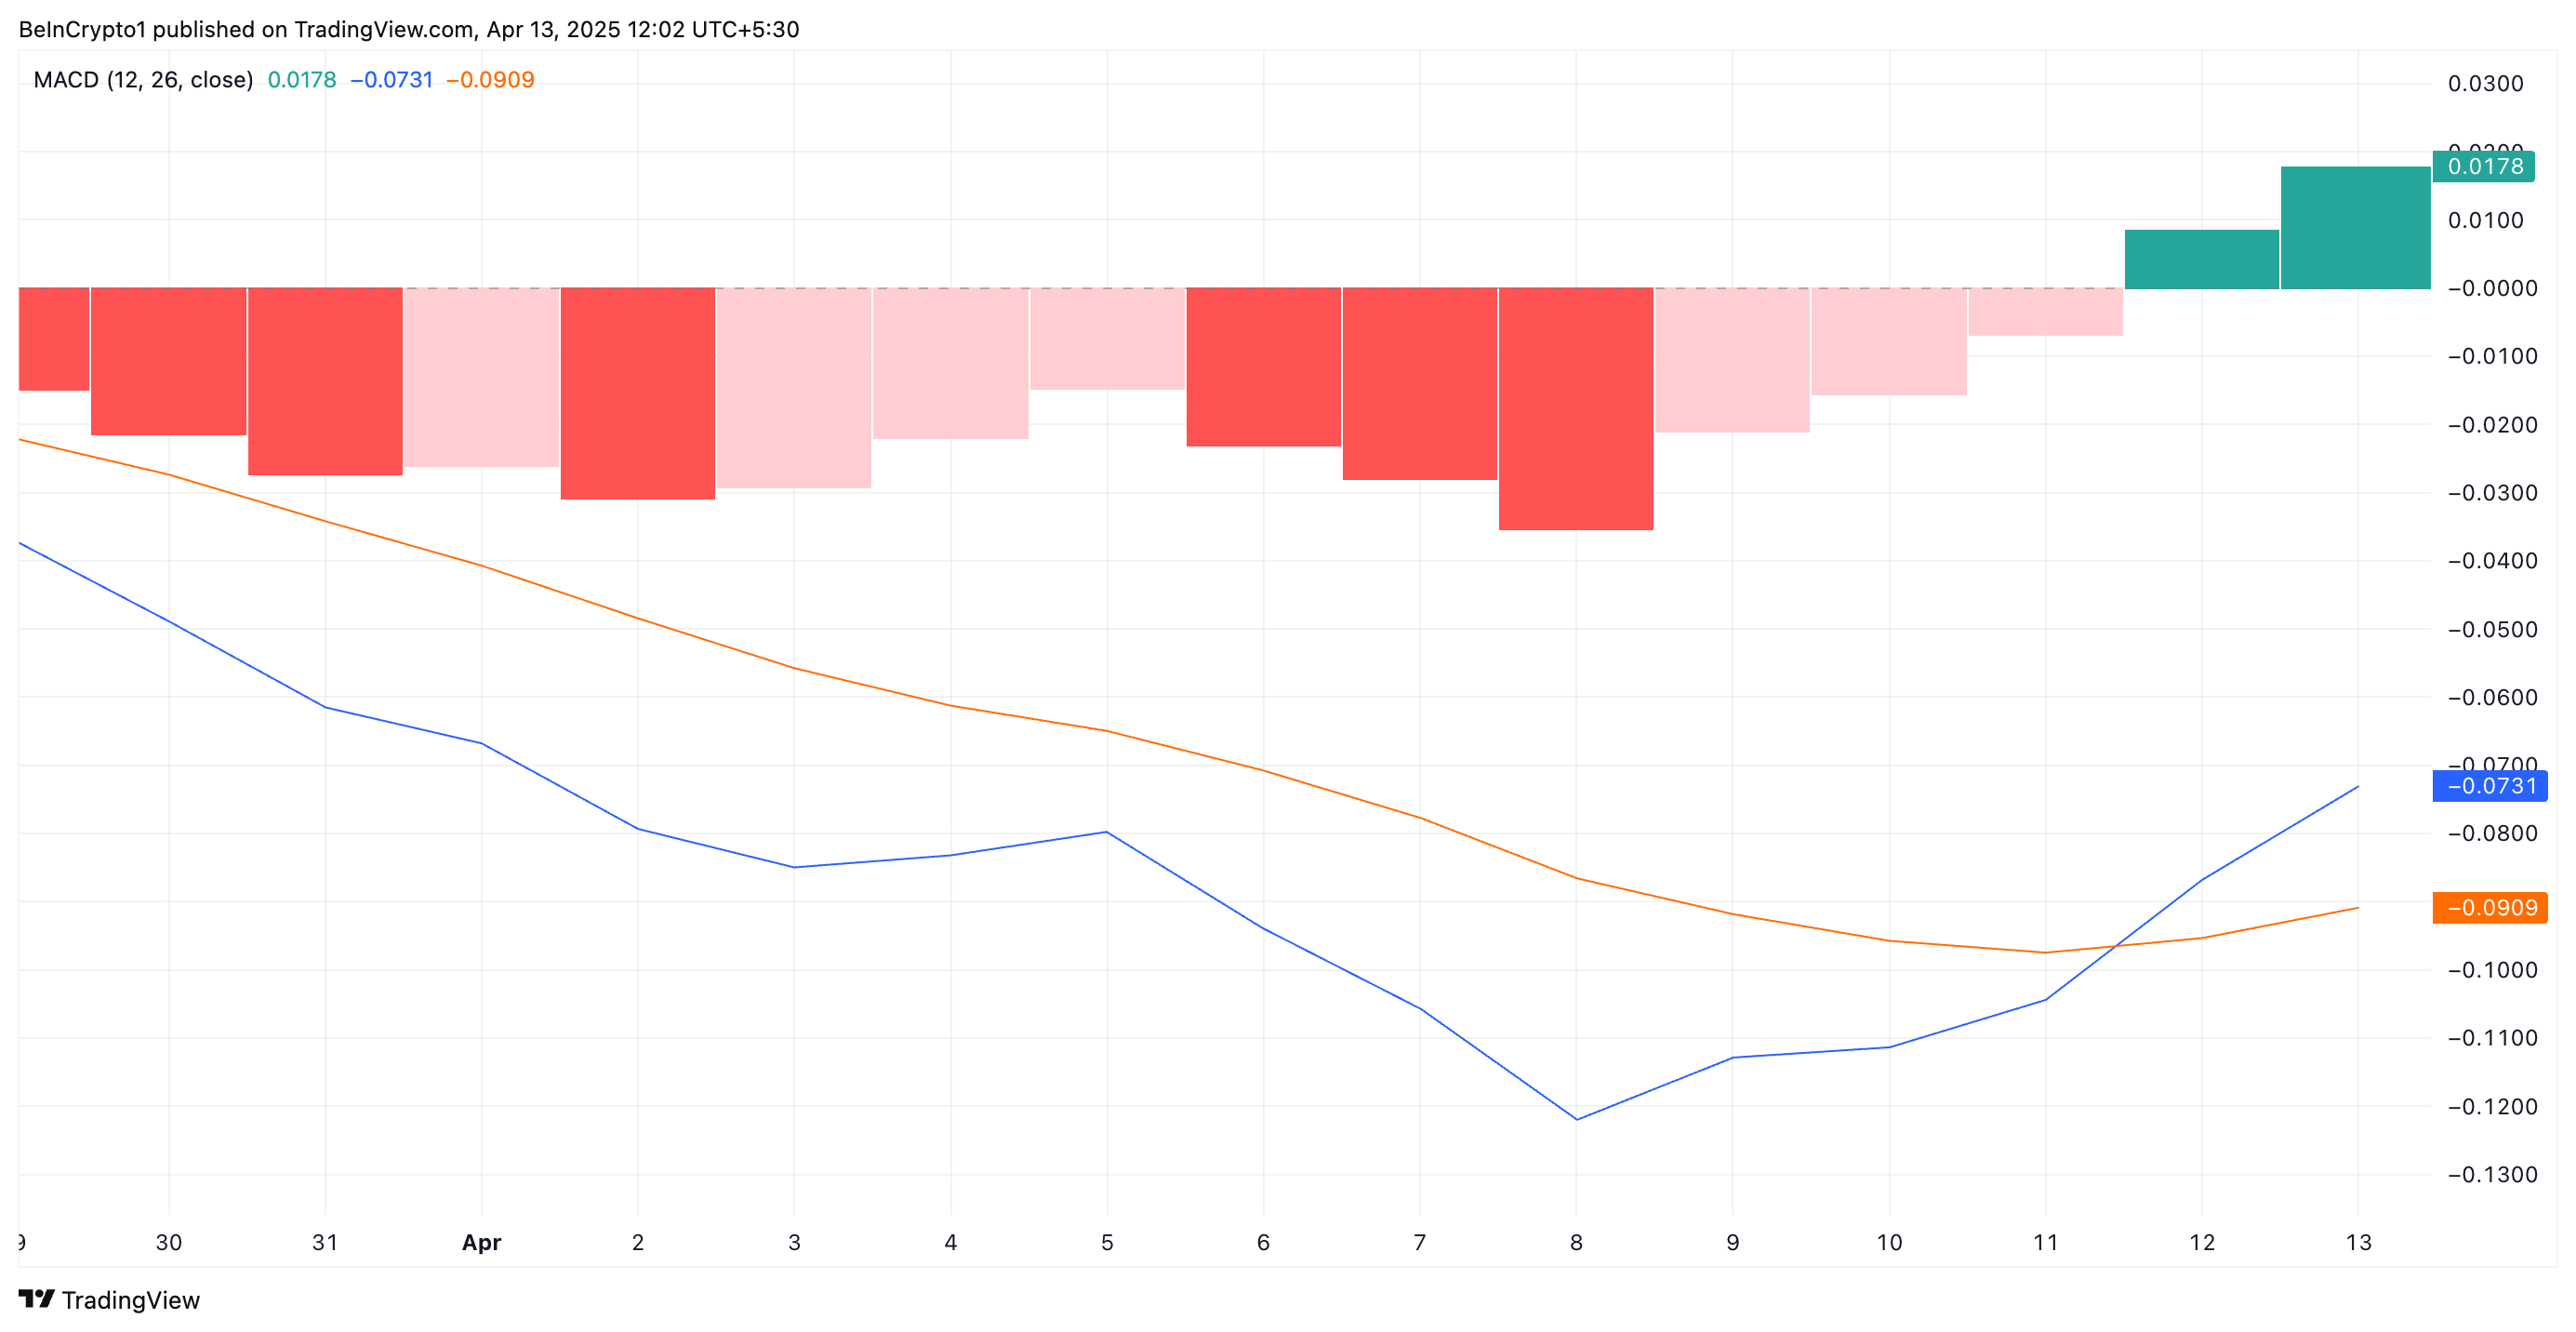
On the daily chart, a golden cross has formed on XRP’s Moving Average Convergence Divergence (MACD) indicator, which is often viewed as a key signal of a shift toward long-term upside.
When a golden cross emerges like this, it signals a positive shift in investor sentiment. Traders interpret it as a cue that buying pressure outpaces selling activity, which can attract even more inflows and drive the price higher.
For XRP, this golden cross occurred on April 11, reinforcing the growing bullish sentiment surrounding the asset. This pattern confirms that the altcoin’s recent price rebound is not just a short-lived reaction but may mark the beginning of a more sustained uptrend.
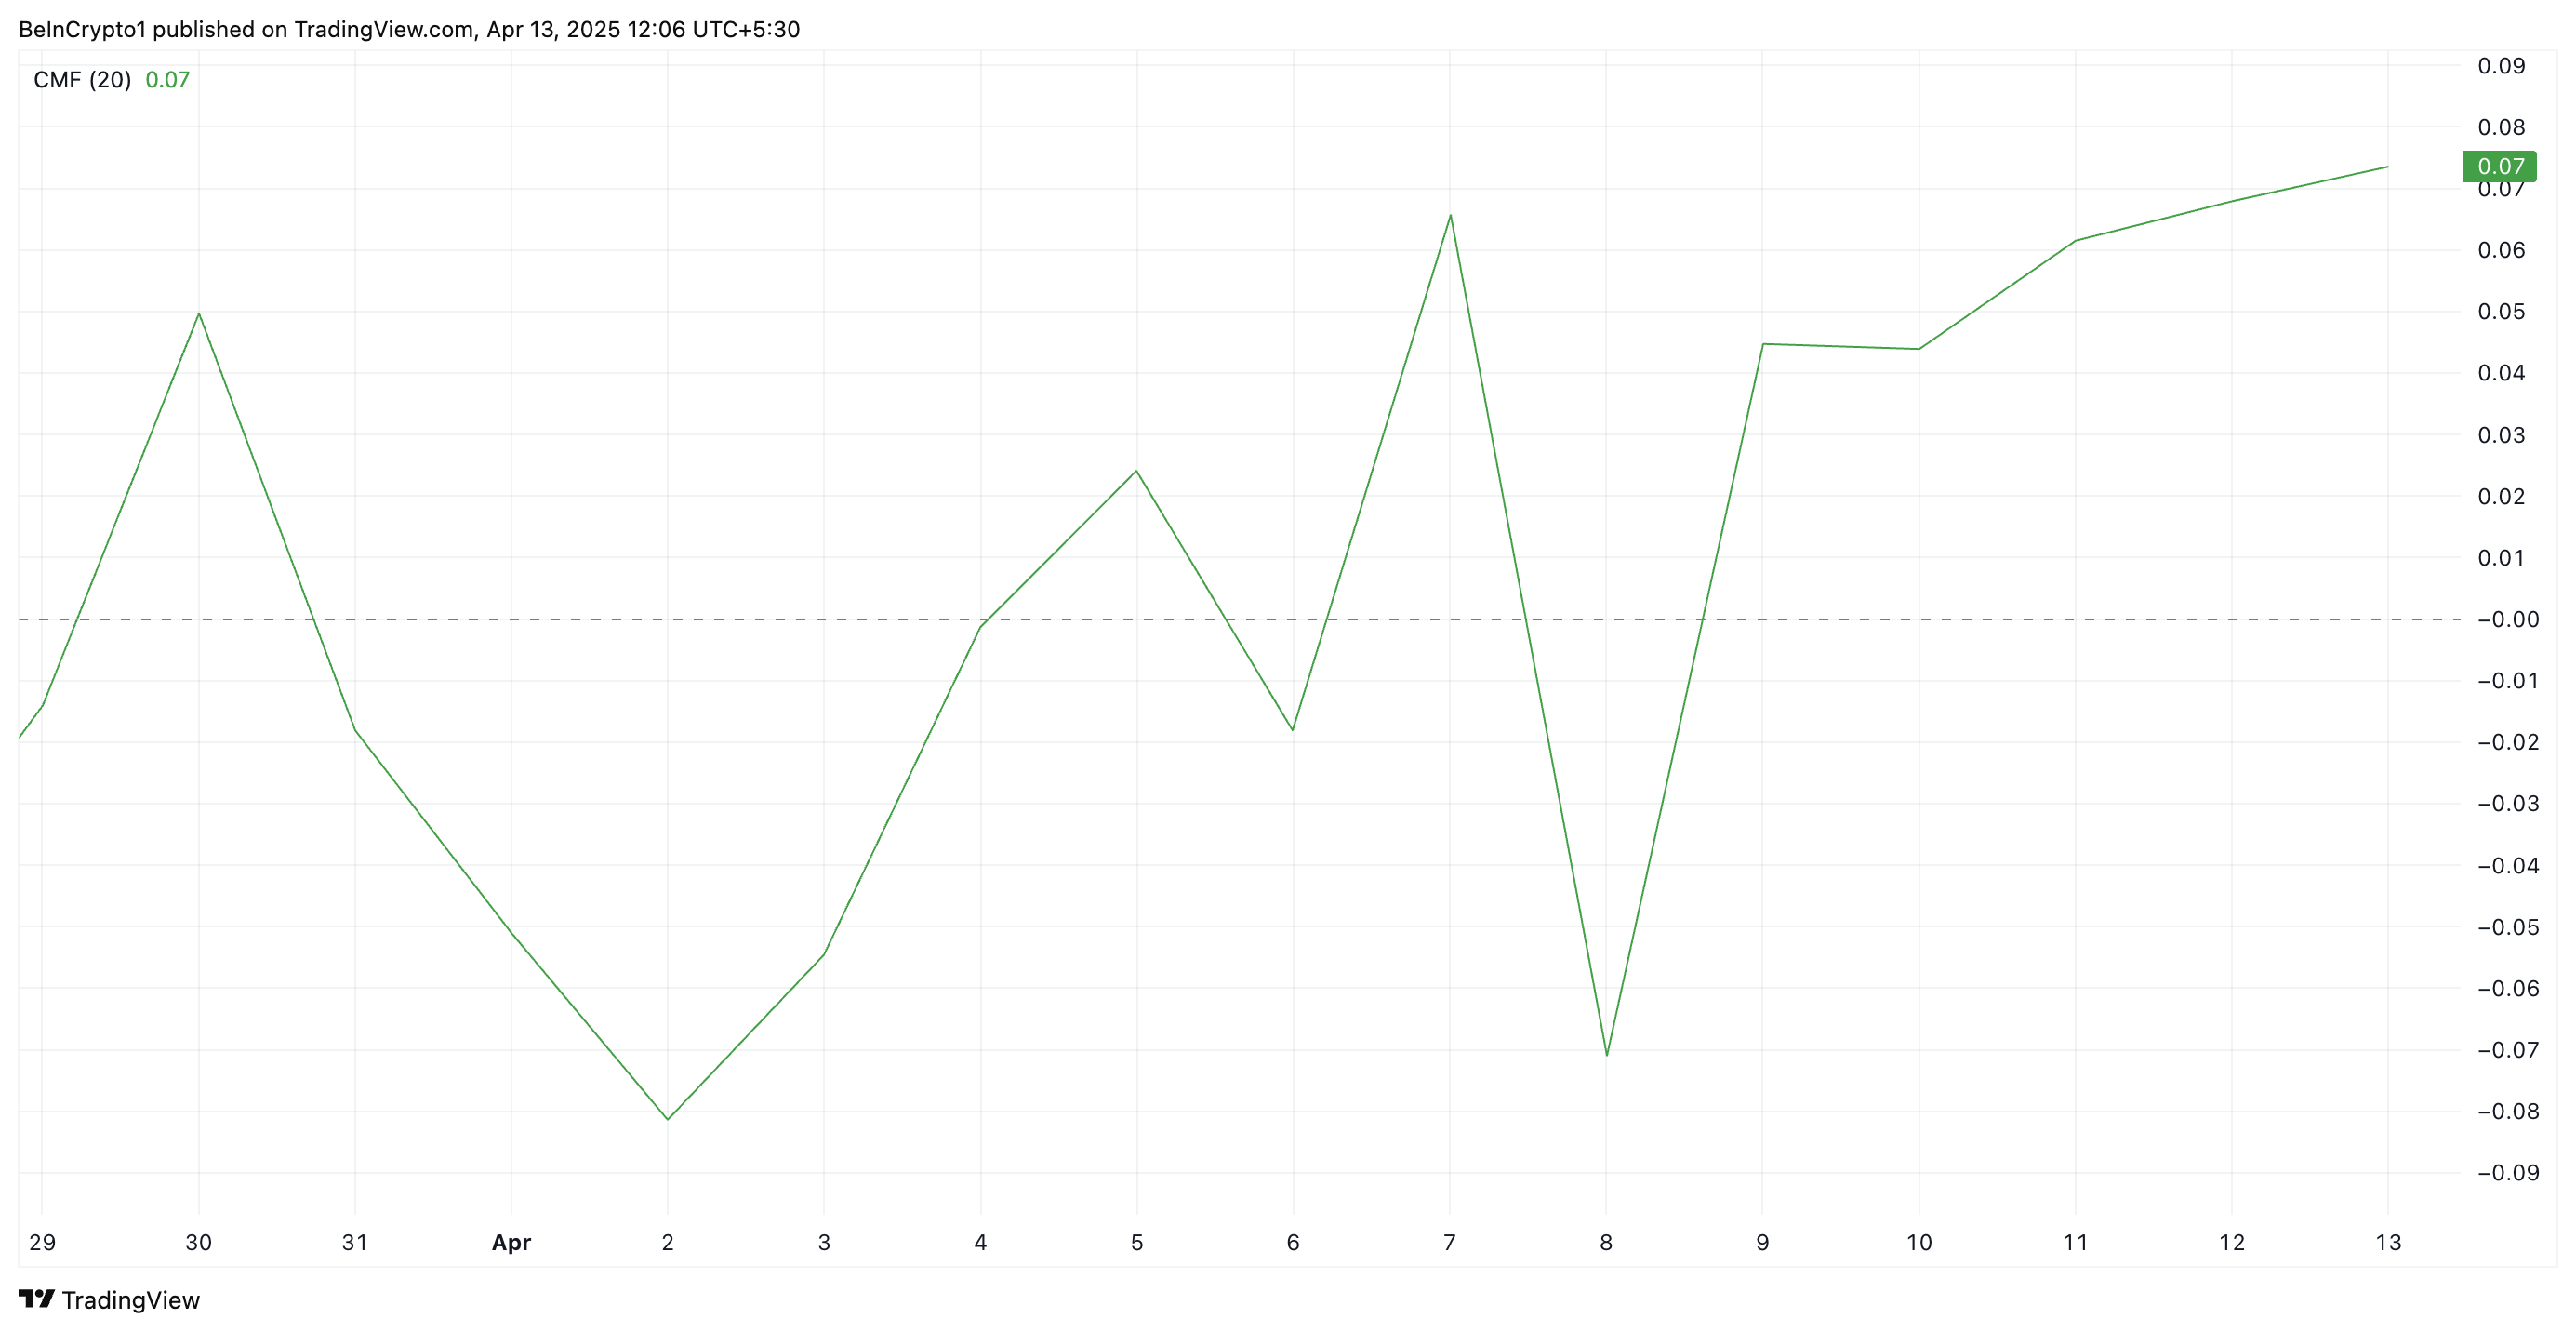
Further, the token’s positive Chaikin Money Flow (CMF) supports this bullish outlook. At press time, it rests above the center line and in an uptrend at 0.07.
The CMF indicator measures how money flows into and out of an asset. A positive CMF reading, as with XRP, means buying pressure is stronger than selling pressure over a given period. It suggests capital is flowing into the token, signaling accumulation and potential price growth.
XRP Maintains Uptrend—Next Stop: $2.50 or Back to $1.99?
Since its rally began on April 7, XRP has traded above an ascending trend line. This bullish pattern emerges when an asset forms higher lows over time, creating an upward-sloping support line.
It signals sustained buying interest in XRP and suggests that momentum is building in favor of the bulls as the token’s price continues to climb.
If demand soars, XRP could extend its gains and climb to $2.29. A successful flip of this resistance into a support floor could propel XRP to $2.50.