Cardano (ADA) is showing signs of life despite dropping 3% in the past 24 hours as traders weigh the possibility of a broader recovery. Technical indicators like BBTrend and DMI are flashing mixed signals, hinting that momentum may be fading after a brief surge.
ADA’s BBTrend has flipped into negative territory, while its DMI suggests bulls are gaining ground but haven’t fully taken control. With ADA hovering just above key support levels, the next few sessions will be crucial in determining whether this rally has legs or if another correction is around the corner.
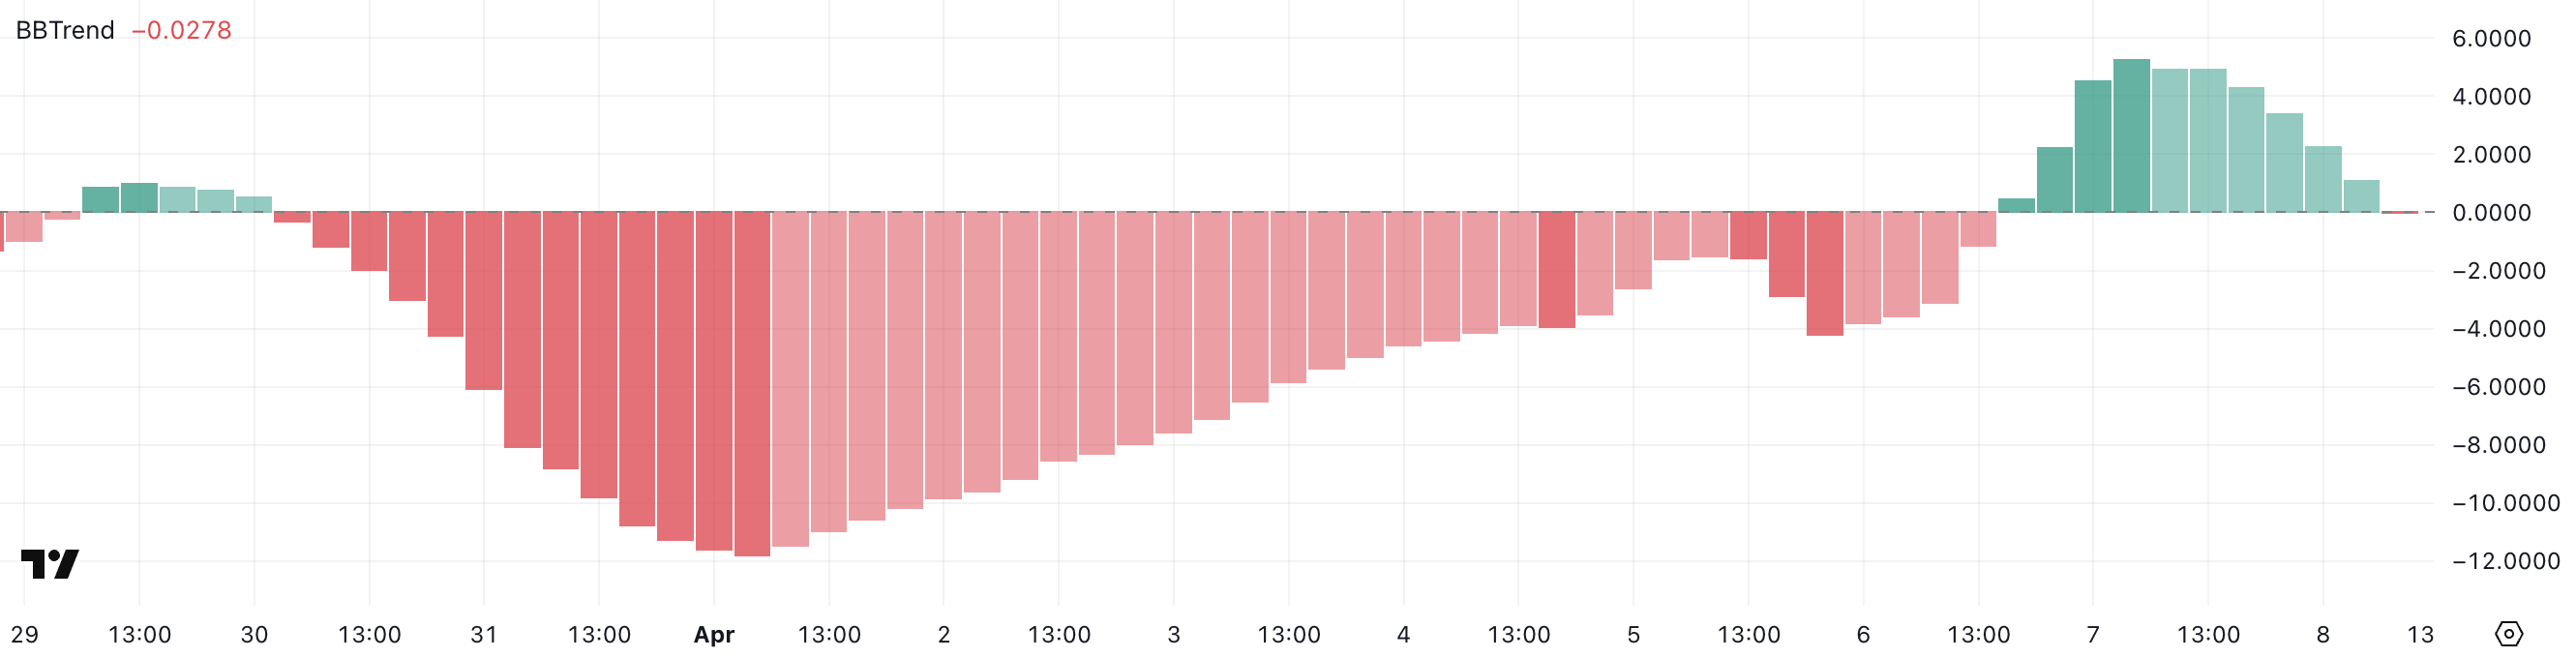
ADA BBTrend Is Fading After Reaching Levels Above 5 Yesterday
Cardano’s BBTrend indicator has flipped into negative territory, currently sitting at -0.02 after reaching a positive peak of 5.28 just a day earlier.
The BBTrend (Bull and Bear Trend) indicator measures the strength and direction of a price trend. Values above +1 typically indicate a strong bullish trend, while readings below -1 signal a strong bearish trend.
For Cardano, this neutral-to-negative reading could mean that upward momentum is fading, increasing the risk of further downside if selling pressure builds in the coming sessions.
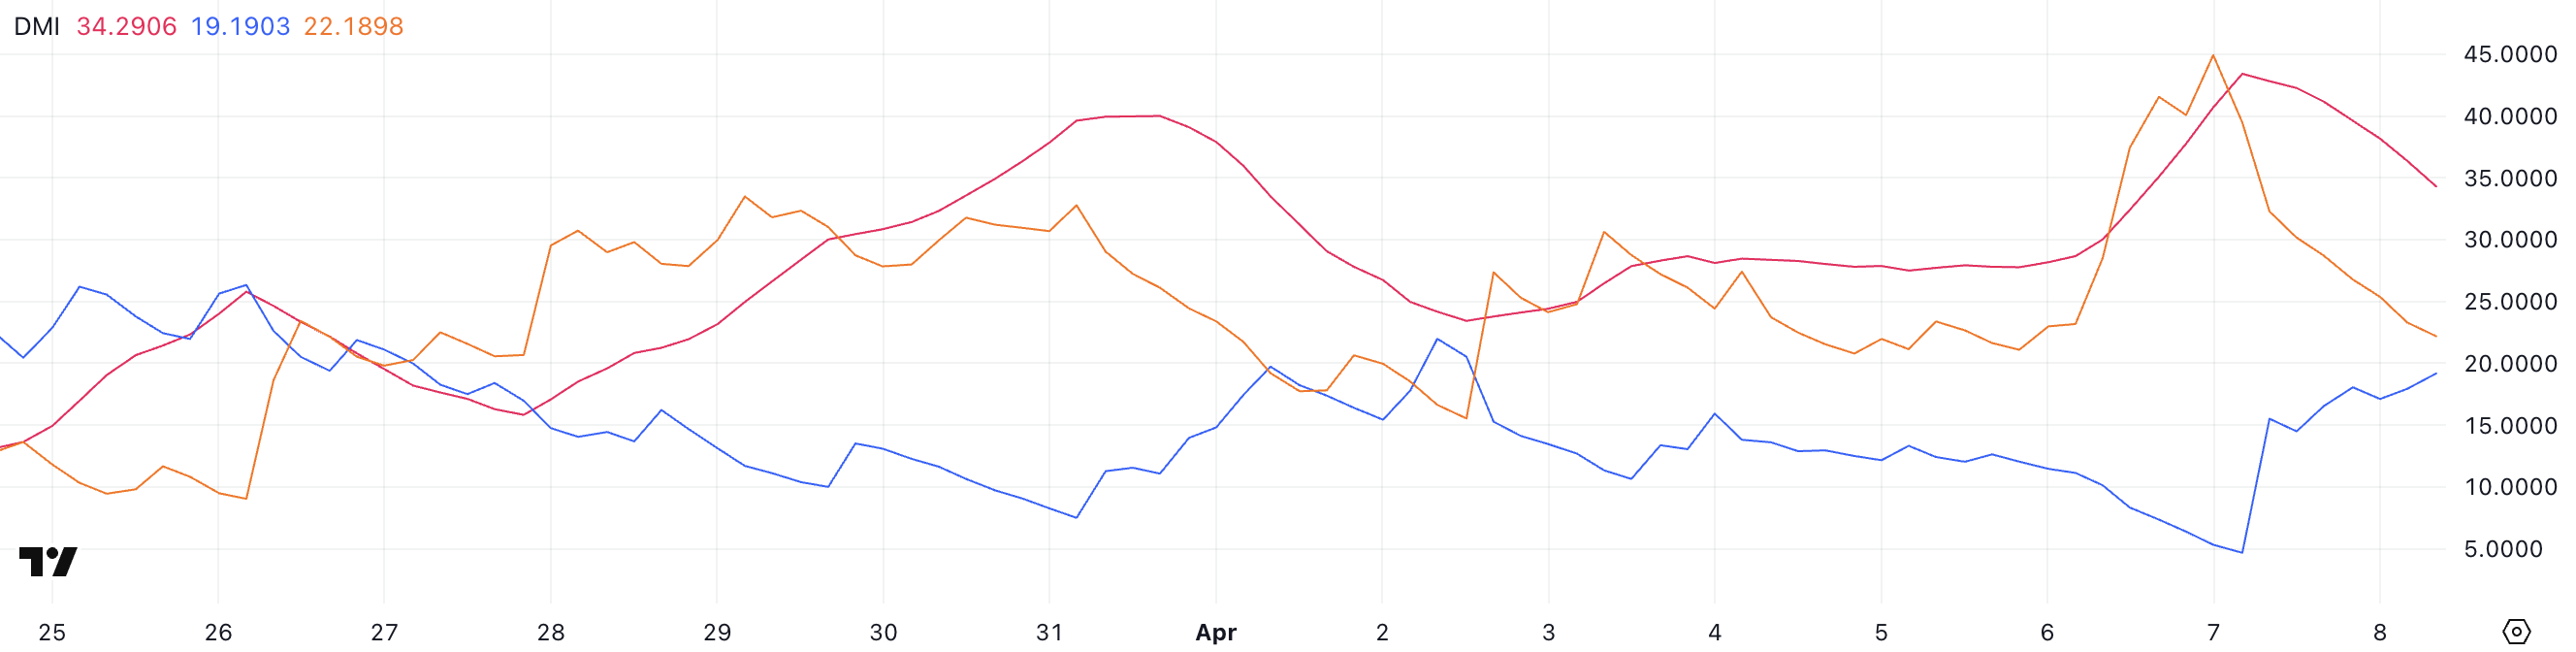
Cardano DMI Shows Buyers Are Almost Taking Control
Cardano’s DMI (Directional Movement Index) chart shows that its ADX, which measures trend strength, has dropped to 34.29 from 43.41 yesterday.
While this indicates that the current trend is weakening, the ADX is still well above the key 25 threshold, meaning the market remains in a strong directional move.
The ADX is part of the DMI system, which includes the +DI (positive directional index) and -DI (negative directional index).
The +DI has climbed from 4.68 to 19.19, showing growing bullish interest, while the -DI has sharply dropped from 44.92 to 22.18. This narrowing gap hints at a potential trend reversal or at least a slowing of bearish momentum.
However, since -DI is still slightly above +DI and ADX remains elevated, ADA is technically still in a downtrend — though bulls may be starting to regain some ground.
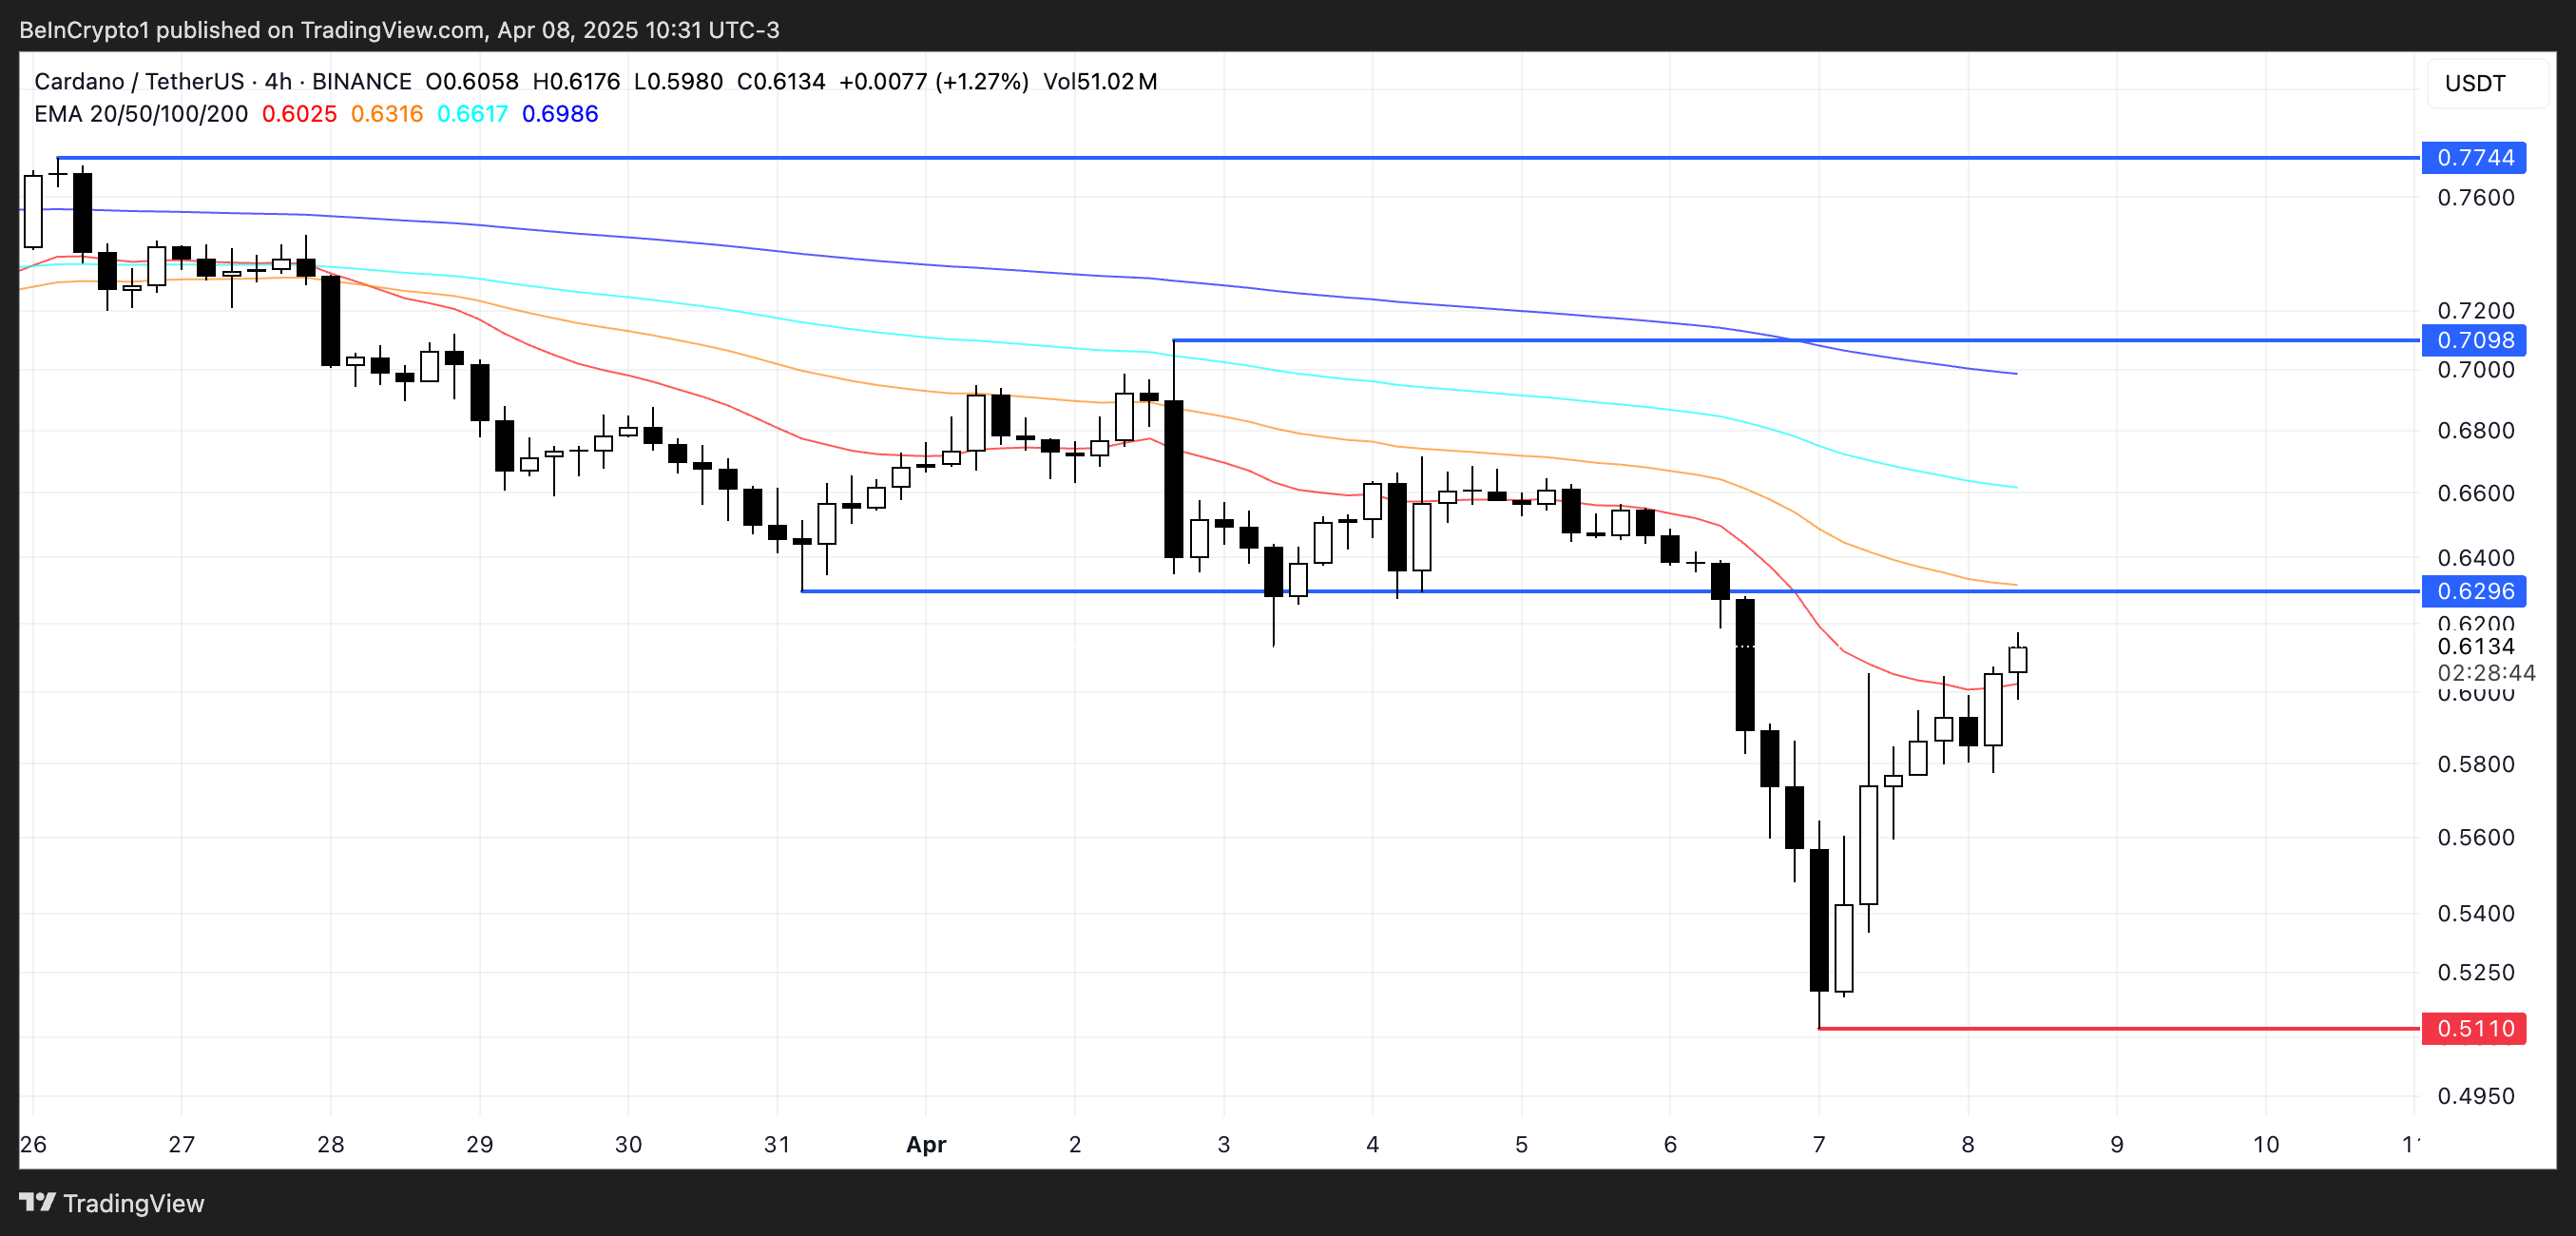
Is Cardano Getting Ready For A Recovery?
Cardano price is currently attempting a recovery after dipping below the $0.52 mark, a key support level in recent weeks. If buyers manage to confirm their strength and sustain upward momentum, ADA could first test resistance at $0.629.
A successful breakout above that could open the path toward $0.70, and if bullish pressure continues, a further rally to $0.77 may be on the table — levels not seen since early 2024.
However, if ADA fails to hold its current ground and bearish momentum returns, the token risks sliding back below $0.52.
A move toward $0.51 would be the first critical test, and losing that level could push Cardano below the $0.50 threshold for the first time since November 2024.
Pi Network, a prominent crypto project with a large user community, faces major pressure in Q2 2025. Although public interest in the project has declined, many Pioneers still hope for a strong price rally.
However, a significant amount of Pi tokens will be unlocked this month and in the coming months. This, combined with weakening liquidity, could make it difficult for Pi Coin to recover.
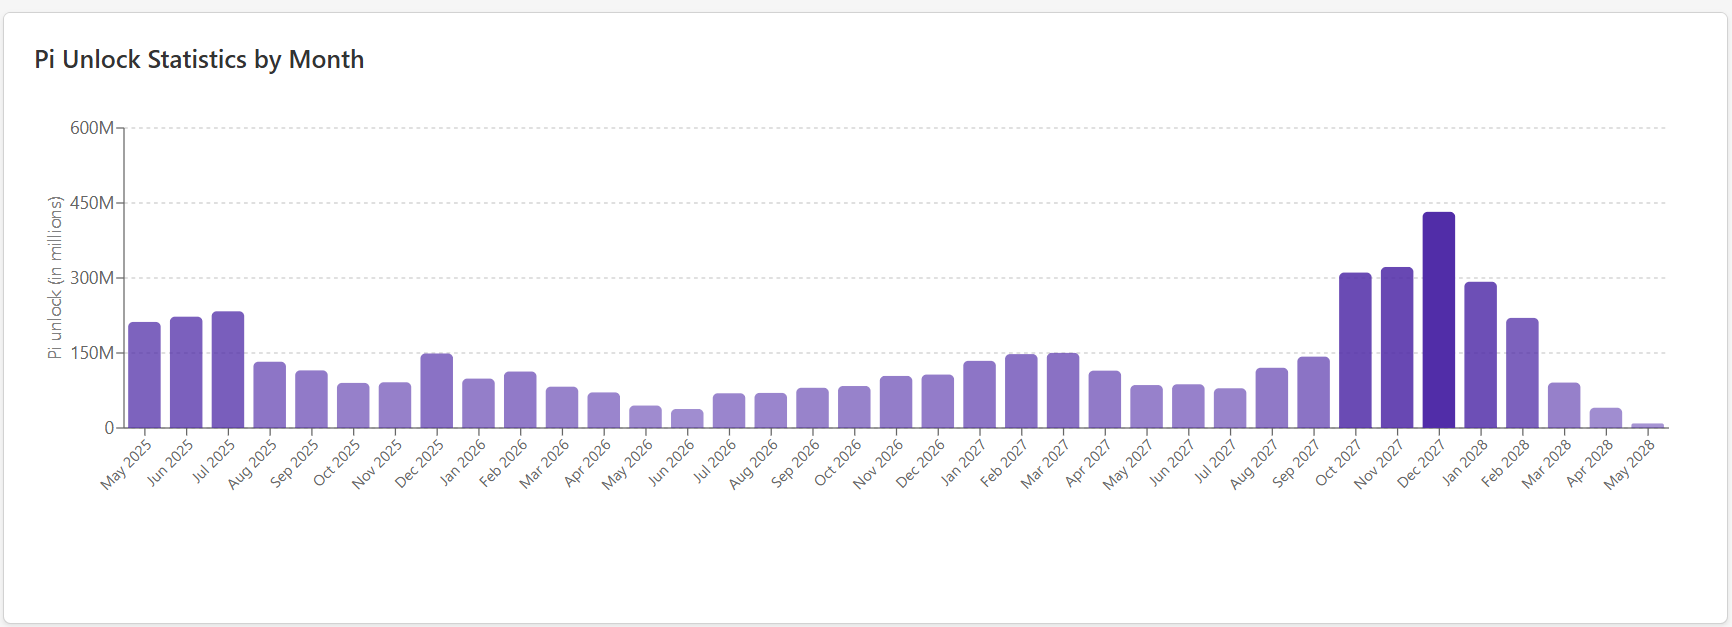
Pi Network Trading Volume Plummets as Circulating Supply Rises Sharply
According to data from PiScan, 212.2 million Pi tokens will be unlocked in May, 222.6 million in June, and 233.4 million in July. Notably, the period from May to July will see the largest Pi unlock events until September 2027.
This sharp increase in supply, along with the rising number of Pi tokens held on exchanges, is adding serious downward pressure on the price. PiScan data shows that the total Pi balance on centralized exchanges (CEXs) now exceeds 387 million tokens. Compared to a report in February, the amount of Pi on exchanges has doubled in less than three months.
Specifically, Bitget holds over 95 million Pi, while OKX holds nearly 154 million. This increase suggests that many investors may be ready to sell, increasing the risk of a price drop even if a short-term recovery occurs.
More concerning is the lack of liquidity growth alongside the rise in circulating supply. CoinMarketCap data reveals that Pi Coin’s trading volume has plunged from over $1.3 billion at launch to about $45 million—a 96% drop.
This dramatic decrease reflects a sharp decline in trading demand, raising concerns about the market’s ability to absorb newly unlocked supply.
Why Pioneers Still Expect Pi Price to Rebound in May
Despite the challenges, the Pi investor community holds an optimistic outlook.
Their hopes are partly based on unconfirmed rumors that surfaced in early May, suggesting Binance may list Pi. A Pi investor account with over 100,000 followers on X claimed that the Pi Core Team and Binance are in the final stages of negotiation.
“Soon! Pi will be listed on Binance Exchange, PCT is in final negotiation with Binance,” Pi Barter Mall declared.
Another key factor supporting a bullish outlook is the upcoming appearance of Dr. Nicolas Kokkalis, the founder of Pi Network, at Consensus 2025.
In addition, since its mainnet launch, Pi Network has achieved several milestones. These include Chainlink integrating with the Pi Network and Telegram Crypto Wallet integrating Pi as well.
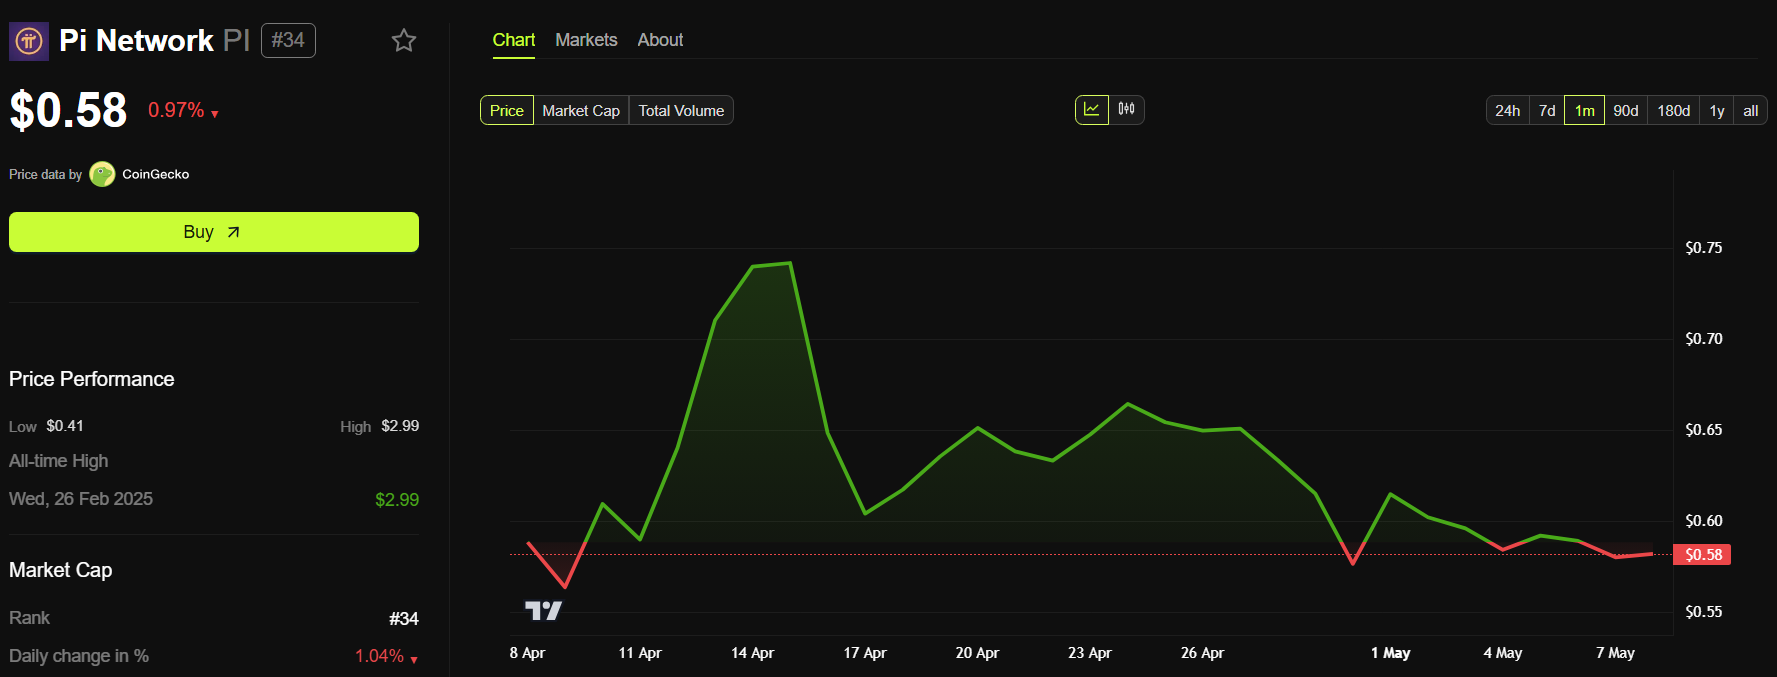
At the time of writing, Pi’s price remains steady at around $0.58, as it has since the beginning of May. This reflects the cautious sentiment of Pi traders this month.
The metrics used to measure outcomes can be misleading when evaluating blockchain performance. As more blockchain networks emerge, the public needs clear, efficiency-focused metrics, rather than exaggerated claims, to differentiate between them.
In a conversation with BeInCrypto, Taraxa Co-Founder Steven Pu explained that it’s becoming increasingly difficult to compare blockchain performance accurately because many reported metrics rely on overly optimistic assumptions rather than evidence-based results. To combat this wave of misrepresentation, Pu proposes a new metric, which he calls TPS/$.
Why Does the Industry Lack Reliable Benchmarks?
The need for clear differentiation is growing with the increasing number of Layer-1 blockchain networks. As various developers promote the speed and efficiency of their blockchains, relying on metrics that distinguish their performance becomes indispensable.
However, the industry still lacks reliable benchmarks for real-world efficiency, instead relying on sporadic sentimental waves of hype-driven popularity. According to Pu, misleading performance figures currently saturate the market, obscuring true capabilities.
“It’s easy for opportunists to take advantage by driving up over-simplified and exaggerated narratives to profit themselves. Every single conceivable technical concept and metric has at one time or another been used to hype up many projects that don’t really deserve them: TPS, finality latency, modularity, network node count, execution speed, parallelization, bandwidth utilization, EVM-compatibility, EVM-incompatibility, etc.,” Pu told BeInCrypto.
Pu focused on how some projects exploit TPS metrics, using them as marketing tactics to make blockchain performance sound more appealing than it might be under real-world conditions.
Examining the Misleading Nature of TPS
Transactions per second, more commonly known as TPS, is a metric that refers to the average or sustained number of transactions that a blockchain network can process and finalize per second under normal operating conditions.
However, it often misleadingly hypes projects, offering a skewed view of overall performance.
“Decentralized networks are complex systems that need to be considered as a whole, and in the context of their use cases. But the market has this horrible habit of over-simplifying and over-selling one specific metric or aspect of a project, while ignoring the whole. Perhaps a highly centralized, high-TPS network does have its uses in the right scenarios with specific trust models, but the market really has no appetite for such nuanced descriptions,” Pu explained.
Pu indicates that blockchain projects with extreme claims on single metrics like TPS may have compromised decentralization, security, and accuracy.
“Take TPS, for example. This one metric masks numerous other aspects of the network, for example, how was the TPS achieved? What was sacrificed in the process? If I have 1 node, running a WASM JIT VM, call that a network, that gets you a few hundred thousand TPS right off the bat. I then make 1000 copies of that machine and call it sharding, now you start to get into the hundreds of millions of ‘TPS’. Add in unrealistic assumptions such as non-conflict, and you assume you can parallelize all transactions, then you can get “TPS” into the billions. It’s not that TPS is a bad metric, you just can’t look at any metric in isolation because there’s so much hidden information behind the numbers,” he added.
The Taraxa Co-founder revealed the extent of these inflated metrics in a recent report.
The Significant Discrepancy Between Theoretical and Real-World TPS
Pu sought to prove his point by determining the difference between the maximum historical TPS realized on a blockchain’s mainnet and the maximum theoretical TPS.
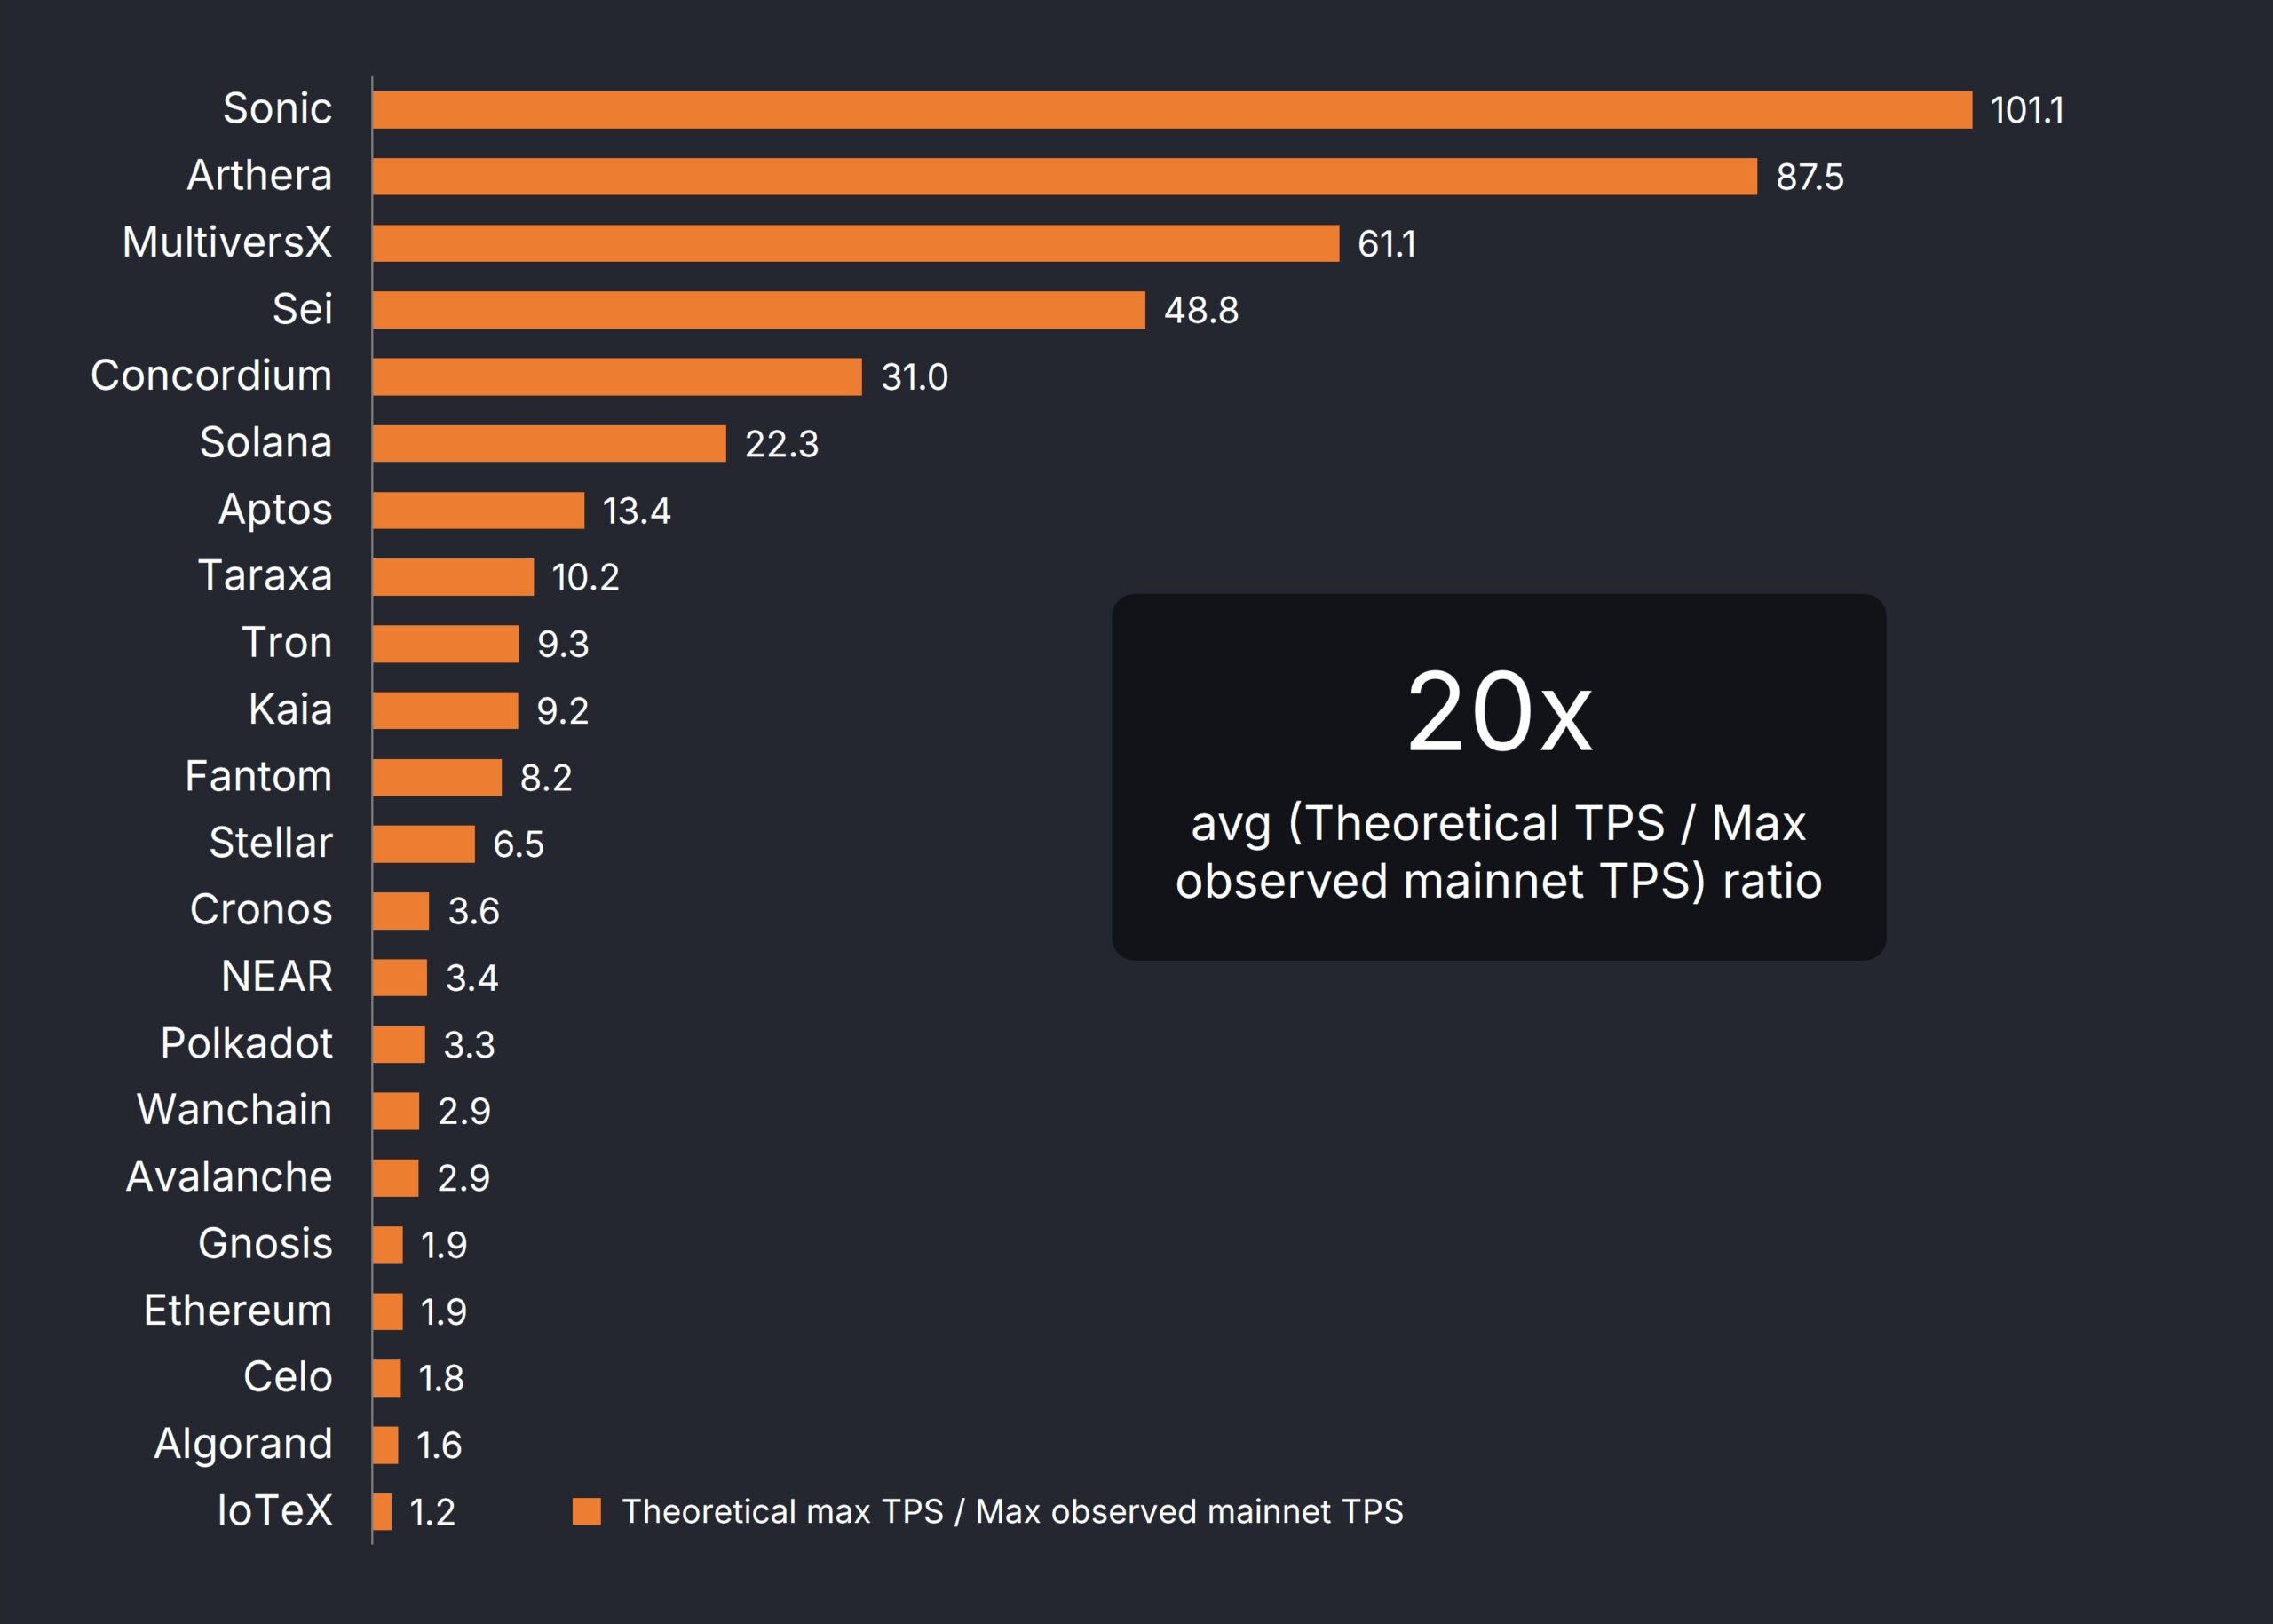
Of the 22 permissionless and single-shard networks observed, Pu found that, on average, there was a 20-fold gap between theory and reality. In other words, the theoretical metric was 20 times higher than the maximum observed mainnet TPS.
Taraxa Co-founder finds 20x difference between the Theoretical TPS and the Max Observed Mainnet TPS. Source: Taraxa.
“Metric overestimations (such as in the case of TPS) are a response to the highly speculative and narrative-driven crypto market. Everyone wants to position their project and technologies in the best possible light, so they come up with theoretical estimates, or conduct tests with wildly unrealistic assumptions, to arrive at inflated metrics. It’s dishonest advertising. Nothing more, nothing less,” Pu told BeInCrypto.
Looking to counter these exaggerated metrics, Pu developed his own performance measure.
Introducing TPS/$: A More Balanced Metric?
Pu and his team developed the following: TPS realized on mainnet / monthly $ cost of a single validator node, or TPS/$ for short, to fulfill the need for better performance metrics.
This metric assesses performance based on verifiable TPS achieved on a network’s live mainnet while also considering hardware efficiency.
The significant 20-fold gap between theoretical and actual throughput convinced Pu to exclude metrics based solely on assumptions or lab conditions. He also aimed to illustrate how some blockchain projects inflate performance metrics by relying on costly infrastructure.
“Published network performance claims are often inflated by extremely expensive hardware. This is especially true for networks with highly centralized consensus mechanisms, where the throughput bottleneck shifts away from networking latency and into single-machine hardware performance. Requiring extremely expensive hardware for validators not only betrays a centralized consensus algorithm and inefficient engineering, it also prevents the vast majority of the world from potentially participating in consensus by pricing them out,” Pu explained.
Pu’s team located each network’s minimum validator hardware requirements to determine the cost per validator node. They later estimated their monthly cost, paying particular attention to their relative sizing when used to compute the TPS per dollar ratios.
“So the TPS/$ metric tries to correct two of the perhaps most egregious categories of misinformation, by forcing the TPS performance to be on mainnet, and revealing the inherent tradeoffs of extremely expensive hardware,” Pu added.
Pu stressed considering two simple, identifiable characteristics: whether a network is permissionless and single-sharded.
Permissioned vs. Permissionless Networks: Which Fosters Decentralization?
A blockchain’s degree of security can be unveiled by whether it operates under a permissioned or permissionless network.
Permissioned blockchains refer to closed networks where access and participation are restricted to a predefined group of users, requiring permission from a central authority or trusted group to join. In permissionless blockchains, anyone is allowed to participate.
According to Pu, the former model is at odds with the philosophy of decentralization.
“A permissioned network, where network validation membership is controlled by a single entity, or if there is just a single entity (every Layer-2s), is another excellent metric. This tells you whether or not the network is indeed decentralized. A hallmark of decentralization is its ability to bridge trust gaps. Take decentralization away, then the network is nothing more than a cloud service,” Pu told BeInCrypto.
Attention to these metrics will prove vital over time, as networks with centralized authorities tend to be more vulnerable to certain weaknesses.
“In the long term, what we really need is a battery of standardized attack vectors for L1 infrastructure that can help to reveal weaknesses and tradeoffs for any given architectural design. Much of the problems in today’s mainstream L1 are that they make unreasonable sacrifices in security and decentralization. These characteristics are invisible and extremely hard to observe, until a disaster strikes. My hope is that as the industry matures, such a battery of tests will begin to organically emerge into an industry-wide standard,” Pu added.
Meanwhile, understanding whether a network employs state-sharding versus maintaining a single, sharded state reveals how unified its data management is.
State-Sharding vs. Single-State: Understanding Data Unity
In blockchain performance, latency refers to the time delay between submitting a transaction to the network, confirming it, and including it in a block on the blockchain. It measures how long it takes for a transaction to be processed and become a permanent part of the distributed ledger.
Identifying whether a network employs state-sharding or a single-sharded state can reveal much about its latency efficiency.
State-sharded networks divide the blockchain’s data into multiple independent parts called shards. Each shard operates somewhat independently and doesn’t have direct, real-time access to the complete state of the entire network.
By contrast, a non-state-sharded network has a single, shared state across the entire network. All nodes can access and process the same complete data set in this case.
Pu noted that state-sharded networks aim to increase storage and transaction capacity. However, they often face longer finality latencies due to a need to process transactions across multiple independent shards.
He added that many projects adopting a sharding approach inflate throughput by simply replicating their network rather than building a truly integrated and scalable architecture.
“A state-sharded network that doesn’t share state, is simply making unconnected copies of a network. If I take a L1 network and just make 1000 copies of it running independently, it’s clearly dishonest to claim that I can add up all the throughput across the copies together and represent it as a single network. There are architectures that actually synchronize the states as well as shuffle the validators across shards, but more often than not, projects making outlandish claims on throughput are just making independent copies,” Pu said.
Based on his research into the efficiency of blockchain metrics, Pu highlighted the need for fundamental shifts in how projects are evaluated, funded, and ultimately succeed.
What Fundamental Shifts Does Blockchain Evaluation Need?
Pu’s insights present a notable alternative in a Layer-1 blockchain space where misleading performance metrics increasingly compete for attention. Reliable and effective benchmarks are essential to counter these false representations.
“You only know what you can measure, and right now in crypto, the numbers look more like hype-narratives than objective measurements. Having standardized, transparent measurements allows simple comparisons across product options so developers and users understand what it is they’re using, and what tradeoffs they’re making. This is a hallmark of any mature industry, and we still have a long way to go in crypto,” Pu concluded.
Adopting standardized and transparent benchmarks will foster informed decision-making and drive genuine progress beyond merely promotional claims as the industry matures.