On Tuesday, Bitcoin spot ETFs recorded net outflows, snapping a three-day streak of inflows that had brought in over $1 billion.
With uncertainty surrounding the Federal Reserve’s upcoming policy decision, institutional investors appear to be reducing their exposure in anticipation of increased market volatility.
Institutions Pull Back from BTC ETFs as Fed Decision Looms
BTC spot ETFs saw net outflows of $85.64 million on Tuesday, marking a shift in sentiment among institutional investors just ahead of today’s US Federal Reserve’s latest policy meeting.
Total Bitcoin Spot ETF Net Inflow. Source: SosoValue
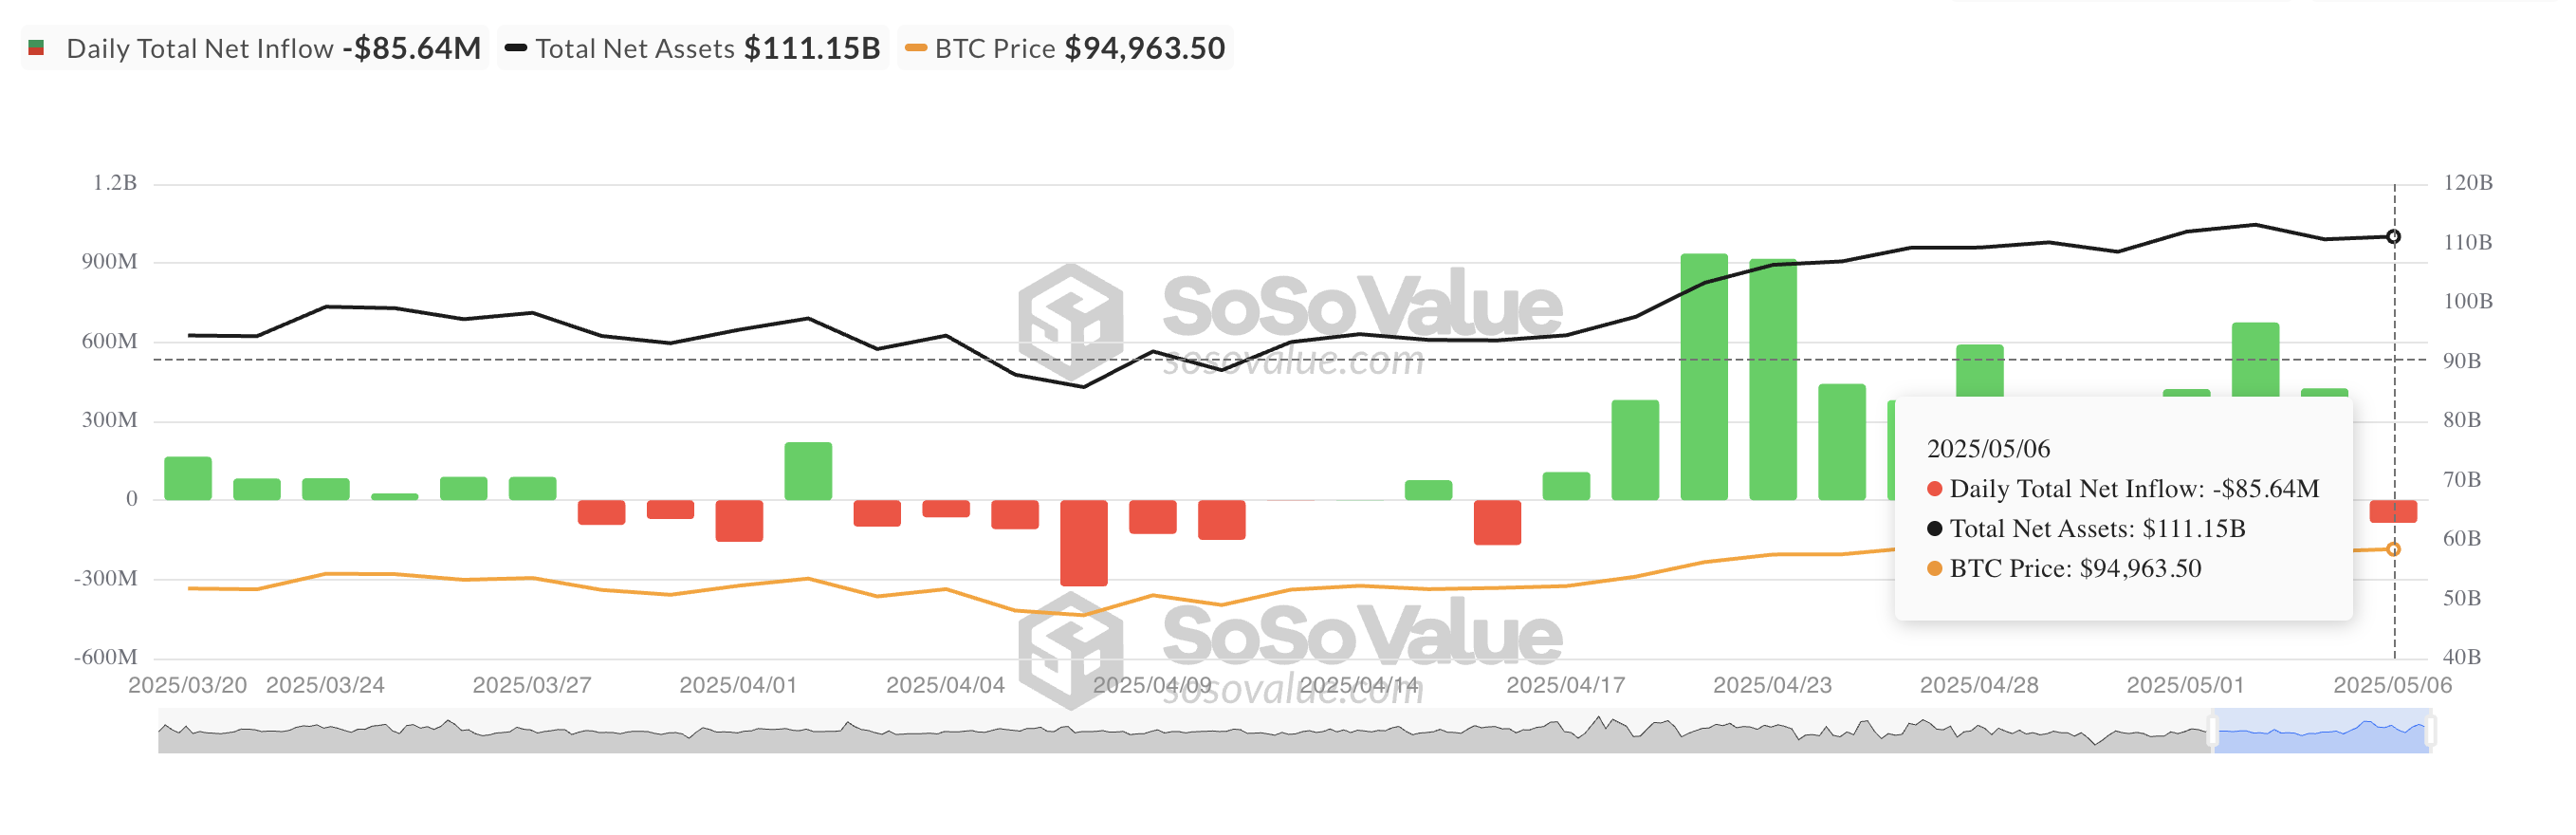
The outflows came after three consecutive days of strong inflows, totaling over $1 billion, into these BTC-backed funds. This suggests a pullback as market participants prepare for potential volatility surrounding today’s FOMC announcement.
It can also be seen as a strategic step to avoid short-term losses in the event of an unfavorable policy signal or unexpected market reaction.
Despite the ETF outflows, on-chain data reveals a spike in spot net inflows today. This indicates that while institutional players may be reducing their ETF exposure, they could be rotating capital into direct spot positions, possibly to capitalize on short-term price swings both before and after the Fed’s announcement.
According to Coinglass, BTC’s spot net inflows sit at $9.72 million. When an asset sees spot inflows, the number of its coin or tokens purchased and moved into spot markets has increased, indicating rising demand.
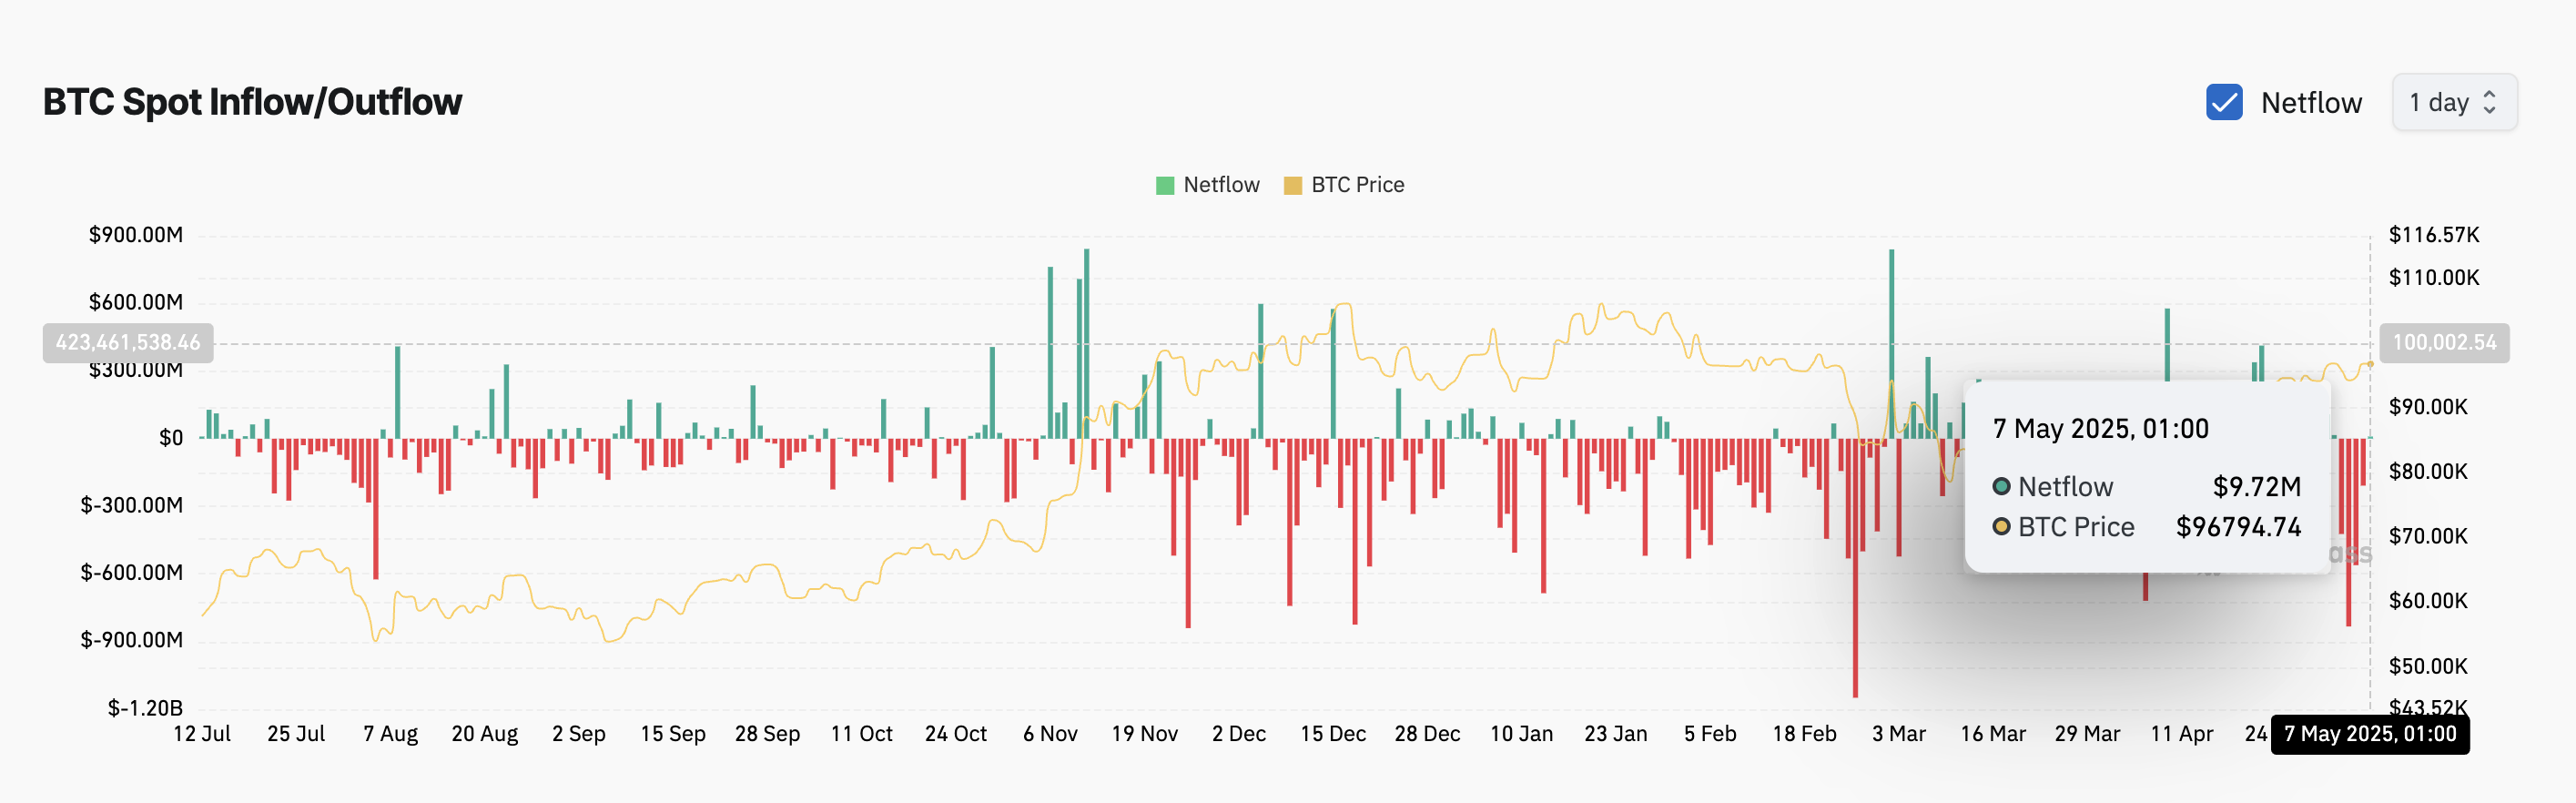
This points to surging accumulation among BTC spot market participants, a trend which can drive price appreciation if buying pressure remains.
Bitcoin Rises on Buyer Strength
BTC trades at $96,679 at press time, noting a 2% surge over the past day. The coin’s positive Balance of Power (BoP) reflects the steady rise in spot buying activity ahead of the FOMC meeting. As of this writing, this is at 0.10.
This indicator measures the strength of buyers versus sellers by comparing the closing price to the trading range over a specific period. When its value is positive, buyers dominate the market, suggesting bullish momentum and upward pressure on an asset’s price.
If BTC demand rockets and market conditions remain favorable post-FOMC meeting, it could climb toward $102,080.
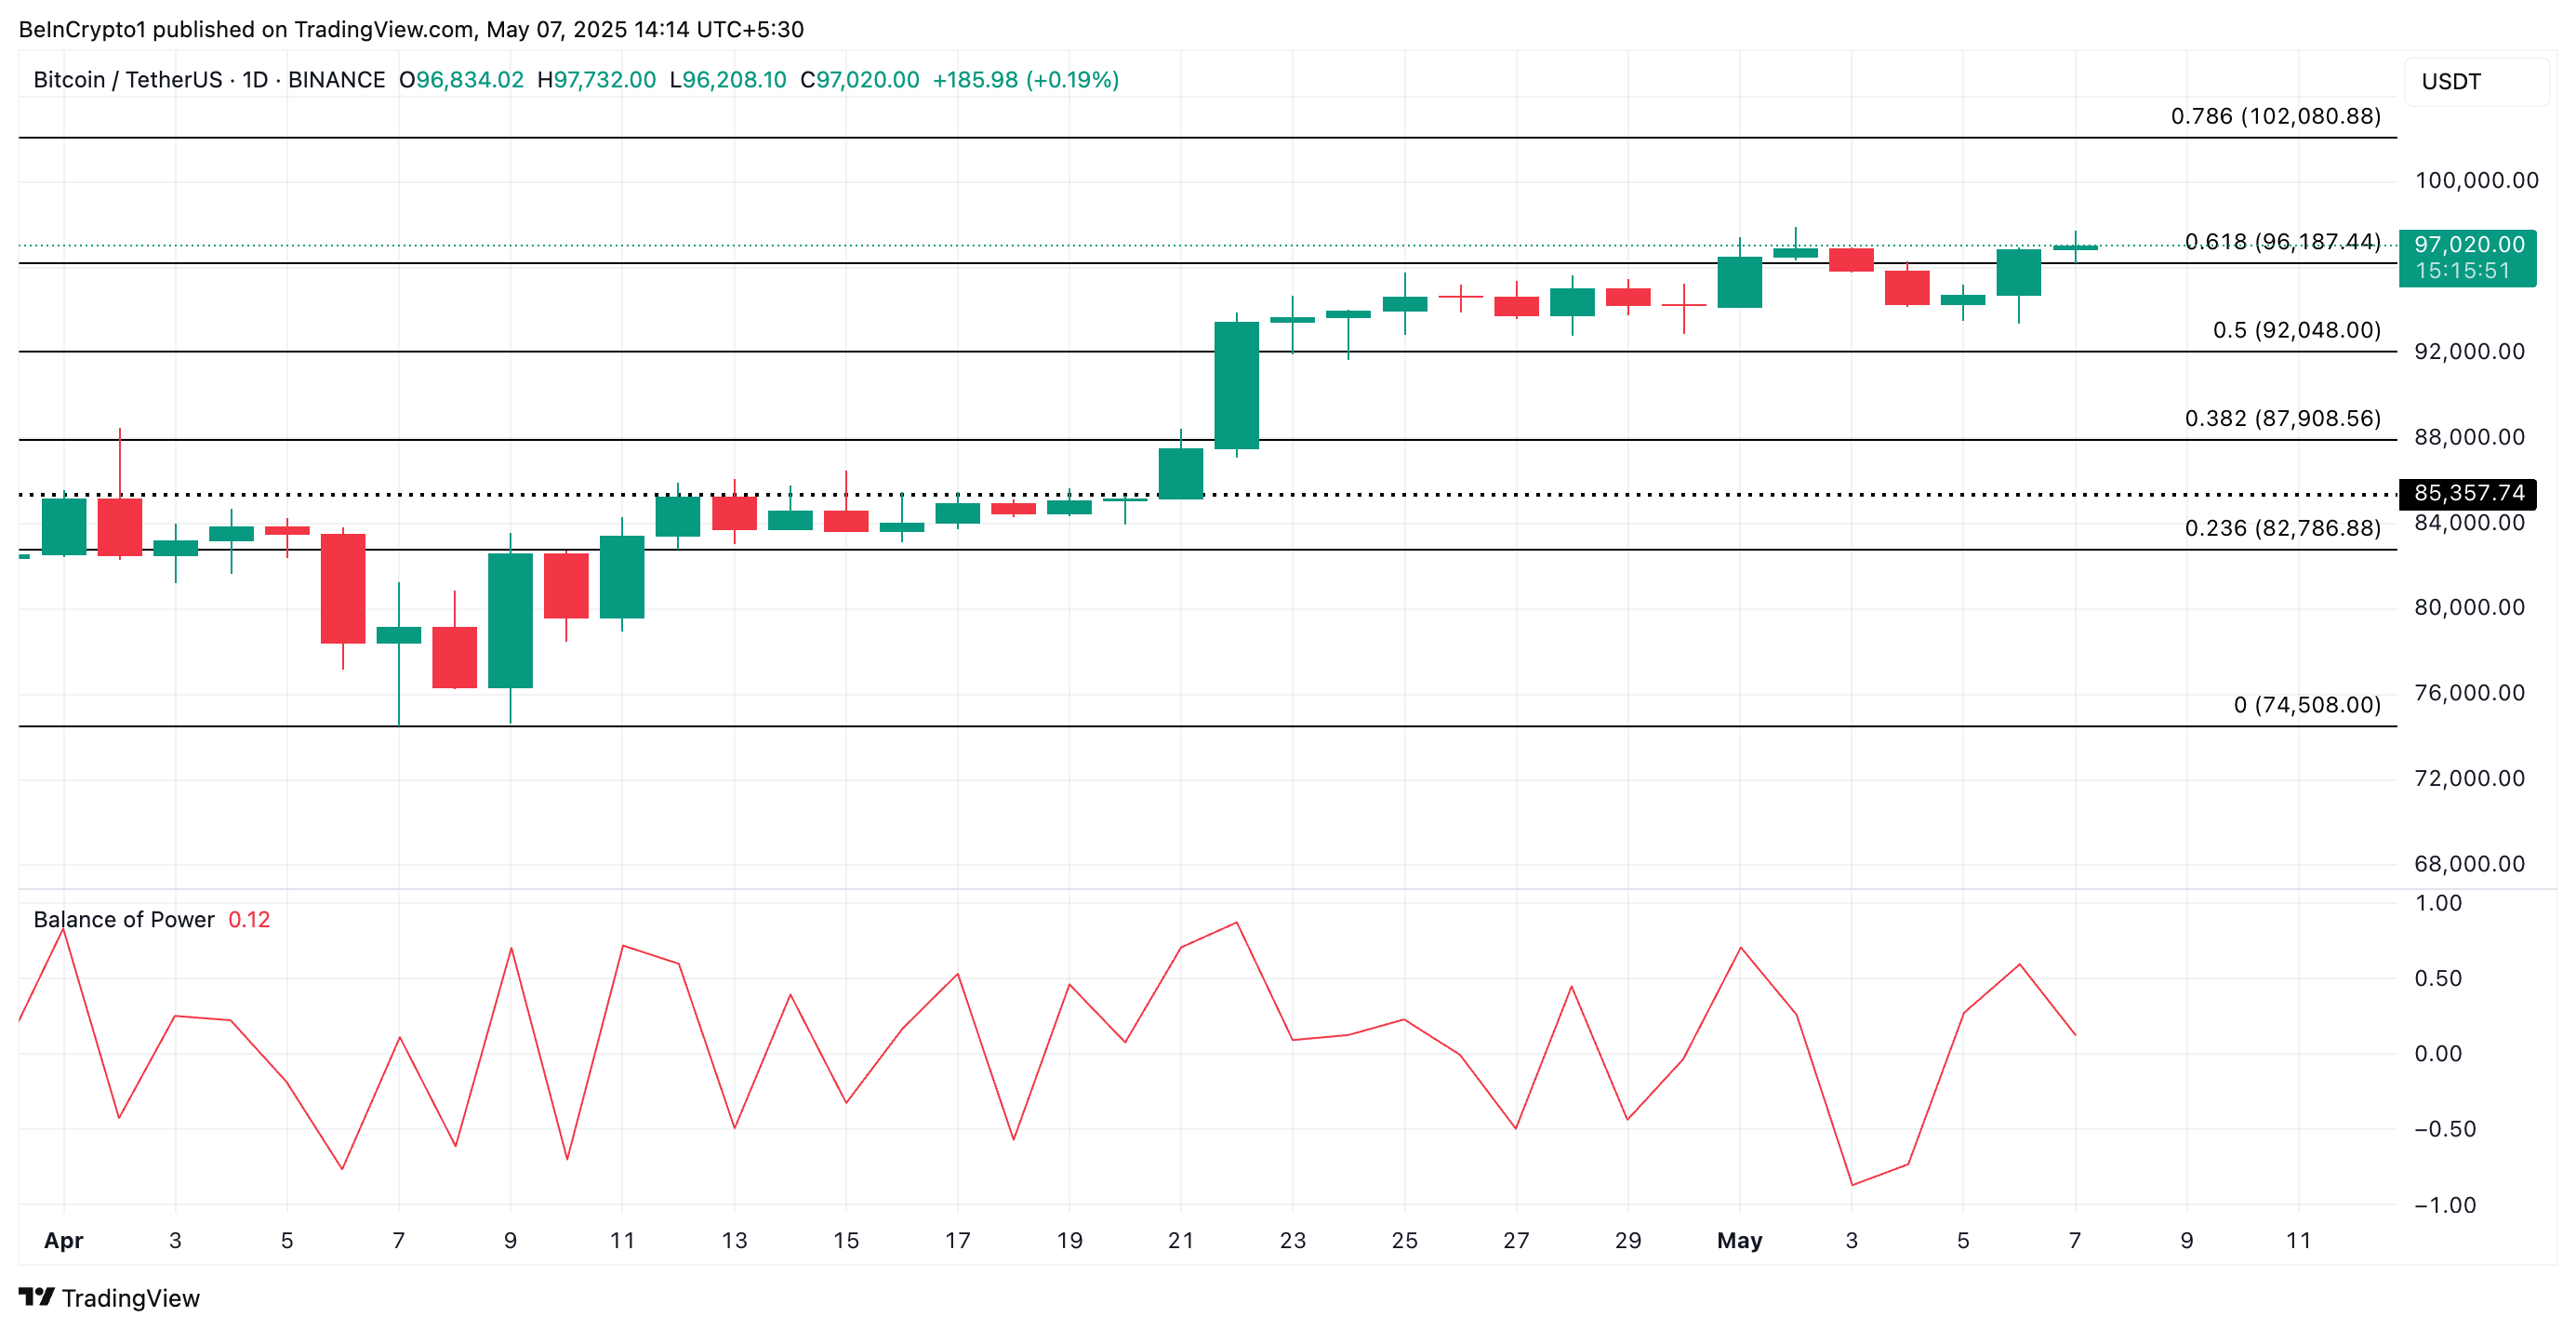
Cardano (ADA) has been trading below the $0.70 mark since March 29, struggling to regain bullish momentum. Despite brief signs of strength, recent indicators now point to weakening trend conditions.
Both the BBTrend and ADX show fading buying pressure, while EMA alignment remains bearish. With price stuck between key support and resistance levels, ADA’s next move could define its short-term direction.
Cardano’s BBTrend has flipped negative, currently sitting at -0.78 after spending the last five days in positive territory. The indicator reached a peak of 9.76 on April 14, signaling strong bullish momentum at the time.
BBTrend, short for Bollinger Band Trend, measures the strength and direction of a price move relative to its Bollinger Bands.
Positive values typically indicate bullish trends, while negative values point to bearish conditions or weakening momentum.
The shift to -0.78 suggests that Cardano’s recent uptrend has lost strength and may be reversing. A negative BBTrend reading means the price is now moving closer to the lower band, often a sign of rising selling pressure.
While it doesn’t confirm a strong downtrend yet, this reversal could indicate the beginning of a broader consolidation or bearish phase unless momentum quickly recovers.
Traders may want to watch closely for follow-through or a bounce to assess ADA’s short-term direction.
Cardano Momentum Fades as ADX Crashes and Selling Pressure Rises
Cardano’s DMI chart shows a sharp drop in trend strength, with its ADX falling to 15.12 from 28.34 just two days ago.
The ADX (Average Directional Index) measures trend intensity—readings above 25 suggest a strong trend, while values below 20 indicate a weak or consolidating market.
At the same time, the +DI (bullish directional indicator) has dropped from 22.61 to 17.39, showing weakening buying pressure. Meanwhile, the -DI (bearish indicator) has risen from 10.5 to 14.95, pointing to a gradual increase in selling strength.
With both the ADX and +DI falling, and -DI climbing, the setup hints at a potential shift in favor of the bears.
Cardano’s EMA lines remain bearish, with short-term averages still positioned below the long-term ones—indicating that downward momentum is intact.
Cardano price is holding above a key support zone near $0.594, but if this level fails, it could trigger a deeper drop toward $0.511. This would confirm a continuation of the downtrend and reflect growing selling pressure.
However, if ADA manages to reverse its current momentum, the first major resistance lies at $0.64. A breakout above that level could open the door to further gains, with potential targets at $0.66 and $0.70.
If the uptrend strengthens, ADA could even rally toward $0.77, marking a more decisive recovery and trend shift.
“This was due to an entity(s) on the Binance perpetuals market. That’s what triggered the entire cascade. The initial drop below $5 was triggered by a ~1 million USD short position being market-sold. This caused over 5% of slippage in literal microseconds. That was the trigger. This seems intentional to me. They knew what they were doing,” the analyst stated.
Pi Network: From Chainlink Buzz to Transparency Fears
Pi Network recorded strong optimism this week as its native Pi Coin surged by double digits. BeInCrypto attributed the surge to the announcement of a key integration with Chainlink.
They pitched this strategic collaboration as a gateway to real-world utility. Specifically, it positioned Pi closer to the broader DeFi and smart contract ecosystem. However, the euphoria proved short-lived.
Allegations suggest that, like the OM token, Pi coin lacks full clarity around circulating supply, wallet distribution, and centralized control. To some, these are potential red flags in an increasingly regulation-sensitive industry.
“The OM incident is a wake-up call for the entire crypto industry, proof that stricter regulations are urgently needed. It also serves as a huge lesson for the Pi Core Team as we transition from the Open Network to the Open Mainnet,” wrote Dr Altcoin.
Pi coin reversed gains within days, falling 18% from its weekly high. At the time of writing, PI was trading at $0.6112, up by a modest 0.7% in the past 24 hours, per CoinGecko.
Grayscale’s Altcoin Shake-Up: 40 Tokens Under Review
This week in crypto also showed that institutional investor interest in altcoins is heating up again, with Grayscale leading the charge.
The digital asset manager unveiled its updated list of assets under consideration for the second quarter (Q2) 2025. BeInCrypto reported that the list featured zero altcoins across sectors such as DePIN, AI, modular blockchains, and restaking. Among the notable tokens being eyed are SUI, STRK, TIA, JUP, and MANTA.
The update reflects Grayscale’s growing thesis around emerging crypto trends, particularly as the firm seeks to expand beyond its core Bitcoin and Ethereum products.
This announcement follows a broader strategic overhaul from three weeks ago when Grayscale reshuffled its top 20 list of altcoins by market exposure. Several older names were dropped at the time, while newer narratives like Solana-based DePIN and Ethereum restaking plays were pushed to the forefront.
The expansion into 40 coins signals Grayscale’s recognition of renewed retail and institutional appetite for differentiated assets. However, inclusion in the list does not guarantee a fund launch. It only indicates Grayscale’s active research.
XRP and SWIFT Partnership: Breaking Down the Rumors
There was speculation this week about a possible partnership between Ripple’s XRP and banking giant SWIFT in crypto.
This narrative was based on a misinterpreted document. A series of cryptic social posts exacerbated the speculation, which some took as confirmation of collaboration between the global payments network and the XRP ledger.
However, BeInCrypto’s in-depth reporting sank the rumors. While Ripple has long pursued banking institutions and SWIFT has shown openness to blockchain innovations, there is no verified partnership between the two.
SWIFT’s public-facing projects around tokenization and digital asset settlement do not include XRP.
Despite the debunking, the rumors sparked an important conversation about XRP’s long-term positioning. The token remains a top-10 asset and a favorite among retail investors banking on utility-driven price appreciation.
With Ripple’s legal battles with the SEC nearing resolution and international CBDC partnerships in the works, the project is far from irrelevant.
US Dollar Dives: What the DXY Crash Means for Bitcoin
The US Dollar Index (DXY) hit a three-year low this week, sending ripples through the crypto markets. Historically, a falling DXY has been bullish for Bitcoin, and this week was no different, with BTC reclaiming above the $84,000 range.
The greenback’s weakness reflects growing fears of fiscal deterioration in the US, as rate cuts loom and Treasury debt soars.
Japan’s 10-year bond yields hit multi-decade highs, forcing the Bank of Japan (BoJ) into increasingly precarious interventions. As Japanese liquidity spills outward, crypto and risk assets have become inadvertent beneficiaries.
This macroenvironment is ideal for Bitcoin. Weakening fiat, rising global liquidity, and crumbling bond market confidence create a perfect storm.
Veteran market analyst Peter Brandt has issued a gloomy year-end forecast for XRP, suggesting the asset may struggle to maintain its momentum despite recent gains.
On April 18, Brandt shared his updated analysis on X (formerly Twitter), projecting two possible scenarios for XRP’s market capitalization by year’s end.
Cautionary Outlook for XRP Despite Recent Surge
The first scenario places XRP’s market cap around $116.67 billion, while the second offers a more bearish outlook of just above $60 billion.
Essentially, both figures imply a decline from XRP’s current valuation of roughly $2.09 per token at a market capitalization of $121 billion.
Brandt’s analysis is based on a technical pattern he previously identified on XRP’s price chart.
According to him, the formation resembles a classic head-and-shoulders setup—a pattern that often signals a trend reversal. If this plays out, XRP could fall as low as $1.07.
He added then that a move below $1.90 would confirm the pattern and likely trigger a steep correction of more than 50%. However, a break above $3 could invalidate the bearish outlook.
“XRP is forming a textbook H&S pattern. So, we are now range bound. Above 3.000 I would not want to be short. Below 1.9 I would not want to own it,” Brandt explained.
He emphasized that the company is not actively seeking external funding because it remains financially stable and is prioritizing product development and business expansion.
“Will we IPO in 2025? I think that’s a definitive no…We’ve said there’s no imminent plans to go public,” Garlinghouse stated.
While the company isn’t moving forward with an IPO this year, Garlinghouse didn’t completely close the door.
He noted that Ripple is evaluating whether going public would benefit the business in the long run. However, such a move isn’t a current priority.
“You have to ask yourself, okay, how does Ripple benefit from being a public company? And is it a high priority for us?” he said.
Moreover, Garlinghouse also hinted that the regulatory landscape—especially under new leadership at the SEC—could influence Ripple’s future decisions.