A high-stakes meeting is set to take place soon, which could be a turning point in the crypto industry. Ripple’s Executive Chairman and co-founder, Chris Larsen, is all set to meet with the new SEC Chair, Paul Atkins, on May 2, 2025.
With crypto rising as a priority under the Trump administration, the meeting could be a key development for Ripple, XRP, and the crypto industry.
BREAKING:
RIPPLE’S CHRIS LARSEN TO MEET SEC CHAIRMAN PAUL ATKINS TOMORROW, MAY 2.
Atkins, who has been the former SEC Commissioner, has already expressed his support for blockchain innovation. At a recent roundtable conference on April 25, he said that the SEC should stop holding back crypto growth and should work on developing clear, supportive rules.
What To Expect From the Meeting?
The agenda for the meeting is not confirmed yet, however, a settlement or resolution of the SEC vs Ripple case is expected. This could set a precedent for how other digital assets are treated in the future.
The possible outcomes could include clarifications on whether XRP is a security, which has been a long-debated issue. There could also be a discussion on how blockchain can improve global payments, which would increase XRP’s adoption.
The pro-crypto SEC Chair has also expressed interest in creating a regulatory sandbox for crypto, which will allow companies to test new ideas without strict rules, helping more blockchain projects grow in the U.S.
XRP ETF Approval Chances Rise to 85%
With the crypto market recovering after the recent tariff turmoil, excitement around ETFs is growing. Recently, Bloomberg ETF analyst Eric Balchunas shared a report suggesting that XRP has an 85% chance of ETF approval by the SEC in 2025.
XRP could be set for a breakout ahead. It is currently trading at $2.23, up over 3% in the past 24 hours.
Bittensor (TAO) has been up 6.5% over the past seven days, and its market cap is now hovering just below $4 billion despite correcting 6.6% in the last three days. The recent pullback has weakened key technical indicators, with both momentum and trend strength showing signs of deterioration.
While TAO has managed to hold key support levels and remains above $440, bearish signals are starting to emerge across multiple charts. Whether bulls can reclaim control or TAO slips below $400 will likely define its next major move.
Bittensor Trend Weakens as Bearish Momentum Overtakes Bulls
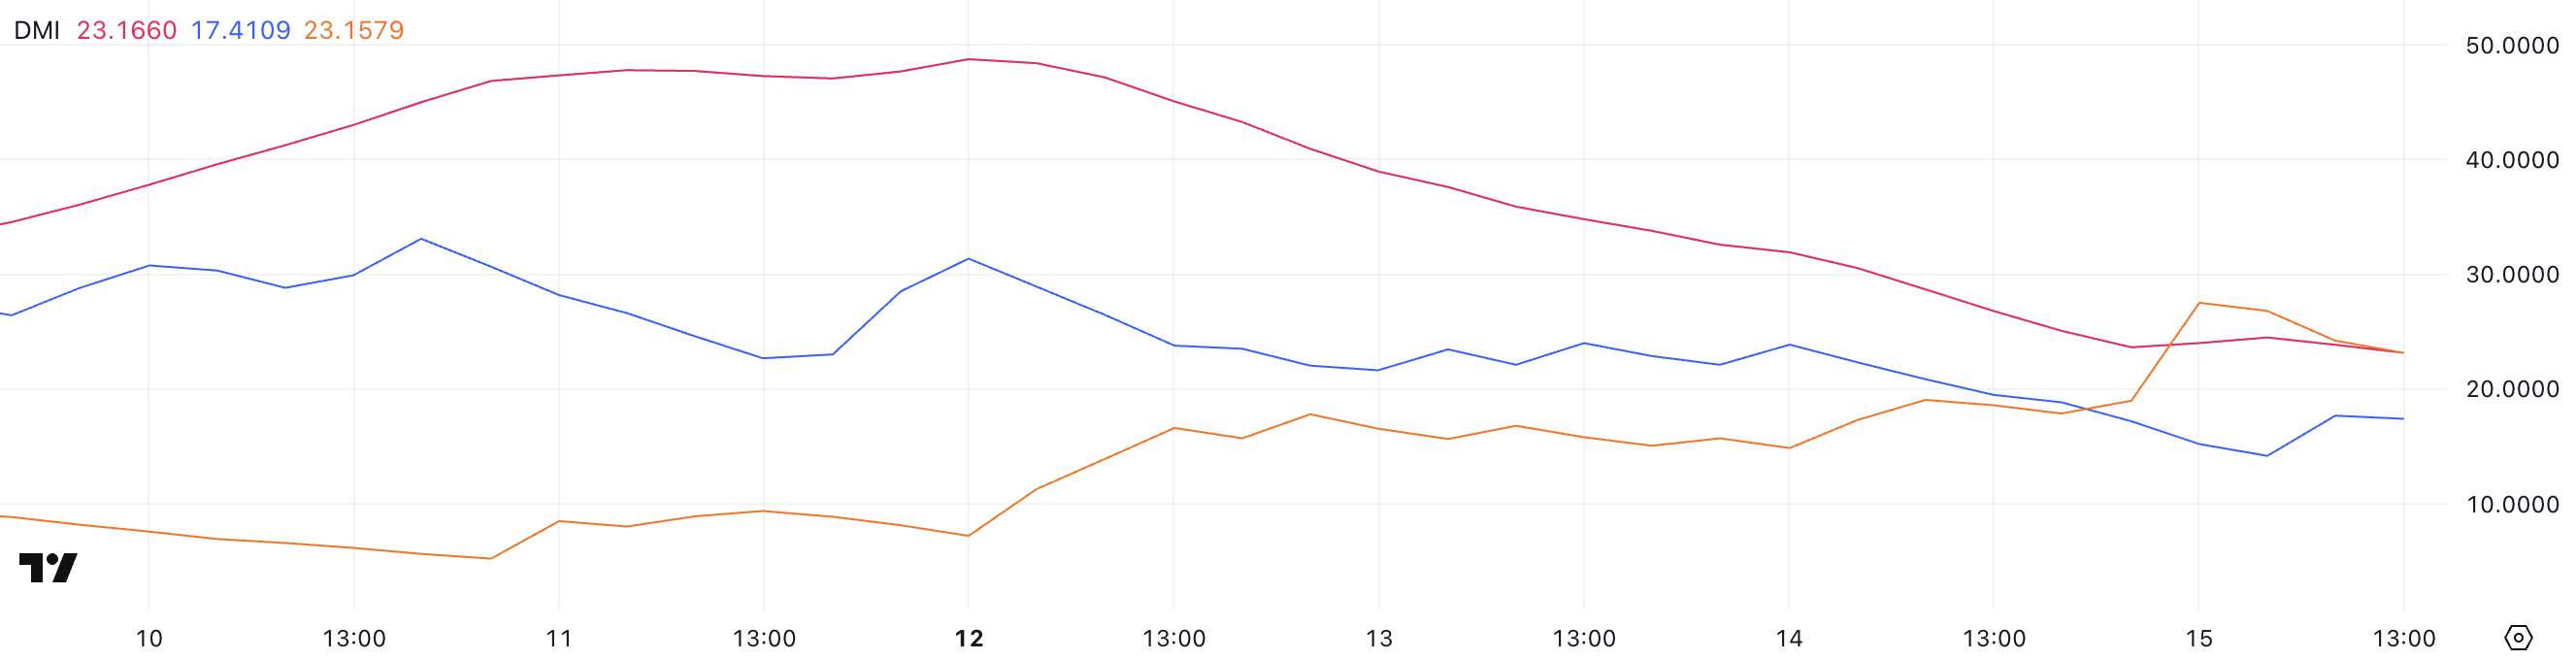
TAO’s DMI (Directional Movement Index) chart shows a weakening trend, with its ADX (Average Directional Index) falling sharply from 47 to 23.16 over the past three days.
The ADX measures the strength of a trend—regardless of direction—on a scale from 0 to 100. Values above 25 typically indicate a strong trend, while readings below 20 suggest a weak or ranging market.
TAO’s current ADX is just above 23, suggesting the recent trend is losing strength and may be nearing a transition phase. Despite that, according to CoinGecko data, Bittensor is the biggest artificial intelligence coin in the market, surpassing players like NEAR, ICP, and RENDER.
Meanwhile, the +DI (Positive Directional Indicator) has dropped from 23.87 to 17.41, signaling a decline in bullish pressure. At the same time, the -DI (Negative Directional Indicator) has risen from 17.86 to 23.15, showing that bearish momentum is gaining control.
This crossover—where -DI moves above +DI—indicates that sellers have overtaken buyers, and with ADX still above 20, the downtrend may continue to develop.
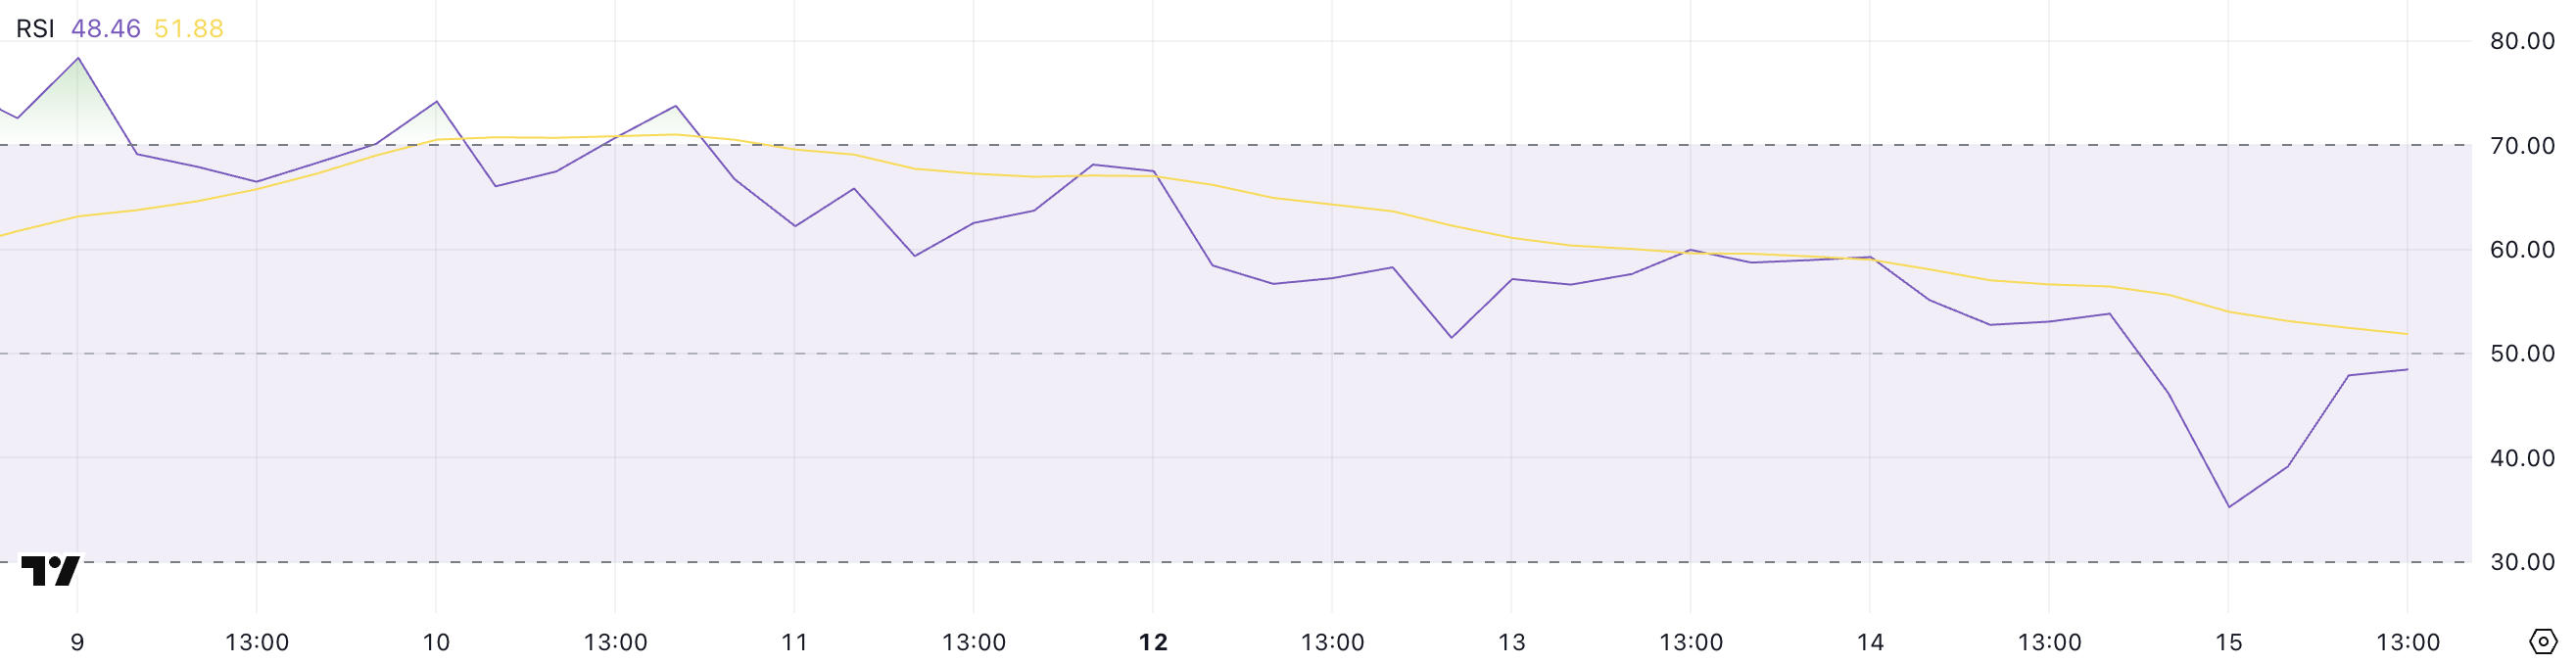
TAO’s Relative Strength Index (RSI) is currently at 48.46, after experiencing a sharp intraday dip from 53.82 yesterday to as low as 35.25 just a few hours ago.
The RSI is a momentum indicator that measures the speed and magnitude of recent price movements on a scale from 0 to 100. Typically, values above 70 suggest overbought conditions and potential for a pullback, while values below 30 indicate oversold conditions and a possible rebound.
TAO’s current RSI of 48.46 places it slightly below that midpoint, signaling a mild bearish bias after a brief period of stronger selling pressure.
The recovery from the 35.25 low shows that buyers have stepped back in, but the failure to hold above 50 suggests that bullish momentum remains weak. This level could reflect consolidation or indecision in the market, where TAO may trade sideways unless new catalysts emerge.
If RSI stabilizes or climbs above 50 again, it may indicate renewed strength, while another drop toward 30 would increase the risk of further downside.
TAO Holds Support but Faces Key Test for Momentum Recovery
TAO recently tested key support around $417.6 and bounced back above $440, showing resilience after a brief dip. Its EMA lines still reflect a bullish structure, with short-term moving averages positioned above the long-term ones.
However, the narrowing gap between them suggests that momentum is weakening. If selling pressure returns, the trend could shift, threatening Bittensor’s leadership as the biggest AI coin.
After weeks of sideways action, Bitcoin and Ethereum are finally showing strong signs of recovery. Bitcoin has jumped to a seven-week high of $91,000, climbing from a recent low of $74,400, a gain of around 22%.
But this price jump isn’t just about Bitcoin, Ethereum too, is back in the green, now trading above $1,700 after a solid 5.5% rise in just 24 hours.
So, what’s behind this sudden price pump? Let’s break it down.
Institutional Money is Flowing Back into Bitcoin
One of the biggest reasons behind Bitcoin’s jump is the return of institutional investors. In the last few weeks, U.S.-based Bitcoin ETFs saw their biggest daily inflow, pulling in $381.3 million.
Leading the charge was ARK’s Bitcoin ETF with $116 million, followed by Fidelity’s fund with $87 million. This strong inflow shows that institutional players are confident about Bitcoin’s future again.
Political Pressure on the Fed to Cut Rates
Another key reason is the political pressure being placed on the Federal Reserve. U.S. President Donald Trump is urging the Fed to lower interest rates, which often leads investors to seek out alternative assets like Bitcoin and Ethereum.
There are even talks of whether Trump could try to remove Fed Chair Jerome Powell, which is creating uncertainty in traditional markets.
Dollar Weakness and Growing Liquidity
The U.S. Dollar Index (DXY) recently hit its lowest point since February 2022, dropping to around 98.77. A weaker dollar tends to boost crypto prices, especially when global liquidity is on the rise.
As more money flows through the system, digital assets like Bitcoin and Ethereum often benefit.
Bitcoin & Ethereum Price Outlook
As of now, Bitcoin is trading at $90,859, up 4%, with a market cap near $1.8 trillion. But crypto expert Ali Martinez warns of hurdles ahead, as key resistance levels between $95,600 and $98,290 could slow it down. If Bitcoin breaks through, though, the path to $100K might finally open up.
On the other hand, Ethereum is seen trading around $1,695, up 5.5% in the past day. According to Crypto Rover, two big investors (called whales) just bought 4,500 ETH worth $7.36 million.
This shows strong trust in Ethereum and could help push its price even higher—some even believe it might reach $10,000 someday.
The post Why Bitcoin & Ethereum Price Surge Today? Key Reason Behind It appeared first on Coinpedia Fintech News
After weeks of sideways action, Bitcoin and Ethereum are finally showing strong signs of recovery. Bitcoin has jumped to a seven-week high of $91,000, climbing from a recent low of $74,400, a gain of around 22%. But this price jump isn’t just about Bitcoin, Ethereum too, is back in the green, now trading above $1,700 …
XRP price holds strong at $2.13 as the broader market witnesses increased volatility this week. Ripple’s XRP token might soon take off, as the Q1 report notes multiple key wins hinting at a strong 2025. The growing institutional interest in XRP-based products globally and the end of the SEC lawsuit arc have opened the path to a bullish road.
The XRP price trend on the four-hour chart showcases a minor decline from $2.33 to $2.11. This accounts for a 10% drop over the past 7 days. However, XRP price action reveals a falling wedge pattern in motion. This pattern is generally considered to give an upside breakout as the selling pressure diminishes.
Between April 28 to May 6, XRP price action formed two distinctive lower highs and lower lows. Connecting these swing points using trend lines results in a falling wedge setup. This pattern forecasts a 10% rally to $2.36 on a successful breakout above the wedge’s upper trend line at roughly $2.14.
Currently, XRP fluctuates near the 61.80% Fibonacci level at $2.13. Coinciding with the key Fibonacci support, the demand zone extends between $2.13 and $2.14. Due to the short-term decline, the 50 and 200 EMA lines warn of a death cross event in the 4-hour chart.
Furthermore, the 4-hour RSI line is close to hitting the oversold boundary level. This reflects the short-term decline in bullish momentum, leading to the negative cycle within the wedge pattern.
In case of a bullish breakout, once the broader market stabilizes, the Fibonacci levels paint a short-term price target near the $2.50 psychological level. In an optimistic case, the Fibonacci levels extend the price target from $2.75 to $3.15.
Daily XRP Price Chart
On the flip side, the crucial support below the wedge pattern remains the 50% Fibonacci level, coinciding with the $2 psychological mark.
Ripple’s XRP Q1 2025 Market Report
As the XRP price holds above the $2 mark, Ripple recently dropped the Q1 2025 XRP markets report. With multiple key developments in Q1 2025, the report highlights key wins for Ripple’s XRP.
The report highlights the Q1 2025 optimism fueled by positive developments by the U.S. administration. The key milestones highlighted in the report are Trump’s executive order to support crypto, Paul Atkins becoming the SEC chairman, and the bipartisan support for stablecoins.
Starting with institutional support, Franklin Templeton has filed an S-1 form for an XRP-based ETF and the Volatility Shares filing for three XRP ETFs. Furthermore, Brazil’s CVM has approved a dedicated XRP ETF, while CME Group has launched the XRP Futures.
Overall, the XRP investment products saw $37.7 million in weekly outflows, driving the year-to-date inflow to $214 million. The XRP investment product is just $1 million away from overtaking the global Ethereum funds.
Ripple’s XRP Ledger Cools Down in Q1
The on-chain data witnesses a cool-down phase in Q1 2025, a 30-40% decline in both new wallet creation and overall transaction volume on the XRP ledger. Notably, the DEX volume has decreased by 16% on a quarter-to-quarter basis.
Interestingly, Ripple’s stablecoin RLUSD has emerged as one of the key on-chain activity drivers. Its market cap surpassed $90 million, and it has recorded a cumulative DEX volume of more than $300 million.
Ripple’s $1.25 Billion Acquisition of Hidden Road
Additionally, the report boasts of Ripple’s acquisition of Hidden Road, one of the fastest-growing prime brokers in the world. This marks one of the largest acquisition deals in the digital assets space for $1.25 billion.
With the deal, Ripple aims to market its RLUSD stablecoin as an enterprise-grade USD-backed stablecoin with real-world utility. The company will likely leverage its collateral across prime brokerage products. This could make RLUSD the first stablecoin to enable cross-margining between the digital asset space and traditional markets.
Is XRP Price Primed to Reclaim $3?
With growing institutional adoption and primed to potentially bridge the digital asset and traditional market space, Ripple’s XRP might soon take off. Based on the price analysis, the wedge breakout rally could result in a bull run to $3 if the broader market remains stable.


BREAKING: