XRP has been seeing a nice price push lately and at the time of writing, it is up by more than 3%. Trading at $2.43, there are a few reasons why XRP is rallying. .
One of the biggest factors is a new bill being discussed in Missouri called House Bill 594. If it passes, it would let people in the state deduct all capital gains taxes from profits made on things like Bitcoin and XRP. That means if someone makes money trading these, they won’t have to pay taxes on those profits — and that’s huge news for crypto investors in the U.S.
XRP Adoption Continues to Rise in 2025
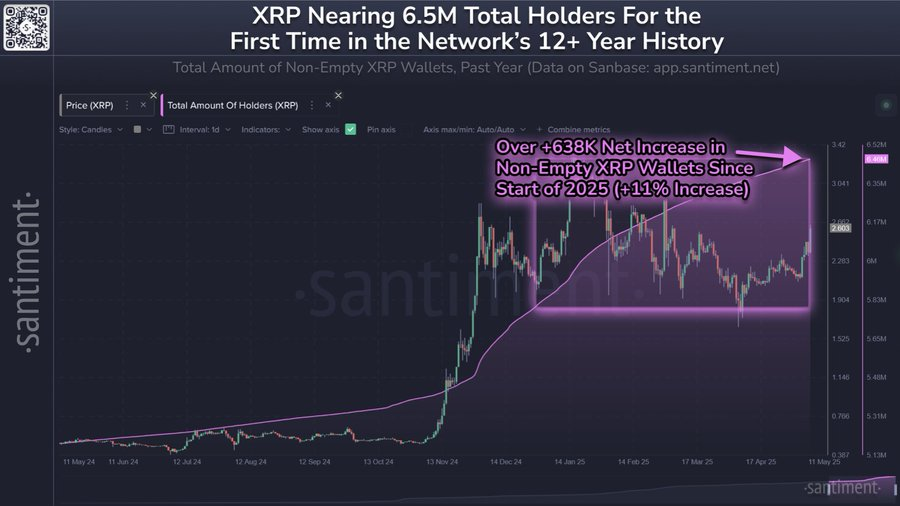
Another reason is that more people are holding XRP than ever before. So far in 2025, the number of XRP holders has gone up by 11%, showing growing interest in the coin.
On top of that, XRP is now being accepted as a payment method on the travel booking site Travala.com. That means people can use XRP to book hotels and flights, giving it more real-world use.
The Ripple team is also making progress on the technology side. XRP is being integrated with Cosmos and building something called EVM sidechains, which basically makes it easier for different blockchains to connect and work together.
Plus, Ripple’s custody service now supports a new system for safer storage called shared MPC wallets. They’re also doing well in the tokenization space — that’s where real-world assets like property or stocks are turned into digital tokens on the XRP Ledger.
Lastly, on the price prediction side, analyst Ali Charts said that if XRP can break out of its current chart pattern, it might jump as high as $15. Right now, technical indicators like RSI and stochastic RSI are showing bullish signals, hinting that a breakout could be coming soon.
Bitcoin price rallied 10% as Trump hinted at a tariff rollback, boosting risk appetite. However, market uncertainty persists, as analyst spots patterns similar to 2019’s US trade war impact.
Bitcoin (BTC) Rally Restarts as Trump Hints at Tariff U-Turn
Bitcoin (BTC) volatility persisted on Wednesday as traders reacted to fresh developments in U.S. trade policy.
Since President Donald Trump announced the creation of a Crypto Strategic Reserve on Sunday, March 2, BTC has traded within 10% ranges for three consecutive days.
After surging 11% following the strategic reserve announcement, Bitcoin’s rally was abruptly halted when Trump confirmed a 25% import tariff on Canada and Mexico, triggering a sharp 15% sell-off on Monday. However, the market took another dramatic turn on Wednesday.
Late Tuesday, U.S. Secretary of Commerce Howard Lutnick stated that President Trump will “probably” reach a compromise with Canada and Mexico in the coming days. Traders responded swiftly, piling into buy orders on optimism that an anticipated tariff rollback could ease economic uncertainty, bolstering risk assets like Bitcoin.
Bitcoin (BTC) Price Action, March 5
Within 12 hours of Lutnick’s statement, BTC surged 10%, rallying from its weekly low of $81,400 recorded on Tuesday to reclaim levels above $91,500 by mid-day in U.S. trading. If bullish momentum holds, a close above $90,000 could reinforce a broader breakout attempt, setting the stage for Bitcoin to target new highs.
Lance Roberts flags Trade war reactions exerting bearish pressure on BTC price action
On Wednesday, BTC price reclaimed territories above the $91,500 level as markets reacted to speculations that US President Donald Trump could ease tariffs imposed on Canada and Mexico.
Bitcoin analyst Lance Roberts published charts showing how US Trade policy has impacted financial markets in recent weeks.
“Trade War 1 vs Trade War 2.
So far, the #market is tracing out Trump’s first trade war fairly closely. While no two markets are ever the same, it is worth noting that even though markets declined, they also rallied. The point here is to ignore media headlines and focus on your portfolio.”
Diving into the chart he posted, Lance Roberts’ chart draws a striking parallel between the S&P 500’s performance during the 2019 trade war and its 2025 trajectory, illustrating how historical market reactions to U.S. trade tensions could be playing out again.
S&P 500 Futures Price Action: 2025 YTD vs. 2019 Trade War | Source: https://x.com/LanceRoberts
In 2019, the market initially rallied before experiencing volatility tied to major trade-related developments.
One key moment highlighted in the chart is when former President Trump called off 25% tariffs on Mexico, triggering a strong rally.
Later, news of Trump-Xi trade deal talks fueled further gains, reinforcing the notion of a “Trump put”—the market’s expectation that
Trump would eventually ease trade tensions to support equities. This de facto put acted as a backstop, preventing prolonged downturns despite interim sell-offs. So far in 2025, the S&P 500 has followed a similar script, with a strong start before recent weakness, aligning with the early phases of the 2019 pattern.
This suggests that while the market is experiencing turbulence amid trade concerns, a potential bullish pivot could occur if Trump signals a shift in policy, just as it did in 2019. If history rhymes, Bitcoin could benefit as a risk asset.
BTC Price Outlook on US Trade War
However, the bearish case remains compelling. Unlike in 2019, today’s market is contending with structurally higher interest rates, which could dampen any relief rallies. Additionally, the Federal Reserve’s policy stance is less accommodative, meaning liquidity injections that cushioned past downturns may not materialize.
Ultimately, whether the 2019 pattern continues to play out in full will depend on the next moves from policymakers.
If trade tensions escalate further without policy relief and risk appetite deteriorates, BTC’s recent gains may prove short-lived, exposing the market to deeper corrections.
Conversely, if Trump eases the tariffs this week, both S&P 500 equities and Bitcoin price could be poised for another leg higher. In this case BTC price could hit new all-time highs near $120,000 once US Treasury begins buying BTC and other assets included in the crypto strategic reserve bucket.
Bitcoin Technical Analysis Today: Close above $90,000 could spark support $100K breakout prospects
Technical indicators on the 12-hour Bitcoin price forecast chart below suggest a close above the $90,000 could confirm a bullish shift in market momentum, especially if Trump officially rolls back the tariffs as widely anticipated.
BTC price has rebounded sharply, gaining 11.46% over the past 24 hours, signaling a resurgence in buyer confidence. The bullish momentum coincides with Bitcoin breaking out of the lower Keltner Channel (KC) boundary, historically a precursor to sustained rallies.
A confirmed move past $90,000 could see the upper KC boundary at $97,487 tested, with $100,000 becoming a psychological magnet if bullish momentum persists.
Bitcoin Price Forecast (BTCUSD) | March 5
However, the Parabolic SAR remains positioned above price action, indicating that downward pressure has yet to be fully negated.
A failure to hold above $88,000 support could see a retracement toward the mid-KC line at $80,210, where buyers may attempt to reestablish control.
Meanwhile, the Bull-Bear Power (BBP) has flipped positive after a prolonged period in the red, reinforcing short-term bullish sentiment.
If BBP sustains its uptrend, further upside pressure could validate the bullish thesis. On the contrary, a sudden reversal in BBP, coupled with rejection at $90,000, might expose Bitcoin to another wave of selling.
Pi Network plunged by double digits over the past week, even as the broader crypto market shows signs of recovery. The altcoin’s market cap dropped to $4.1 billion, as PI continues to see intense selling pressure.
With bearish pressure intensifying, the token could soon revisit its all-time low near $0.40.
PI Risks Deeper Drop
Despite some strength across the broader market, investor sentiment toward PI remains weak, with technical indicators suggesting that its price decline could continue.
The Relative Strength Index (RSI), a key momentum indicator that tracks an asset’s overbought and oversold market conditions, continues to drop, indicating falling demand and growing selling pressure.
At press time, PI’s RSI is in a downtrend at 39.78. This RSI reading indicates weakening momentum and positions the token just above oversold territory, suggesting continued selling pressure could trigger further losses.
Furthermore, Pi Network’s on-balance volume (OBV) has also decreased, pointing to declining accumulation and reduced buyer interest. This indicator is at -1.26 billion at press time, falling by 15% in the past week.
The OBV measures buying and selling pressure by tracking volume flow relative to price movements. When OBV falls like this, more volume is tied to selling than buying. This indicates weakening investor confidence and potential for further price declines.
PI Token Risks Retesting All-Time Low
PI’s plummeting Chaikin Money Flow (CMF) supports the bearish outlook above. At press time, this indicator, which tracks how money flows into and out of an asset, is below the zero line at -0.15.
This negative reading reflects the strength of the sell-side pressure in the PI spot markets. If this trend persists, PI could revisit its all-time low of $0.40.
Another Sunday selloff has hit the crypto market, with Bitcoin (BTC) nearing a retest of its 2025 low around $78,000. Bitcoin is down over 11% in the past week, erasing most of its previous gains. It is currently trading at $82,176, down over 4% in the past 24 hours.
The overall cryptocurrency market experienced a 7% decline, dropping to a valuation of $2.77 trillion. Solana and XRP both saw losses of 7%, while Ethereum fell by 8%, nearing the $2,000 mark. Cardano (ADA) and Dogecoin (DOGE) also were hit harder, falling nearly 7% and 9% respectively.
In the past 24 hours, the market downturn caused $616 million in liquidations, with long positions taking the biggest hit at $540 million. Bitcoin alone saw $231 million in losses.
Trump Says There Might Be Some Disruption
In a recent Fox News interview, President Donald Trump was asked about the possibility of a recession in 2025. He responded cautiously, stating, “I hate to predict things like that,” he said, “There is a period of transition, because what we’re doing is very big — we’re bringing wealth back to America, It takes a little time.”
However, Trump’s Commerce Secretary, Howard Lutnick, firmly dismissed worries about an economic downturn, saying, “Absolutely not,” when asked if Americans should be worried over it.
Trump addressed the potential effects of his policies, including tariffs and budget cuts. When asked about the impact, he acknowledged that there could be some short-term disruptions but emphasized the long-term vision behind his approach.
“There might be some disruption. China has a 100-year plan, while we focus on quarterly results. What we’re doing is laying the groundwork for the future,” he said.
Trump’s Approach Compared To Former Fed Chair’s
Trump’s comments were dubbed “Volckering” on social media, likening his approach to that of former Fed Chairman Paul Volcker in the 1980s. Volcker raised interest rates to extreme levels to combat persistent inflation, fully aware that it would trigger harsh recession. His tough measures eventually broke inflation and set the stage for long-term economic growth. The comparison suggests that Trump’s policies, while disruptive now, could have long-term benefits.
The recent decline in Bitcoin comes as trade tensions between the U.S. and China are set to worsen on Monday, with Beijing imposing tariffs on U.S. agricultural goods in response to President Trump’s latest import hike. This trade war has created significant market uncertainty.
Bitcoin To Revisit Lower Levels!
BitMEX co-founder Arthur Hayes warned that Bitcoin could drop further, possibly revisiting the $78,000 level. He noted that many Bitcoin options are priced between $70,000 and $75,000, which could create more volatility if the price moves into that range.
An ugly start to the week. Looks like $BTC will retest $78k. If it fails, $75k is next in the crosshairs. There are a lot of options OI struck $70-$75k, if we get into that range it will be violent. pic.twitter.com/q4cq0rthGJ
On Friday, Federal Reserve Chairman Jerome Powell stated that the central bank will remain cautious on interest rates while evaluating the impact of Trump’s policies. His comments followed a weak U.S. nonfarm payrolls report, and expectations for at least three rate cuts from the Fed this year.
Traders are now keeping an eye on key economic reports this week, like the U.S. Consumer Price Index on March 12 and the Producer Price Index on March 13. These could impact Bitcoin’s next move.
A Rebound Could Follow Soon?
Bitcoin’s recent price movements have sparked varied reactions among investors. Some view the current dip as a buying opportunity, anticipating that the market will rebound. Conversely, others fear that the downward trend may persist, influenced by broader economic factors.
The crypto market’s recovery depends on factors like the economy, government rules, and price movements. If inflation gets better and the Federal Reserve makes changes, it could boost confidence. Clearer rules for crypto and Bitcoin rising above $95,000 could also help the market recover. However, it’s hard to predict when that will happen, as the timeline remain uncertain.
The post Why is Crypto Market Down Today ? When Will it Recover? appeared first on Coinpedia Fintech News
Another Sunday selloff has hit the crypto market, with Bitcoin (BTC) nearing a retest of its 2025 low around $78,000. Bitcoin is down over 11% in the past week, erasing most of its previous gains. It is currently trading at $82,176, down over 4% in the past 24 hours. The overall cryptocurrency market experienced a …