XRP continues to show strength despite recent market volatility. While Bitcoin experienced sharp moves, XRP’s price action has remained relatively stable. As of now, XRP is trading around $2.20, with strong support forming between $2.17 and $2.23.
Looking ahead to next week, several key economic events could cause short-term swings in the broader crypto market. On Wednesday, investors will closely watch the core PCE inflation report and GDP data, followed by jobless claims and manufacturing PMI on Thursday. Friday’s unemployment data will round out the week. Although this data can trigger intraday volatility, analysts believe it is unlikely to shift XRP’s long-term trend unless results differ significantly from forecasts.
From a technical perspective, XRP remains within a broader trading range, despite recent lower highs and lower lows. Analysts suggest this movement still supports the idea of consolidation rather than a full downtrend. XRP might briefly dip toward $2.05, but a continuation to $2.35 or $2.40 appears more likely if current support levels hold.
Volume for XRP remains relatively low, but its 84% correlation with Bitcoin means it may mirror BTC’s movements in the short term. For now, XRP is holding steady, and unless there is a major shift in macroeconomic data, it may see gradual upward movement in the coming days.
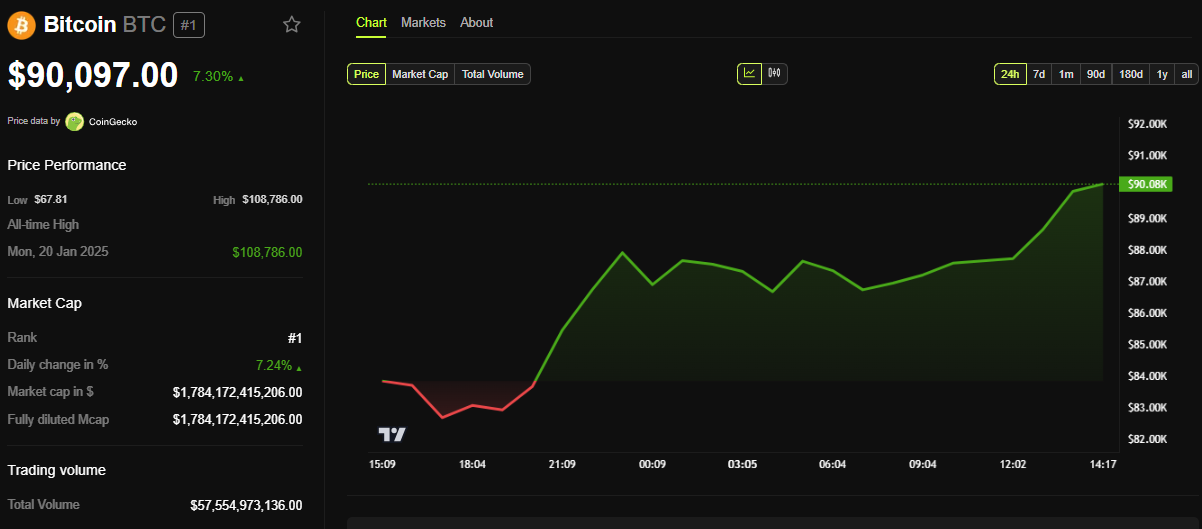
Bitcoin (BTC) surged past the $90,000 mark following reports of its potential preferential treatment in President Donald Trump’s proposed US crypto reserve strategy.
The speculation comes ahead of the White House Crypto Summit, which Trump will host and feature top digital asset industry executives.
Trump’s Bitcoin Reserve Plan Unveiled
Citing Commerce Secretary Howard Lutnick, The Pavlovick Today revealed that the strategic cryptocurrency reserve would be on Friday’s agenda for President Trump’s White House Crypto Summit.
“The President definitely thinks that there’s a Bitcoin strategic reserve. Now there will be the question of, how do we handle the other cryptocurrencies? And I think the model is going to be announced on Friday,” Lutnick reportedly stated.
Reportedly, Trump envisions a strategic Bitcoin reserve, distinguishing it from other cryptocurrencies. Lutnick suggested Bitcoin would receive unique status under Trump’s plans.
“So Bitcoin is one thing, and then the other currencies, the other crypto tokens, I think, will be treated differently—positively, but differently,” he added.
Following this news, Bitcoin reclaimed the $90,000 psychological level, with BTC trading for $90,097 as of this writing. According to BeInCrypto data, this represents a surge of over 7% since Wednesday’s session opened.
The prospective preferential treatment for Bitcoin is unsurprising given its heft as the pioneer crypto. Similarly, its commodity status, like Ethereum (ETH), also positions it for possible privilege.
In a recent Truth Social post, he emphasized his administration’s commitment to elevating the crypto sector. Specifically, Trump announced that the US crypto reserve would include XRP, SOL, and ADA alongside Bitcoin and Ethereum.
However, Lutnick’s comments suggest that Bitcoin may receive special status under the new framework. While Trump’s announcement has fueled bullish sentiment in the Bitcoin market, it has also sparked significant debate.
Some crypto leaders have expressed skepticism about including alternative cryptocurrencies (altcoins) in the US reserve. Critics argue that favoring Bitcoin while treating other tokens differently could create market distortions.
Another major talking point is Ethereum’s role—or lack thereof—in the prospective crypto reserve strategy. The White House Crypto Summit will feature leaders from ecosystems running on Ethereum, but the blockchain lacks representation.
Notwithstanding, the announcement of a strategic crypto reserve has led to speculation about an incoming altseason. Tim Haldorsson, founder of Luna Strategy, told BeInCrypto that Trump’s plan could drive increased investment into altcoins.
However, Henrik Zeberg Jensen, the head of Macroeconomics and fund manager of Swissblock Technologies AG, has a different opinion.
“Trump does not stand as a testimony to or a proof of which tokens will have success. Look at his meme coin [TRUMP]! No usability- and driven by speculation. The success of any token in the long run will be based on the usability of the token in future solutions which will lift productivity and reduce cost. Trump’s picks in that respect seem arbitrary,” Zeberg told BeInCrypto.
Should Bitcoin get preferential treatment in the crypto reserve, altcoins could still benefit. Historically, Bitcoin-led rallies have often paved the way for altcoin surges.
A quiet but steady shift is happening in corporate finance. More public companies are now holding XRP in their balance sheets, joining Bitcoin and Ethereum as part of their long-term reserves. The move marks a growing interest in using XRP due to its speed, low costs, and ability to transfer money across borders almost instantly. With the SEC waiver, Ripple can now bypass legal hurdles that once limited its fundraising, opening doors to growth and expansion.
Crypto lawyer Bill Morgan has been tracking this trend through SEC filings. He recently pointed out that Quantum Biopharma Ltd, which already held Bitcoin, Dogecoin, and Solana, has now added XRP and Ethereum.
Another example is Worksport Ltd, which holds both Bitcoin and XRP. This firm holds both Bitcoin and XRP, and recently doubled its Bitcoin stash. It launched a corporate cryptocurrency strategy back in December 2024 as a hedge against inflation and currency devaluation. Interestingly, it’s already up 15% on its XRP holdings.
Morgan says he has spotted four such companies in just one week, on top of many others revealed over the past few months. For him, it’s a sign that XRP’s corporate adoption is no longer a one-off experiment but part of a broader pattern.
Ripple’s Giant XRP Pile
Ripple Labs isn’t a public company, but it controls a massive 40.7 billion XRP, about 41% of the total supply. If Ripple officially treated this as a treasury reserve, like MicroStrategy does with Bitcoin, it could tighten supply and potentially send prices higher. It would also signal to institutions that XRP is worth holding as a strategic asset.
XRP Over Bitcoin
The end of the long Ripple vs. SEC lawsuit has cleared a major roadblock. Without the legal uncertainty, it’s easier for top public companies holding XRP to add XRP to their balance sheets. Some see it as a way to diversify away from Bitcoin and Ethereum.
Moreover, corporate investments in altcoins other than Ethereum have jumped from $200 million in early 2025 to over $11 billion by July. XRP has been one of the main beneficiaries. Its fast settlement, low transaction costs, and global network through RippleNet make it a strong candidate for cross-border payments and liquidity management.
Earning on Corporate XRP
Even though the XRP Ledger doesn’t have native staking, companies can still put their holdings to work. Options include institutional lending programs, providing liquidity on exchanges, and using platforms like Flare, which allow XRP to be wrapped for smart contract use. These tools turn XRP from a passive reserve into an active, income-generating asset.
Never Miss a Beat in the Crypto World!
Stay ahead with breaking news, expert analysis, and real-time updates on the latest trends in Bitcoin, altcoins, DeFi, NFTs, and more.
The post Bill Morgan Reveals More Public Companies Adding XRP to Their Reserves appeared first on Coinpedia Fintech News
A quiet but steady shift is happening in corporate finance. More public companies are now holding XRP in their balance sheets, joining Bitcoin and Ethereum as part of their long-term reserves. The move marks a growing interest in using XRP due to its speed, low costs, and ability to transfer money across borders almost instantly. …
Meme coins are continuing to observe bullishness in a market which is cooling down following the recent rise. Leading the joke tokens was ConstitutionDAO as it posted a 56% rise.
BeInCrypto has analysed two more such meme coins for investors to watch and the direction in which they are heading.
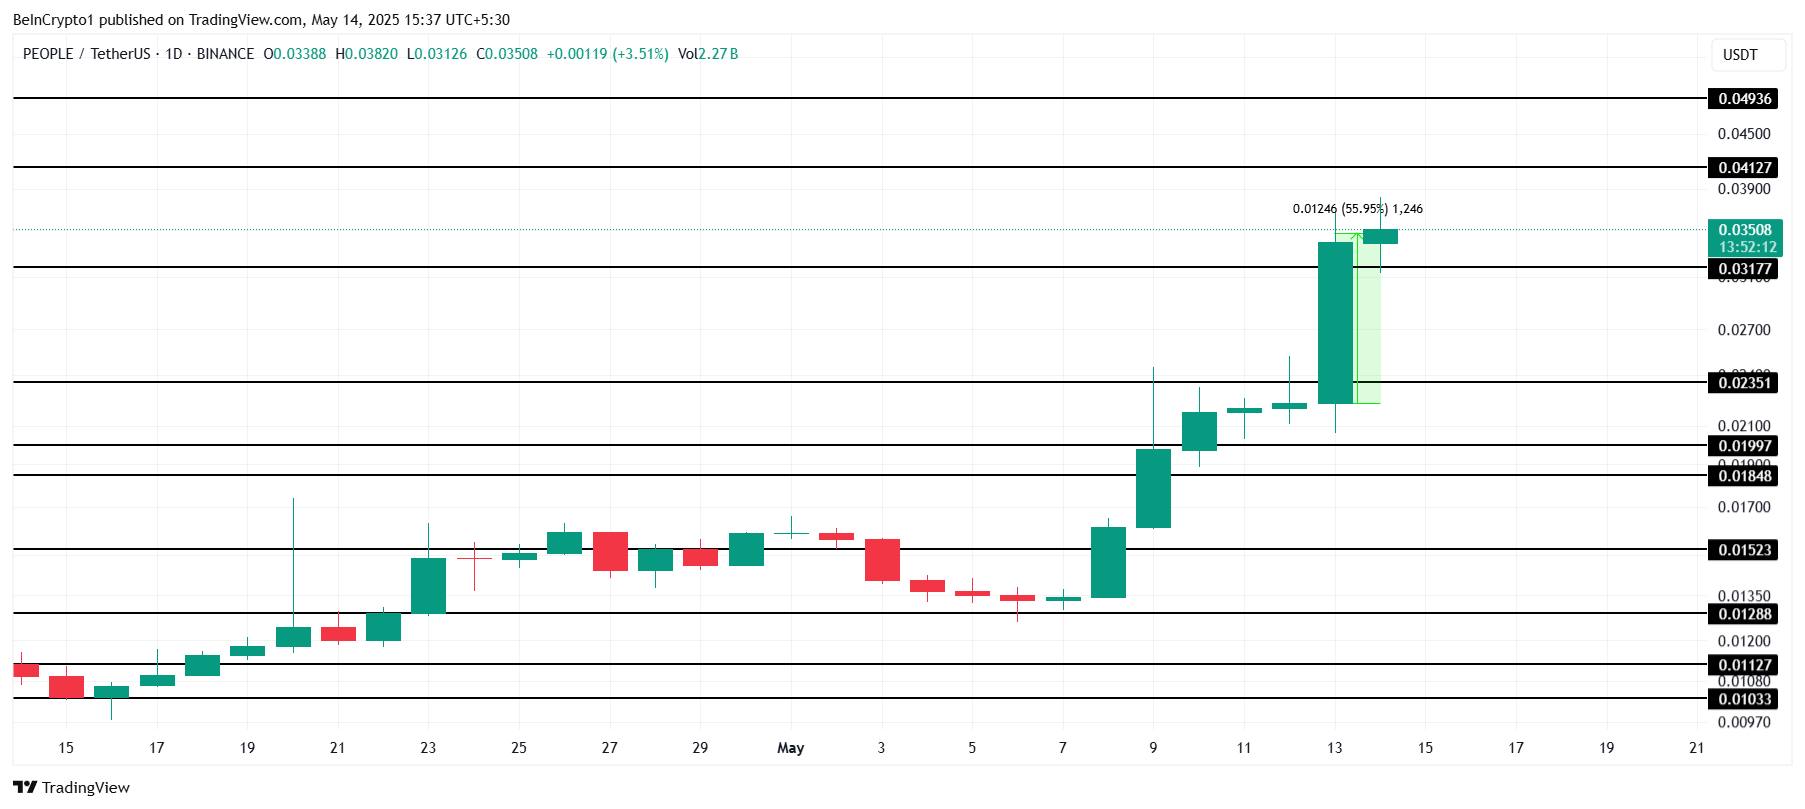
PEOPLE price surged 56% today, making it one of the top-performing tokens. Trading at $0.035, PEOPLE is working to secure $0.031 as a critical support level. This rise highlights increased investor interest and could signal more positive movement if the support level holds strong in the coming days.
Securing $0.031 as support is essential for the meme coin to maintain its bullish momentum. If the token can successfully hold above this level, it has the potential to continue rising. The next target would be $0.041, which could attract more buying pressure and strengthen its position in the market.
If PEOPLE fails to secure $0.031 as support, the altcoin may experience a decline. Increased selling pressure or profit-taking could drive the price lower, possibly reaching $0.023. Such a drop would invalidate the current bullish outlook, affecting investor sentiment and potentially leading to further losses.
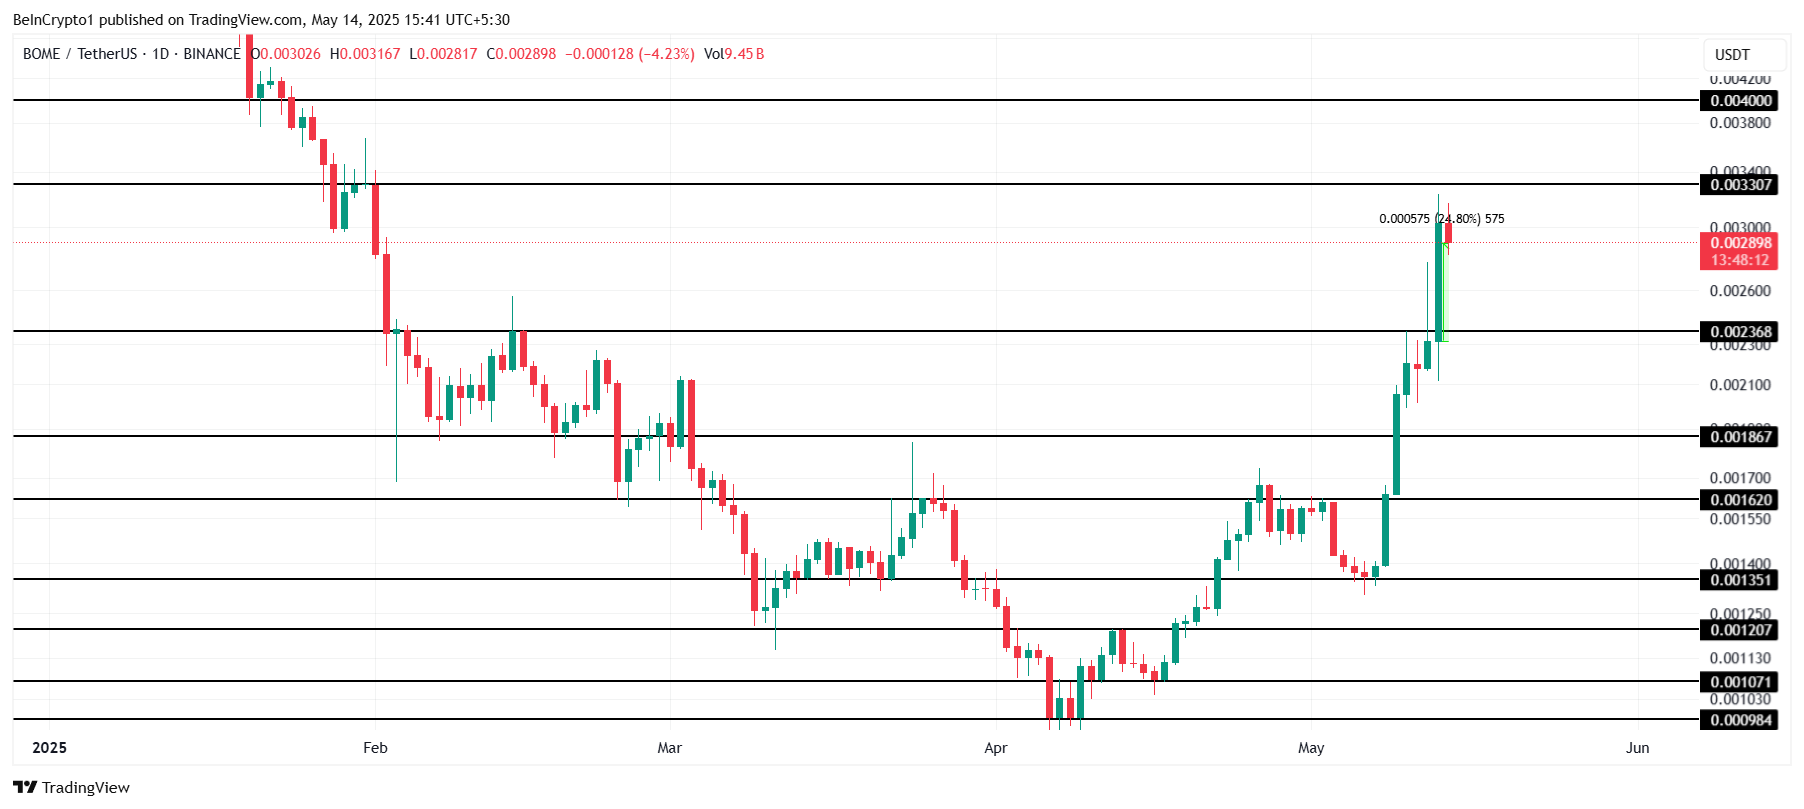
BOME resurfaced this week, showing impressive growth with a 25% rise in the last 24 hours. The meme coin is currently trading at $0.0028 and is facing a key resistance at $0.0033. The price action suggests potential for further upward movement, but this resistance could hinder continued gains.
Despite the recent surge, BOME’s bullish momentum seems to be losing strength. The token appears to be consolidating between $0.0033 and $0.0023, which could limit price movement in the short term. A lack of buying pressure could stall its rally, causing it to remain in this range for now.
If broader market conditions remain positive, BOME may break through the $0.0033 resistance. This could trigger a further rally, pushing the price toward $0.0040. Such a move would invalidate the bearish outlook and attract more investors, strengthening its position in the market.
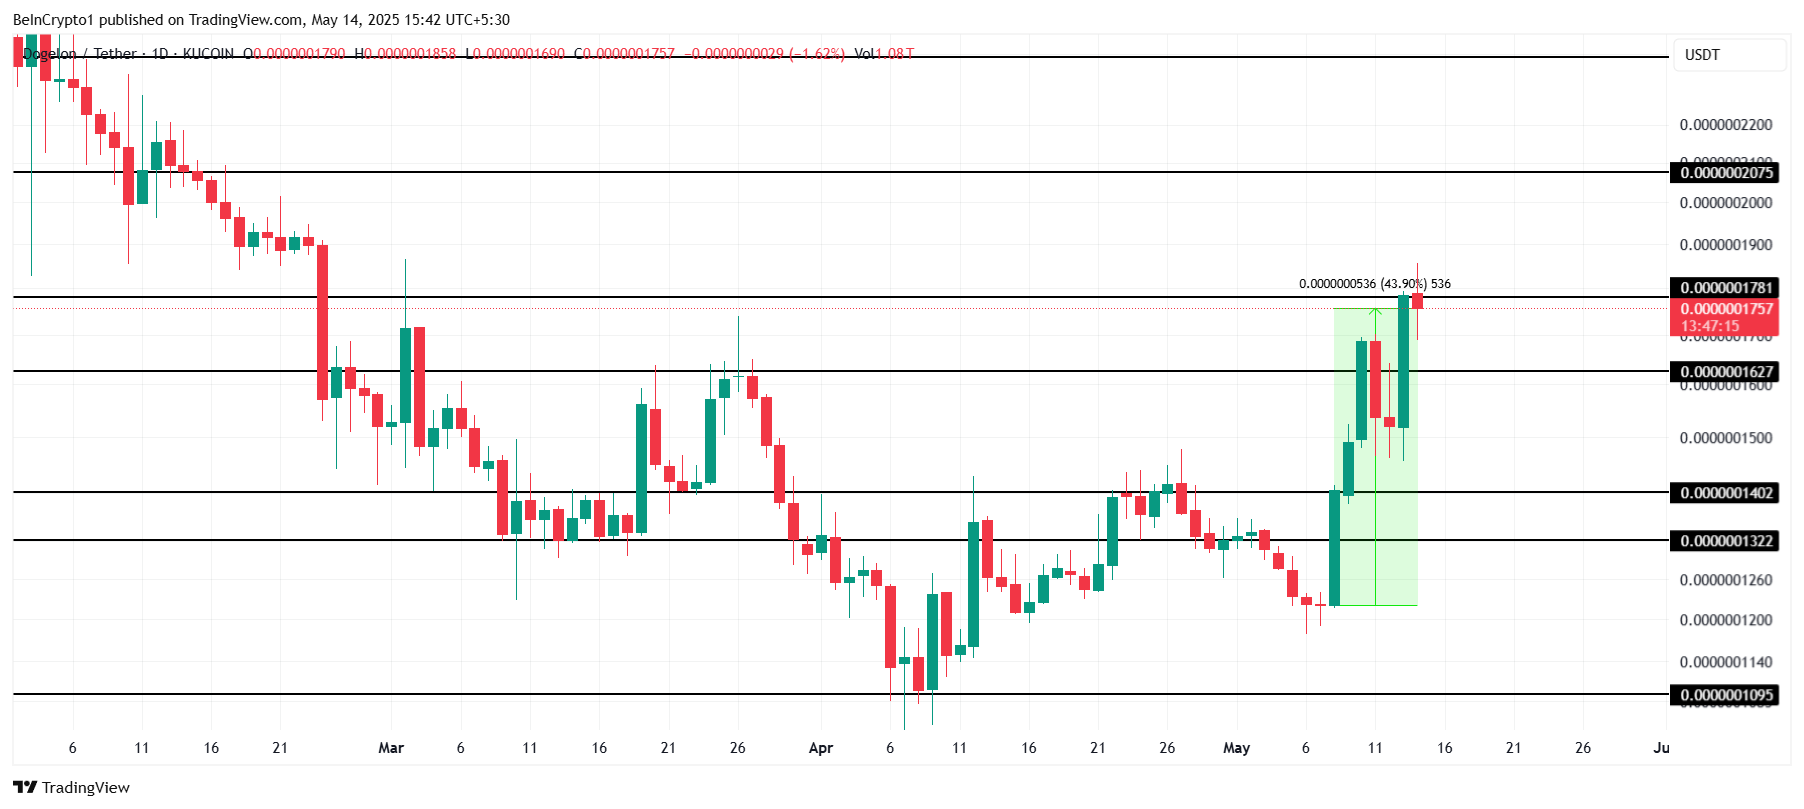
ELON is currently trading at $0.0000001757, just below the resistance level of $0.0000001781. The meme coin is tracking broader market trends, but it is showing positive signs with a growing number of holders. As of now, the total number of ELON holders stands at 162,419, indicating increasing investor interest.
ELON has demonstrated strong performance in the past, earning its place as a reliable token. To reach its target of $0.0000002075, the coin needs to flip the $0.0000001781 resistance into support. Securing this level would pave the way for further upward movement and attract more investors to the token.
If ELON fails to secure $0.0000001781 in support, it may experience a reversal. A drop below $0.0000001627 could lead to a further decline, potentially reaching $0.0000001402. This would invalidate the current bullish thesis and shift market sentiment away from the meme coin.