XRP has outperformed Bitcoin by a staggering 277% over the past year, despite not having major XRP ETFs approved and without Defi opportunities. An expert shares that this could only be the beginning of a much greater surge to come. XRP Outpaces Bitcoin by 277% Despite Challenges Crypto analyst Kyle Chassé has recently spotlighted XRP’s
Ray Dalio, the billionaire founder of Bridgewater, has issued a stark warning that the global monetary order is “on the brink” of collapse.
He pointed to the current administration’s tariff policies as a significant catalyst, arguing that they have fueled deglobalization trends and caused severe trade imbalances.
Ray Dalio’s Warnings: The Coming Challenges to US Economic Superiority
The US tariff on most Chinese imports has risen to 145%. In retaliation, Beijing has imposed a 125% tariff on American goods. While reports have circulated that de-escalation could be expected soon, nothing has been confirmed yet.
In his latest essay, Dalio delves deeper into this dynamic, arguing that even if negotiations result in de-escalation, it may not fully undo the damage already inflicted.
“Some people believe that the tariff disruptions will settle down as more negotiations happen and greater thought is given to how to structure them to work in a sensible way. However, I am now hearing from a large and growing number of people who are having to deal with these issues that it is already too late,” he wrote.
Dalio highlighted that exporters and importers worldwide are now forced to reduce their dealings with the US drastically. He noted that both American and Chinese producers and investors are actively seeking alternative plans to minimize interdependence.
He believes this trend is becoming broadly recognized across trade, capital markets, geopolitical, and military relations. Dalio argued that the world is nearing a breakdown of monetary, domestic, political, and international order due to unsustainable fundamentals. This situation mirrors past historical shifts in global orders.
“Though not yet fully realized, it is also increasingly being realized that the United States’ role as the world’s biggest consumer of manufactured goods and greatest producer of debt assets to finance its over-consumption is unsustainable, so assuming that one can sell and lend to the US and get paid back with hard (i.e. not devalued) dollars on their US debt holdings is naive thinking, so other plans have to be made,” Dalio remarked.
The billionaire investor expressed concern that the US risks being bypassed as other countries adapt to these separations, establishing new trade networks and economic “synapses” that exclude the US. This shift could further erode trust in the US dollar, which is already losing ground amid global economic uncertainty.
While he did not specify which currencies might gain prominence, Dalio has previously advocated for “hard money” assets like Bitcoin (BTC) and gold as hedges.
“I want to steer away from debt assets like bonds and debt, and have some hard money like gold and Bitcoin,” Dalio said during the Abu Dhabi Finance Week (ADFW) in December 2024.
Global Monetary System at Risk: Is Bitcoin the Solution?
The warning has resonated within the cryptocurrency community. Jeff Park, Head of Alpha Strategies at Bitwise, stated that Dalio’s recent comments signal a looming “dedollarization” threat.
Park emphasized that Dalio’s shift from supporting China to acknowledging US economic imbalances suggests the global move away from the US dollar is approaching faster than many anticipate, a concept long recognized by Bitcoin advocates.
“The dedollarization threat is nearer than you and I know,” Park wrote.
Similarly, another expert asserted that the conditions Dalio describes create an ideal environment for Bitcoin. Rex believes these developments could drive Bitcoin to surge significantly within the next 18 months, potentially exceeding market expectations.
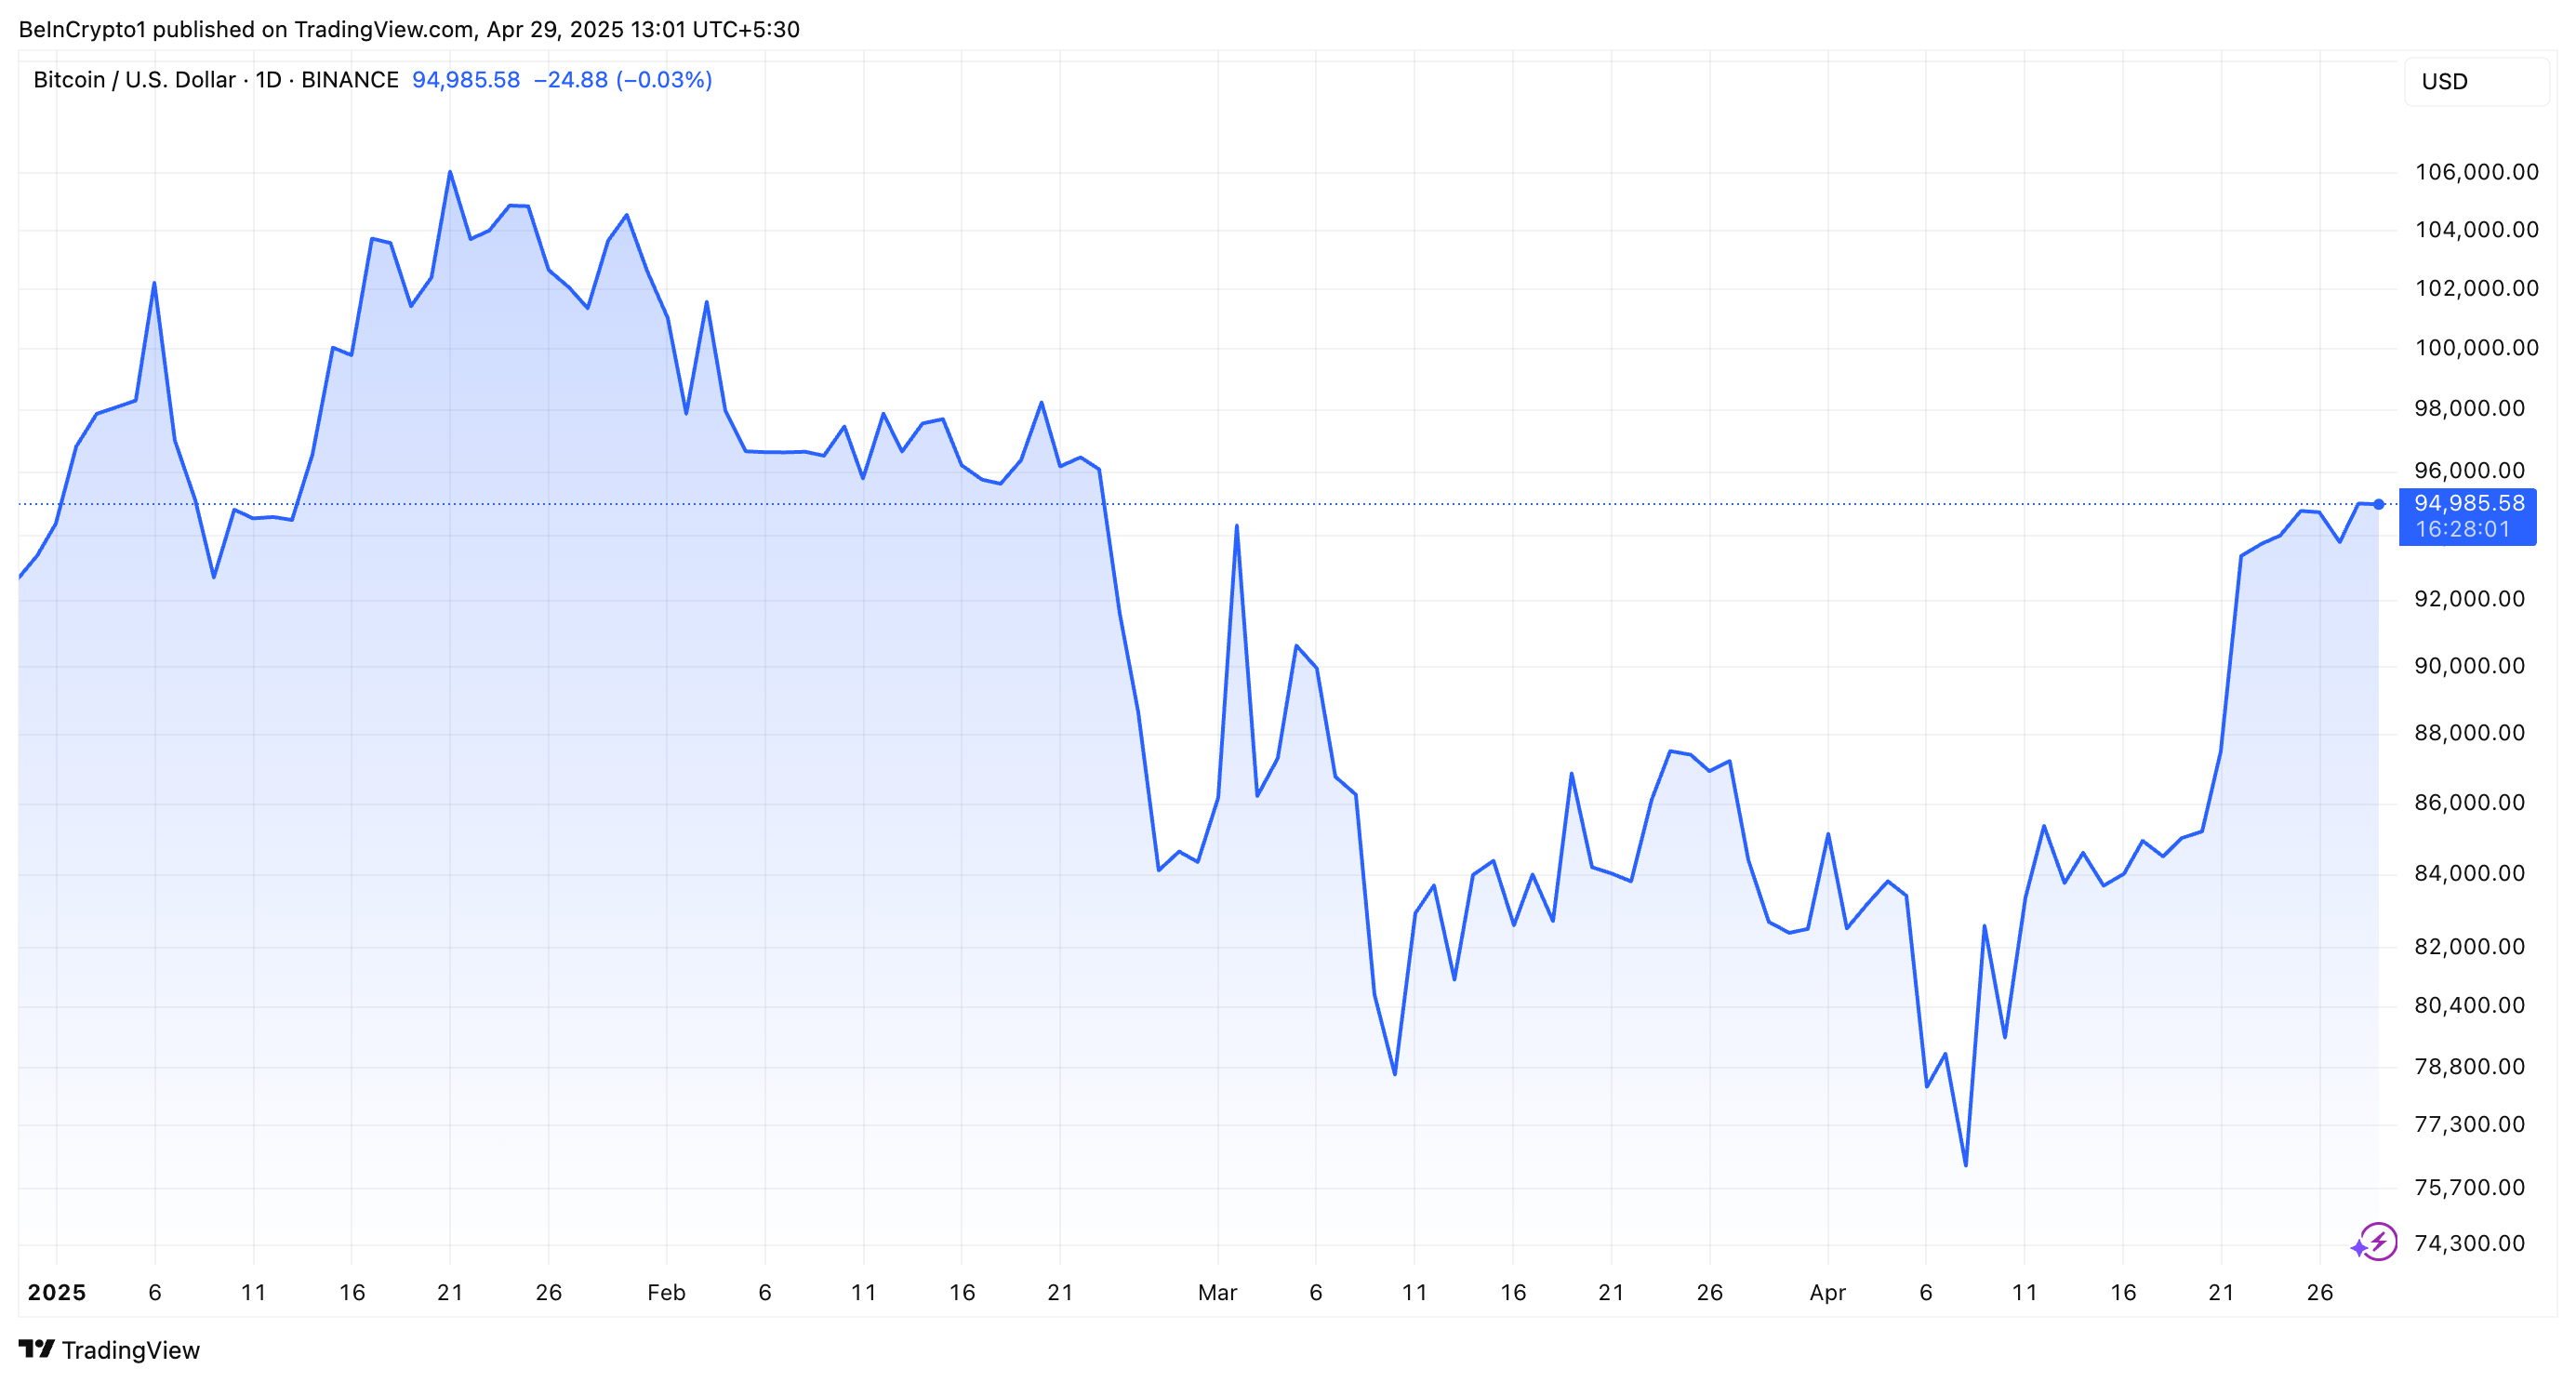
This impact is already quite visible as BTC’s value has recovered amid a dropping dollar. Over the past week, it has appreciated by 7.5%. At the time of writing, BTC was trading at $94,985.
In fact, market watchers are increasingly bullish on BTC, predicting higher price targets for the largest cryptocurrency. Last week, ARK Invest raised its BTC price forecast from $1.5 million to $2.4 million by 2030. Meanwhile, experts’ forecasts for BTC range from $150,000 per coin to a more optimistic $1 million by the end of 2025.
Bitcoin is back to $105,900 after the Israel-Iran ceasefire on Tuesday. However, sudden panic and FUD from newer Bitcoin whales are increasingly fueling volatility for the largest cryptocurrency.
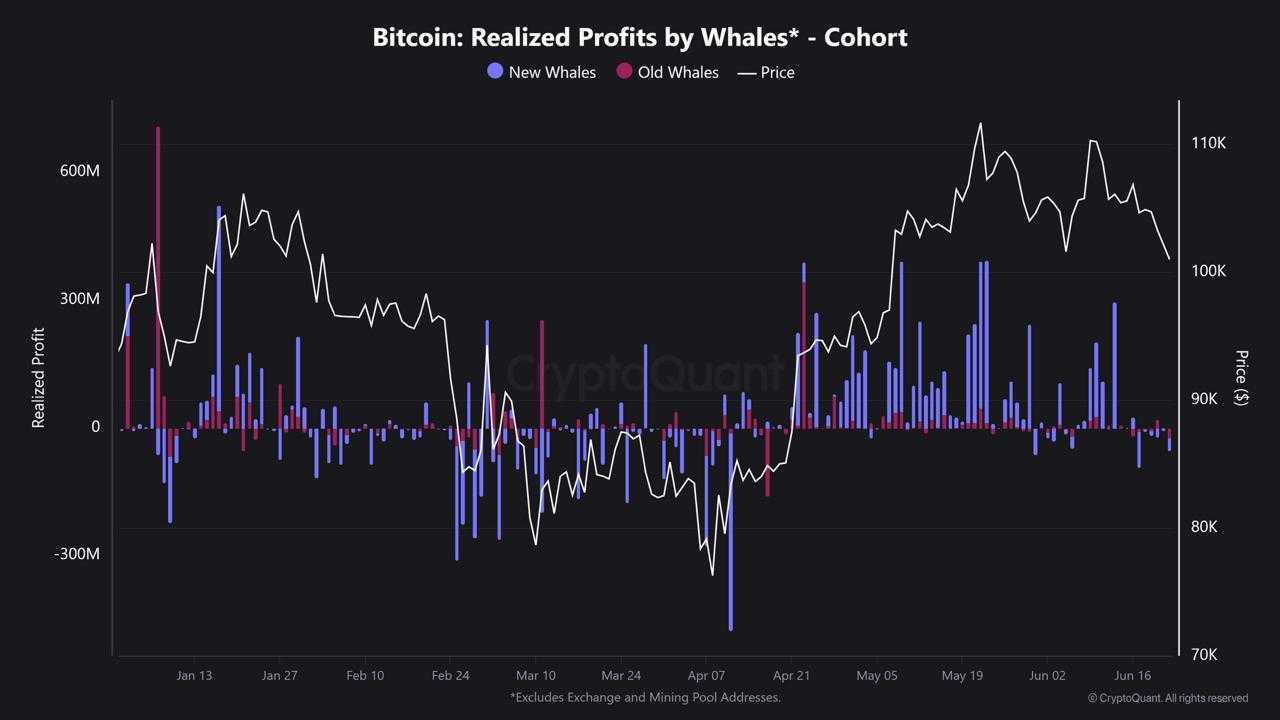
CryptoQuant highlights large realized losses by new whales as a key driver. These investors have sold Bitcoin aggressively under pressure, amplifying market downturns.
How New Whales Drive Bitcoin’s Recent Price Swings
Between June 14 and June 22, whales realized approximately $228 million in Bitcoin losses, according to CryptoQuant analyst JA Maartunn. A significant spike occurred on June 17, with $95 million in losses in a single day.
Most of these losses—nearly $85 million—came from new whales, compared to only $8.2 million from older whale investors.
Another notable spike appeared on June 22, totaling $51 million, more evenly split between new and old whales.
New whales, who recently entered at higher price levels, appear more prone to panic selling amid geopolitical tensions. Their rapid exits intensify price swings and reinforce resistance at critical levels, particularly near $111,000.
Exchange Whale Ratio Shows Selling Pressure
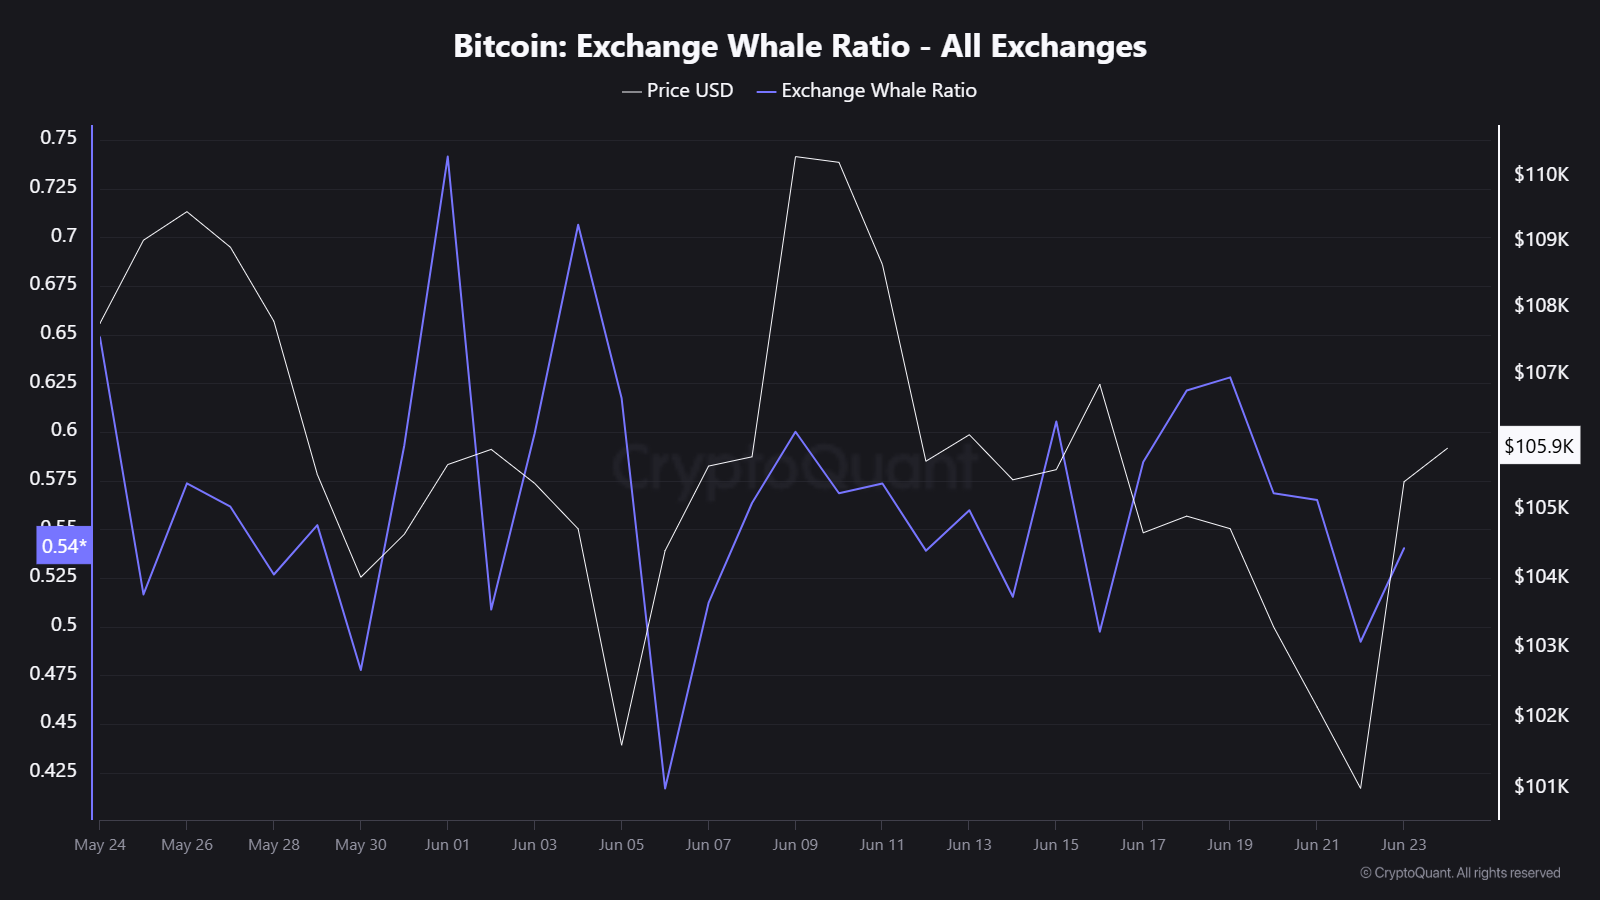
Further supporting this trend, CryptoQuant’s Exchange Whale Ratio remained elevated through much of June.
This indicator is a measure of whale activity on exchanges. A high ratio indicates whales actively depositing Bitcoin to exchanges, typically ahead of selling.
Data shows this ratio rising around Bitcoin’s attempts to break above $110,000. Whales appeared to prepare sell orders at this level, limiting potential upward momentum.
The ratio briefly fell as Bitcoin dipped below $102,000, then climbed again when prices rebounded toward $105,900.
Newer whale investors seem especially sensitive, reacting quickly to negative headlines.
Such rapid selling triggers further volatility. Leveraged traders face margin calls, amplifying price declines and hindering sustained upward momentum.
There’s a lot of chatter around Ethereum price; will it break $4,000, or is another collapse brewing? The bears seem to be winning this round. Over the last 7 days, the ETH price has shed more than 8.6% and currently trades around $3,533, still 27.1% off its all-time high.
But beneath the surface, the data paints a different picture: one where the smart money may have already set the trap. Three clear signals and a bullish pattern suggest Ethereum’s recent breakdowns might be nothing more than an orchestrated bear trap.
Whale and Retail Concentration Flip Bullish
The first signal comes from Ethereum’s on-chain concentration metrics. Over the last 30 days, whale holdings have risen by 1.82%, while retail wallets (small holders) have increased exposure by 1.87%. In most cases, whale moves end up outweighing investor and retail movements due to the sheer size of trading.
And this time, it seems that retail is following the ETH whales, possibly leaving investors or mid-size folks in a trap of sorts.
Interestingly, mid-size investor wallets have offloaded, potentially hinting at redistribution toward the extremes; whales and retail, two groups known for having very different motives, but both seem confident here.
ETH price and whale-retail positioning: IntoTheBlock
Adding weight to this view is IntoTheBlock’s Bull vs Bear address chart, which doesn’t use typical sentiment metrics. Instead, it tracks wallet behavior: bulls are those that have bought over 1% of daily traded volume, while bears have sold at least 1%.
Over the last 7 days, bulls outnumber bears by 7: a slim edge, but enough to suggest conviction is leaning toward accumulation, not distribution.
For token TA and market updates: Want more token insights like this? Sign up for Editor Harsh Notariya’s Daily Crypto Newsletter here.
Long/Short Account Ratio Shows Traders Leaning Bullish
Despite the sideways action and frequent dips, traders haven’t flipped bearish yet. According to Binance’s long-short account ratio, Ethereum’s metric currently stands at 1.91, meaning there are nearly twice as many long accounts as short ones.
It’s important to note: this isn’t the same as the long/short position volume ratio. The account ratio measures the number of user accounts holding long vs. short positions, not just trade size.
This data, taken over the past 24 hours, suggests that more traders expect upside continuation, even as the price chops around near key resistance. Historically, similar ratios have held just before major directional moves.
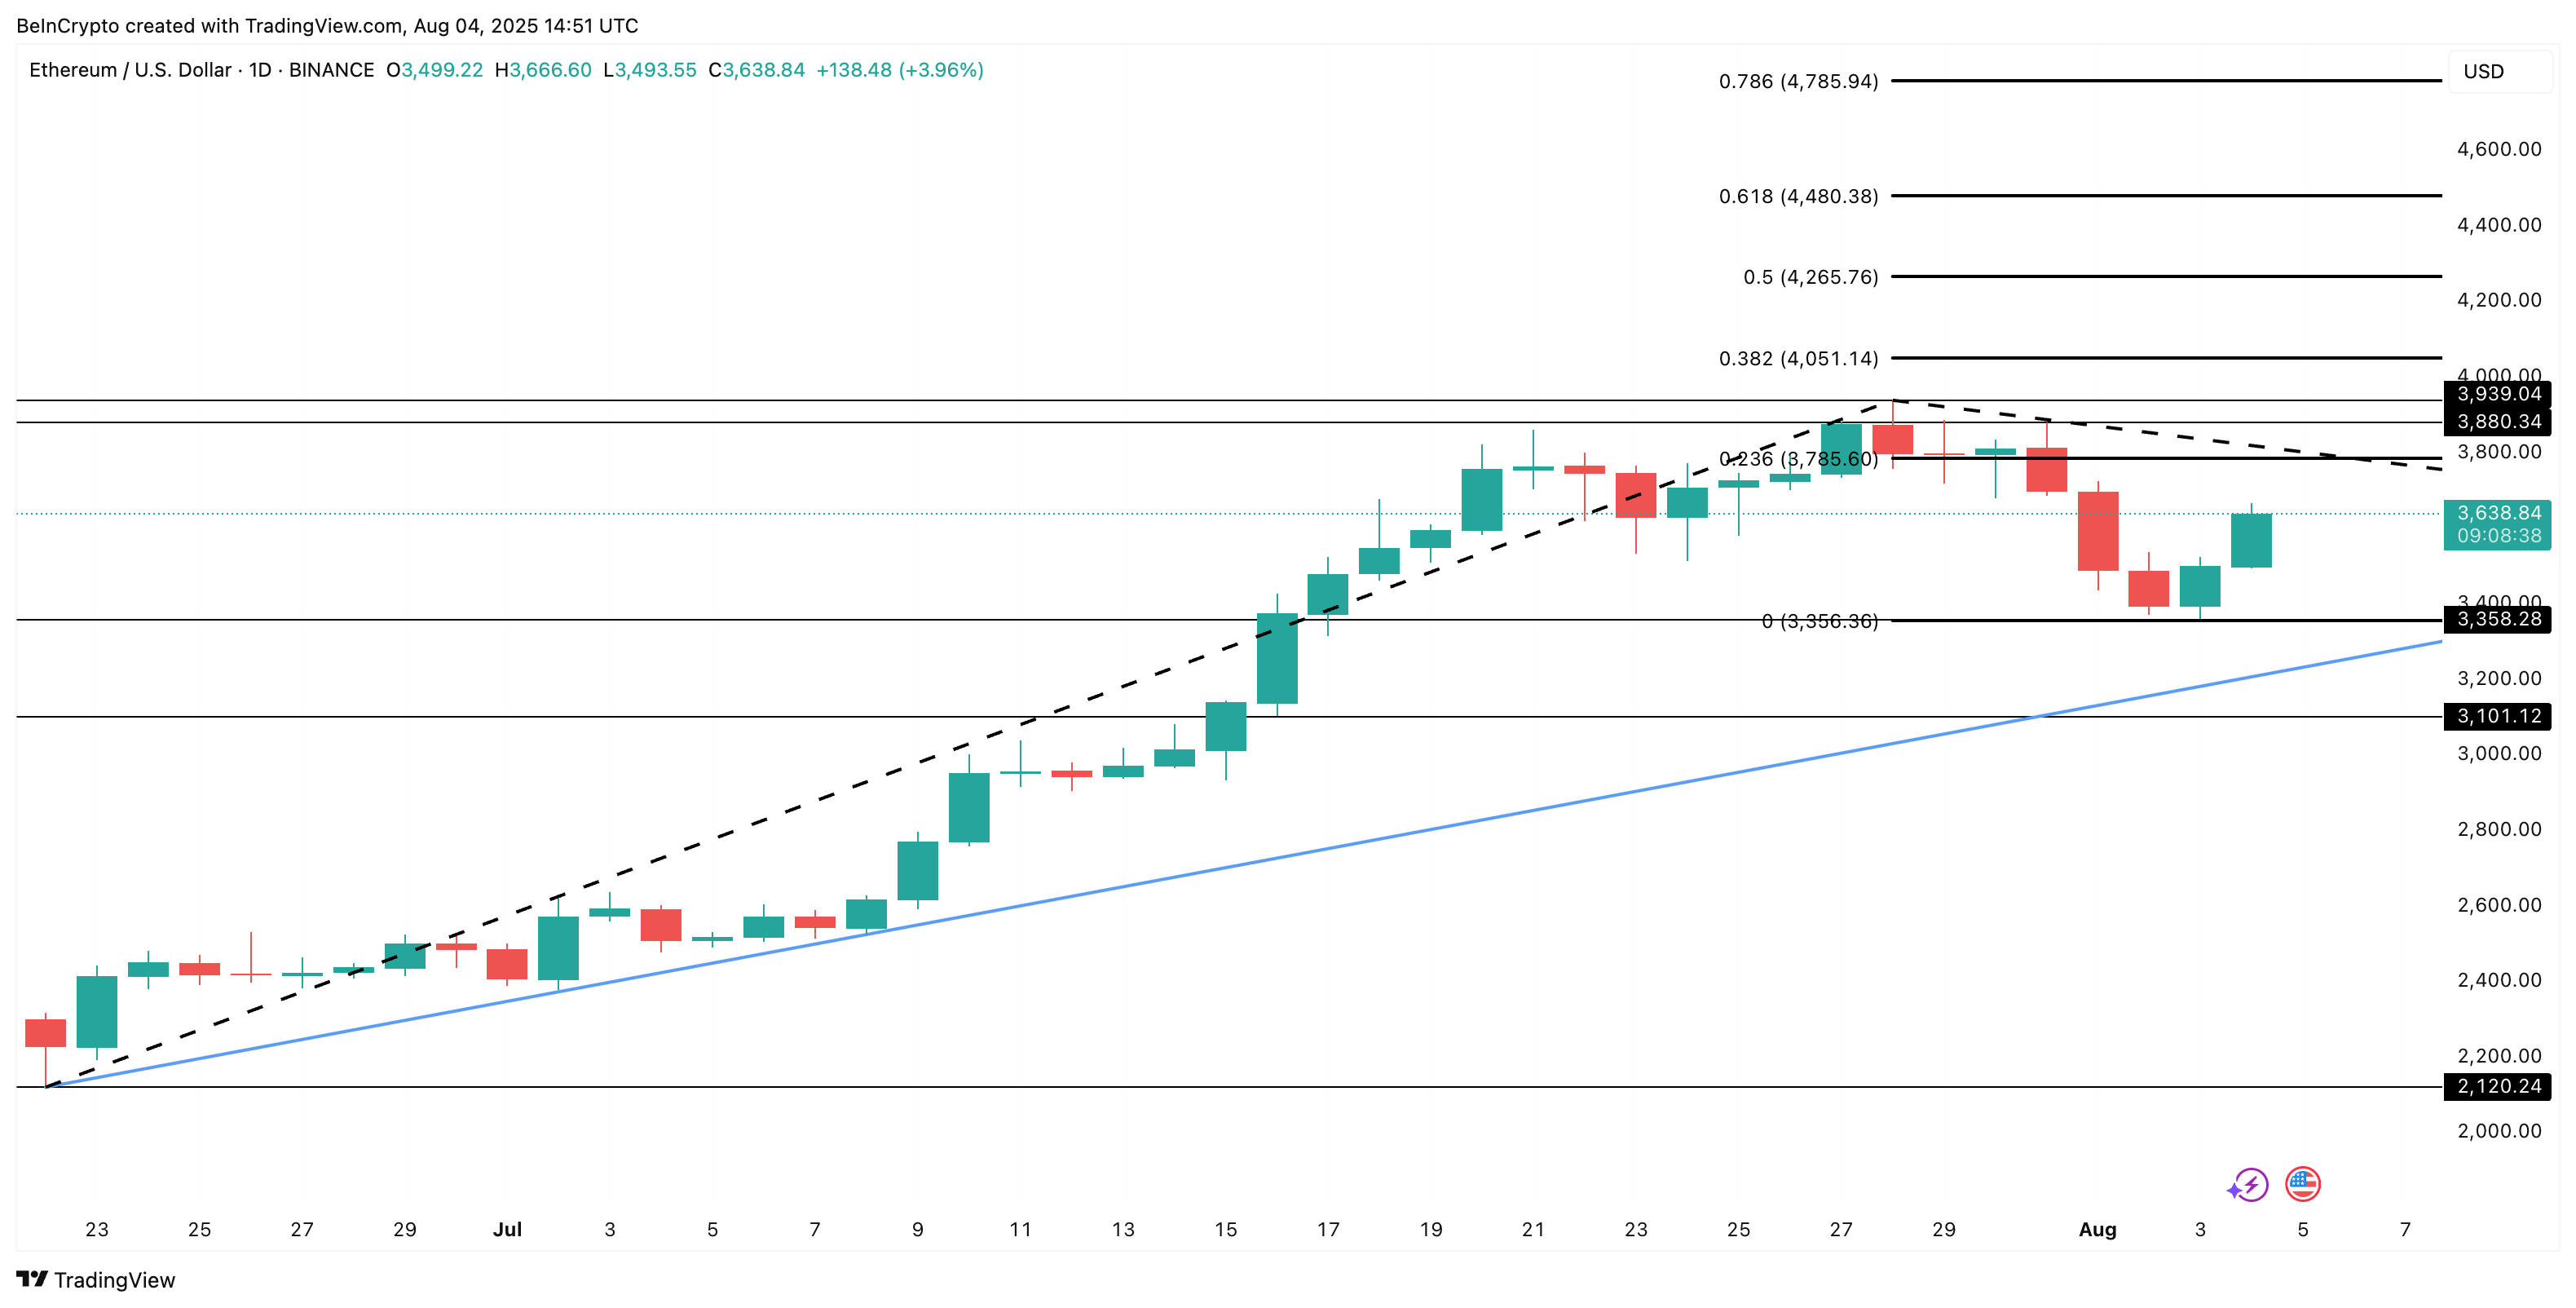
Bullish Triangle Still Intact After Testing Key Ethereum Price Support
The most visually telling part of the Ethereum price structure is its bullish (ascending) triangle pattern on the daily chart. After an explosive move from the $2,120 low to $3,939, Ethereum entered a tight consolidation range. The 0.236 Fibonacci trend extension level, or the $3,785 price level, tried offering support but was quickly broken.
A long red candle followed, corresponding to the timeframe when ETH short positions took center stage. Even ETH selling intensified post the drop, with traders supposedly assuming that even the $3,356 support would be broken. And guess what, that support line was tested briefly.
The line was tested yesterday, aligning with the Smart Trader opening a short position. But then, the price rebounded, and would have already liquidated the trader. One bear trapped!
It won’t be wrong to assume that many similar short positions were opened.
Smart trader 0xCB92 is doubling down on his $ETH short!
His position has now reached 50,000 $ETH($171.7M) with over $10M in unrealized profit.
However, if the daily candle closes above $3,785, ETH price might just have the legs to test $3,939 and then $4,051, with the move to the latter qualifying as a clean breakout.
But then, if the key support of $3,356 is ultimately broken, the bullish hypothesis gets invalidated