The long-running legal battle between Ripple and the U.S. SEC has kept the crypto world on edge. While the SEC recently dropped cases against major firms like Coinbase and Kraken, many wonder if Ripple could be next. In an ongoing discussion, pro-XRP lawyer Jeremy Hogan has hinted that a resolution could come to an end as early as March.
XRP Lawsuit Coming To An End in March?
Legal expert Jeremy Hogan has dropped a major hint about a possible early resolution in the XRP lawsuit, sparking excitement among investors.
Meanwhile, in an ongoing discussion, a community member asked Hogan whether the SEC’s recent trend of dropping lawsuits could lead to a quick resolution for Ripple in March, with the injunction issue handled later.
Yes, but I’d wait until eveything is hashed out before dismissing the appeals. This all has to be done very carefully.
Hogan responded that an early dismissal is possible but warned that all legal matters must be fully settled before celebrating.
Adding to the buzz, Hogan also revealed that Ripple CEO Brad Garlinghouse might attend the White House Crypto Summit. While some questioned the accuracy of this claim, Hogan stood firm, fueling further speculation about a potential game changing moment for Ripple.
What’s Next for Ripple Lawsuits
The SEC filed its opening appeal on January 15, 2025, and Ripple has until April 16 to respond. Legal experts, including Hogan, have pointed to the injunction on XRP sales as a key reason why the case is still ongoing. Some theories suggest Ripple is trying to lift regulatory restrictions before settling.
While the exact reasons for the SEC’s continued pursuit of Ripple remain unclear, one thing is clear this lawsuit is more complex than others the SEC has recently dropped.
Ethereum (ETH) is showing mixed signals as it hovers near a critical technical zone, with traders closely watching for a breakout or breakdown. On one hand, the BBTrend has flipped sharply bullish, jumping to 4.99 after hitting -3 just a day earlier—suggesting growing upside momentum.
On the other hand, whale activity continues to decline for the seventh consecutive day, a potential sign of weakening institutional confidence. With ETH stuck between strong resistance at $2,900 and key support at $2,679, the next move could define the short-term market direction.
Ethereum BBTrend Flips Bullish: What 4.99 Means for Price Action
Ethereum’s BBTrend has surged to 4.99, rising sharply in the past few hours after hitting a negative peak of -3 just yesterday.
This sudden momentum shift suggests a potential reversal from bearish to bullish conditions, as the trend strength has turned positive and is now approaching the upper threshold that typically signals a breakout scenario.
BBTrend, or Bollinger Band Trend, measures the directional strength of price movement relative to the Bollinger Bands. Values above 0 indicate upward momentum, while values below 0 suggest bearish pressure.
A reading around 4.99 indicates strong bullish momentum. If this trend holds or strengthens, it could signal further upside for ETH as traders interpret the move as a shift in market sentiment and positioning.
ETH Whale Count Declines for 7 Straight Days: Bearish Signal Ahead?
The number of Ethereum whales—wallets holding between 1,000 and 10,000 ETH—has steadily declined to 5,378, down from 5,427 just ten days ago and 5,400 three days ago.
These whales often gauge institutional or high-net-worth investor sentiment, and sustained reductions in their numbers typically indicate either profit-taking, risk reduction, or decreased confidence in near-term price action.
Tracking whale activity is crucial because these large addresses have the power to influence market trends through their trades. When whale counts increase, it’s often interpreted as accumulation, which can signal strong conviction in future price growth.
This behavior can weaken price support and lead to increased volatility. If the downtrend in whale count continues, it could place downward pressure on ETH and increase the risk of a broader market pullback.
Ethereum Approaches Critical Support as $2,900 Resistance Holds
Ethereum recently failed to break through the resistance near $2,900 and is now trending lower, approaching a key support level at $2,679. If this support is tested and fails to hold, the next downside targets are $2,479 and potentially $2,326, especially if bearish momentum accelerates.
These levels are critical, as a confirmed break below them would indicate a shift in short-term market structure and could trigger further selling pressure.
With whale activity declining and market sentiment appearing cautious, Ethereum is now at a technical crossroads.
On the flip side, the BBTrend indicator has shown a strong bullish reversal, suggesting buying pressure may be building. If Ethereum regains momentum and successfully retests and breaks the $2,900 resistance, it could open the door for a rally toward $3,000—a level not seen since February 1.
Such a move would likely reinforce bullish sentiment and attract renewed interest from sidelined traders.
However, for that scenario to play out, bulls must first reclaim lost ground and flip $2,900 into a solid support zone.
HBAR has recently experienced a significant price correction, pulling the altcoin to a critical support level. As the market conditions continue to show weakness, the price action has left HBAR vulnerable.
However, this downside movement might be offering short traders a chance to avoid heavy liquidation losses.
Hedera Traders Stand To Lose A Lot
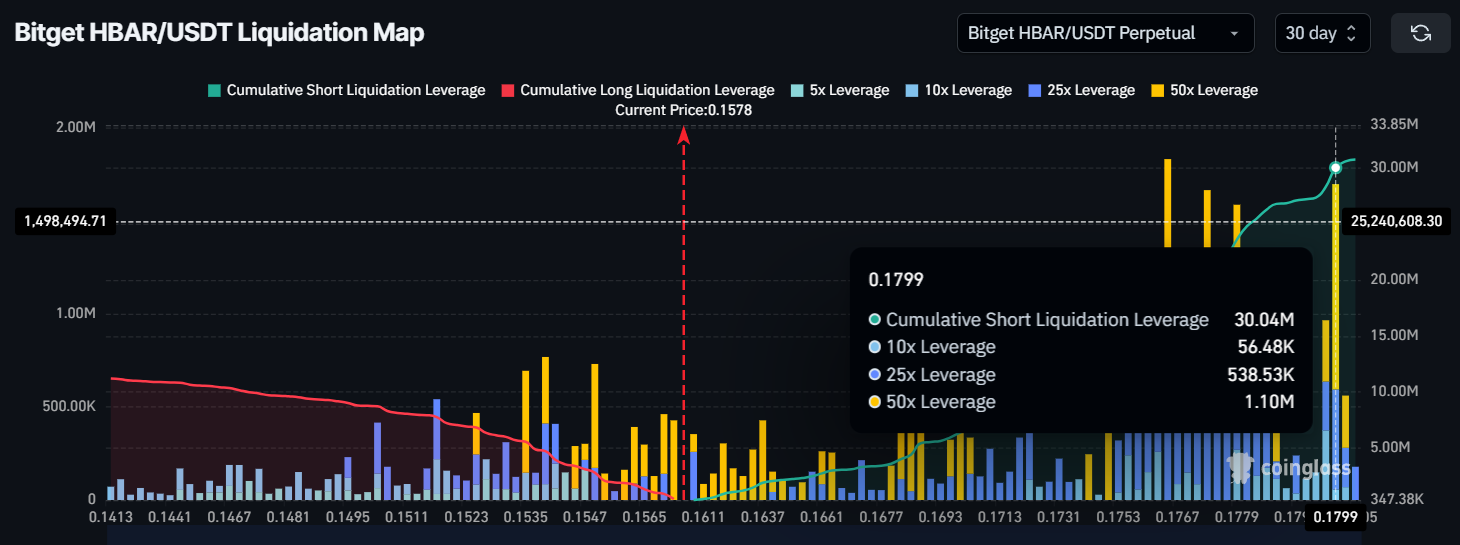
The liquidation map indicates a situation of concern for short traders. Approximately $30 million worth of short contracts are poised for liquidation if the HBAR price rises to $0.18. This could cause massive losses for traders who are betting against the asset. However, the current price range near $0.157 has provided some relief as the market struggles to breach lower support levels.
If HBAR maintains its position above key levels, these traders may be spared the liquidation risk for now. Despite the challenging market conditions, this scenario actually provides a buffer for traders, helping them avoid significant losses.
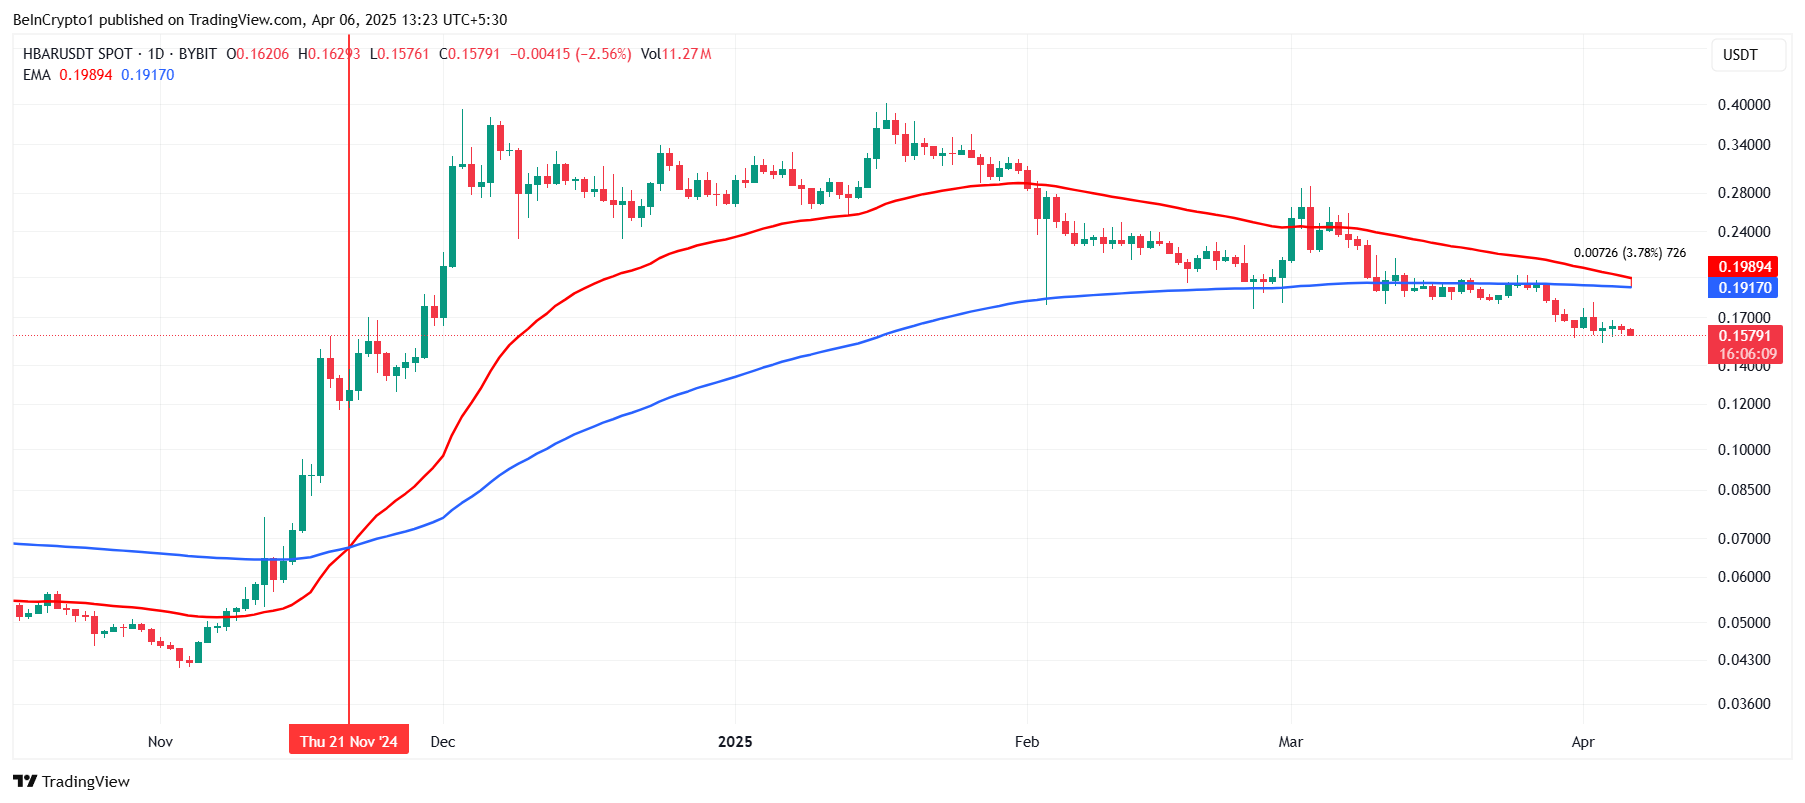
The overall macro momentum for HBAR shows signs of potential downside pressure as the cryptocurrency approaches a Death Cross. The 200-day exponential moving average (EMA) is just over 3% away from crossing the 50-day EMA.
This technical formation, when confirmed, signals a possible continuation of the bearish trend and could push HBAR further down in the coming days.
The close proximity of these two EMAs has increased the chances of the Death Cross, which could result in further losses for HBAR holders. The market’s lack of substantial improvement and the growing uncertainty surrounding price action contribute to the likelihood of the Death Cross forming.
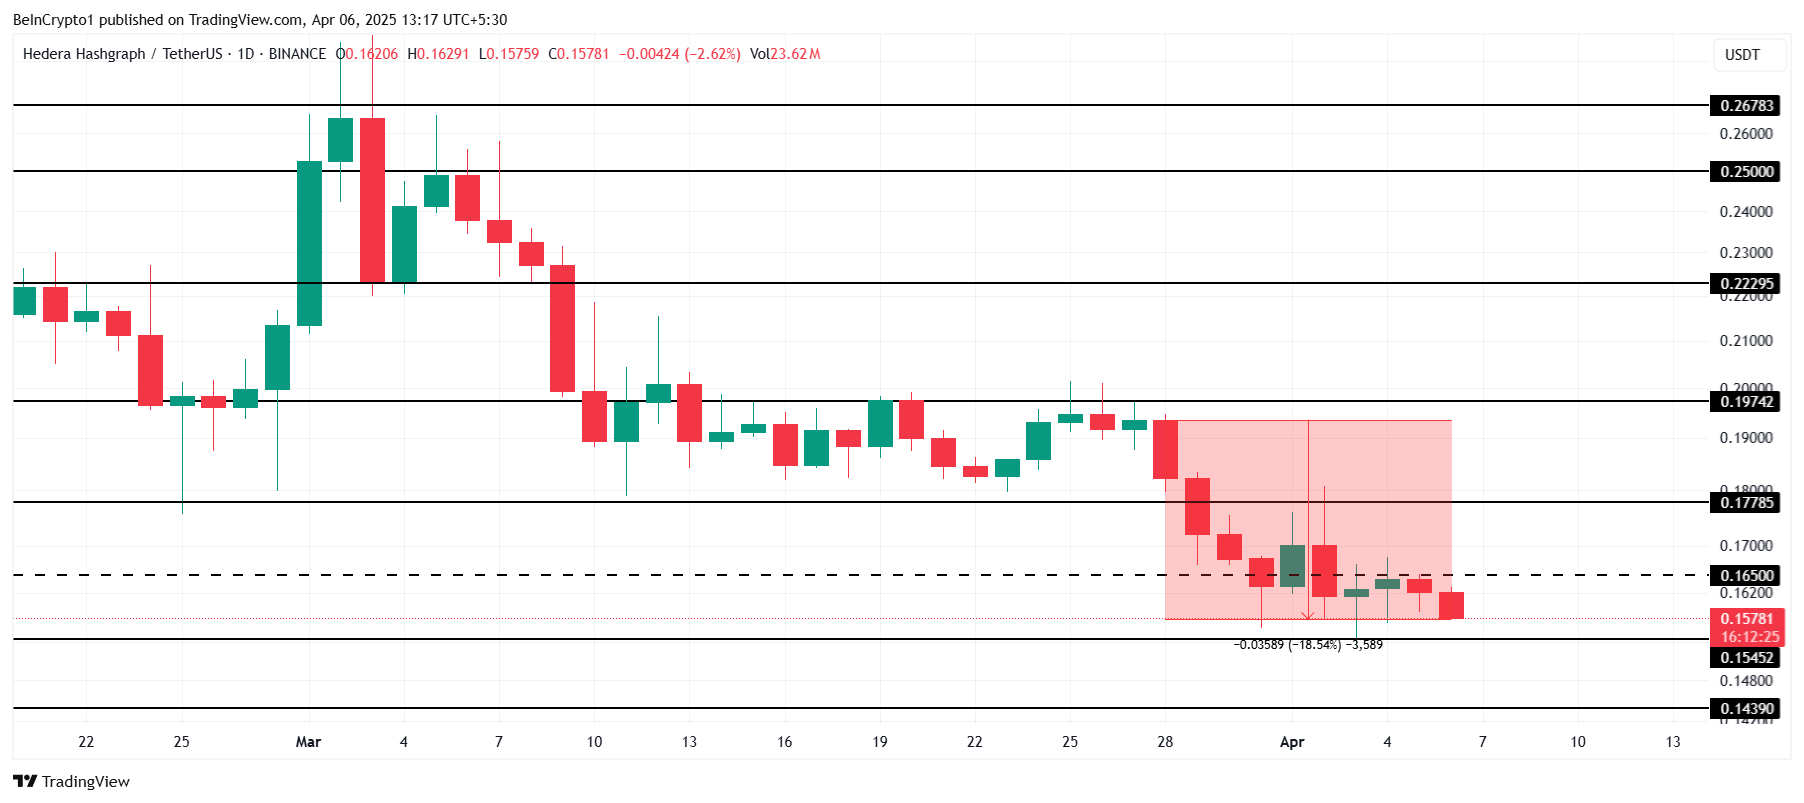
HBAR is currently trading at $0.157, holding just above the critical support level of $0.154. While it has managed to stay above this support for now, it remains vulnerable to falling through it if bearish sentiment intensifies. A break below $0.154 would likely trigger a deeper decline, with the next support level at $0.143.
If HBAR fails to hold the $0.154 support, a further drop could confirm the Death Cross formation. Should this scenario unfold, the price might continue downward toward $0.143, and further declines could follow, pushing HBAR toward $0.12 or lower.
On the other hand, if HBAR can bounce back from $0.154, a recovery rally is possible. Successfully flipping the $0.165 resistance into support could push the price toward $0.177. This movement would bring the liquidation scenario closer to reality, as short traders could face significant losses in a reversal.