Pending when an XRP ETF product is launched, the Cryptocom exchange has launched a product to boost its trading. As revealed, the platform has introduced strike options for XRP. Notably, this will allow users to predict the coin’s price movement within a 20-minute window. Cryptocom Unveils Strike Options For XRP Cryptocom has officially launched strike options for XRP. According to the update, this will give traders the chance to predict the coin’s price movement in short timeframes. With just $10, users can place trades and potentially profit by simply answering “yes ” or” no ” to whether XRP will move beyond a specific price in 20 minutes. It is worth noting that these options offer high-risk, high-reward scenarios and are designed for fast-paced trading environments. The product allows early exit if the price moves in the trader’s favor before the contract ends, which adds a strategic element to the experience. … Read More at Coingape.com
Coinbase exchange has made significant improvements to its Solana network infrastructure to enhance speed, resiliency, and scalability. The exchange further said that certain technical improvements have been implemented that have boosted performance numbers for Solana transactions on the exchange.
Coinbase doubles down on Solana ecosystem commitment
As per Coinbase’s announcement, the enhancements comprise asynchronously processing transactions. This has seen block processing throughput increase five times. The company has also introduced bare metal machines that have seen RPC (Remote Procedure Call) performance improve four times. These enhancements come with better failover mechanisms, liquidity optimizations, and enhanced operating controls to enhance the overall system resilience.
We’ve been hard at work scaling our @Solana infrastructure to be faster, more resilient, and more scalable.
We have upgraded our systems to: → Process transactions asynchronously, leading to a 5x improvement in block processing throughput. → Leverage bare metal machines for 4x… pic.twitter.com/WFINzCutNK
Coinbase upgraded its infrastructure, which means it wants to improve its Solana features as more and more people use the blockchain. The exchange highlighted that these technology upgrades will enable it to process transactions more effectively and dependably for senders and receivers of SOL and Solana tokens.
Coinbase said that this work is part of their dedication to achieving the best performance for Solana transactions. The company said that they will keep working on it and plan to invest more in Solana infrastructure to keep up with the growing demand as the network grows.
The upgrades are happening now because more institutional investors and developers are becoming interested in Solana. Coinbase has changed how it manages Solana’s fast blockchain by processing transactions at the same time. The announcement comes as Canada is set to approve multiple spot Solana ETFs this week.
SOL price shows bullish indicators amid institutional interest
As Coinbase improves its technical infrastructure for Solana, analysts are noting positive price action for SOL. Analyst Andrew Griffiths has identified several bullish technical indicators in his recent analysis of Solana’s price movements.
According to Griffiths, Solana has broken out of a descending parallel channel on the daily chart, retouched the trendline, and begun moving upward. The price has remained above the 21-day exponential moving average (EMA) for several days and remains above solid support around the $117 level.
**Daily Analysis:** – Price has broken out of a descending parallel channel, retouched the trendline, and is on the rise. – Closed above EMA21 for several days, overcoming an initial hurdle! – Price is above strong support around… pic.twitter.com/phvoODMj5o
Relative Strength Index (RSI) and Moving Average Convergence Divergence (MACD) indicators are still in a bearish trend on daily charts but are moving closer to the positive axis.
MACD and RSI are both bullish on the 4-hour time frame. Price is over the 22-period EMA, and the 21-period EMA is over the 55-period EMA. The 200-period EMA has been stable with current price action, and current candles have closed over all EMAs.
Institutional interest in SOL also appears to be growing, with analyst Gordon reporting that real estate firm Janover has purchased an additional 80,567 SOL worth approximately $10.5 million. This acquisition brings Janover’s total Solana holdings to 163,651 SOL in its treasury.
Shiba Inu trades price near $0.00001500, up about 8% this week and more than 30% this month, still below January’s $0.000024 peak.
Price keeps nudging higher, but one band keeps sending it back. To judge if this move can stretch, it helps to know if holders are really cashing out and whether momentum is actually building.
SOPR Is Flat Because Weak Holders Are Exiting at Break-Even Or Lower
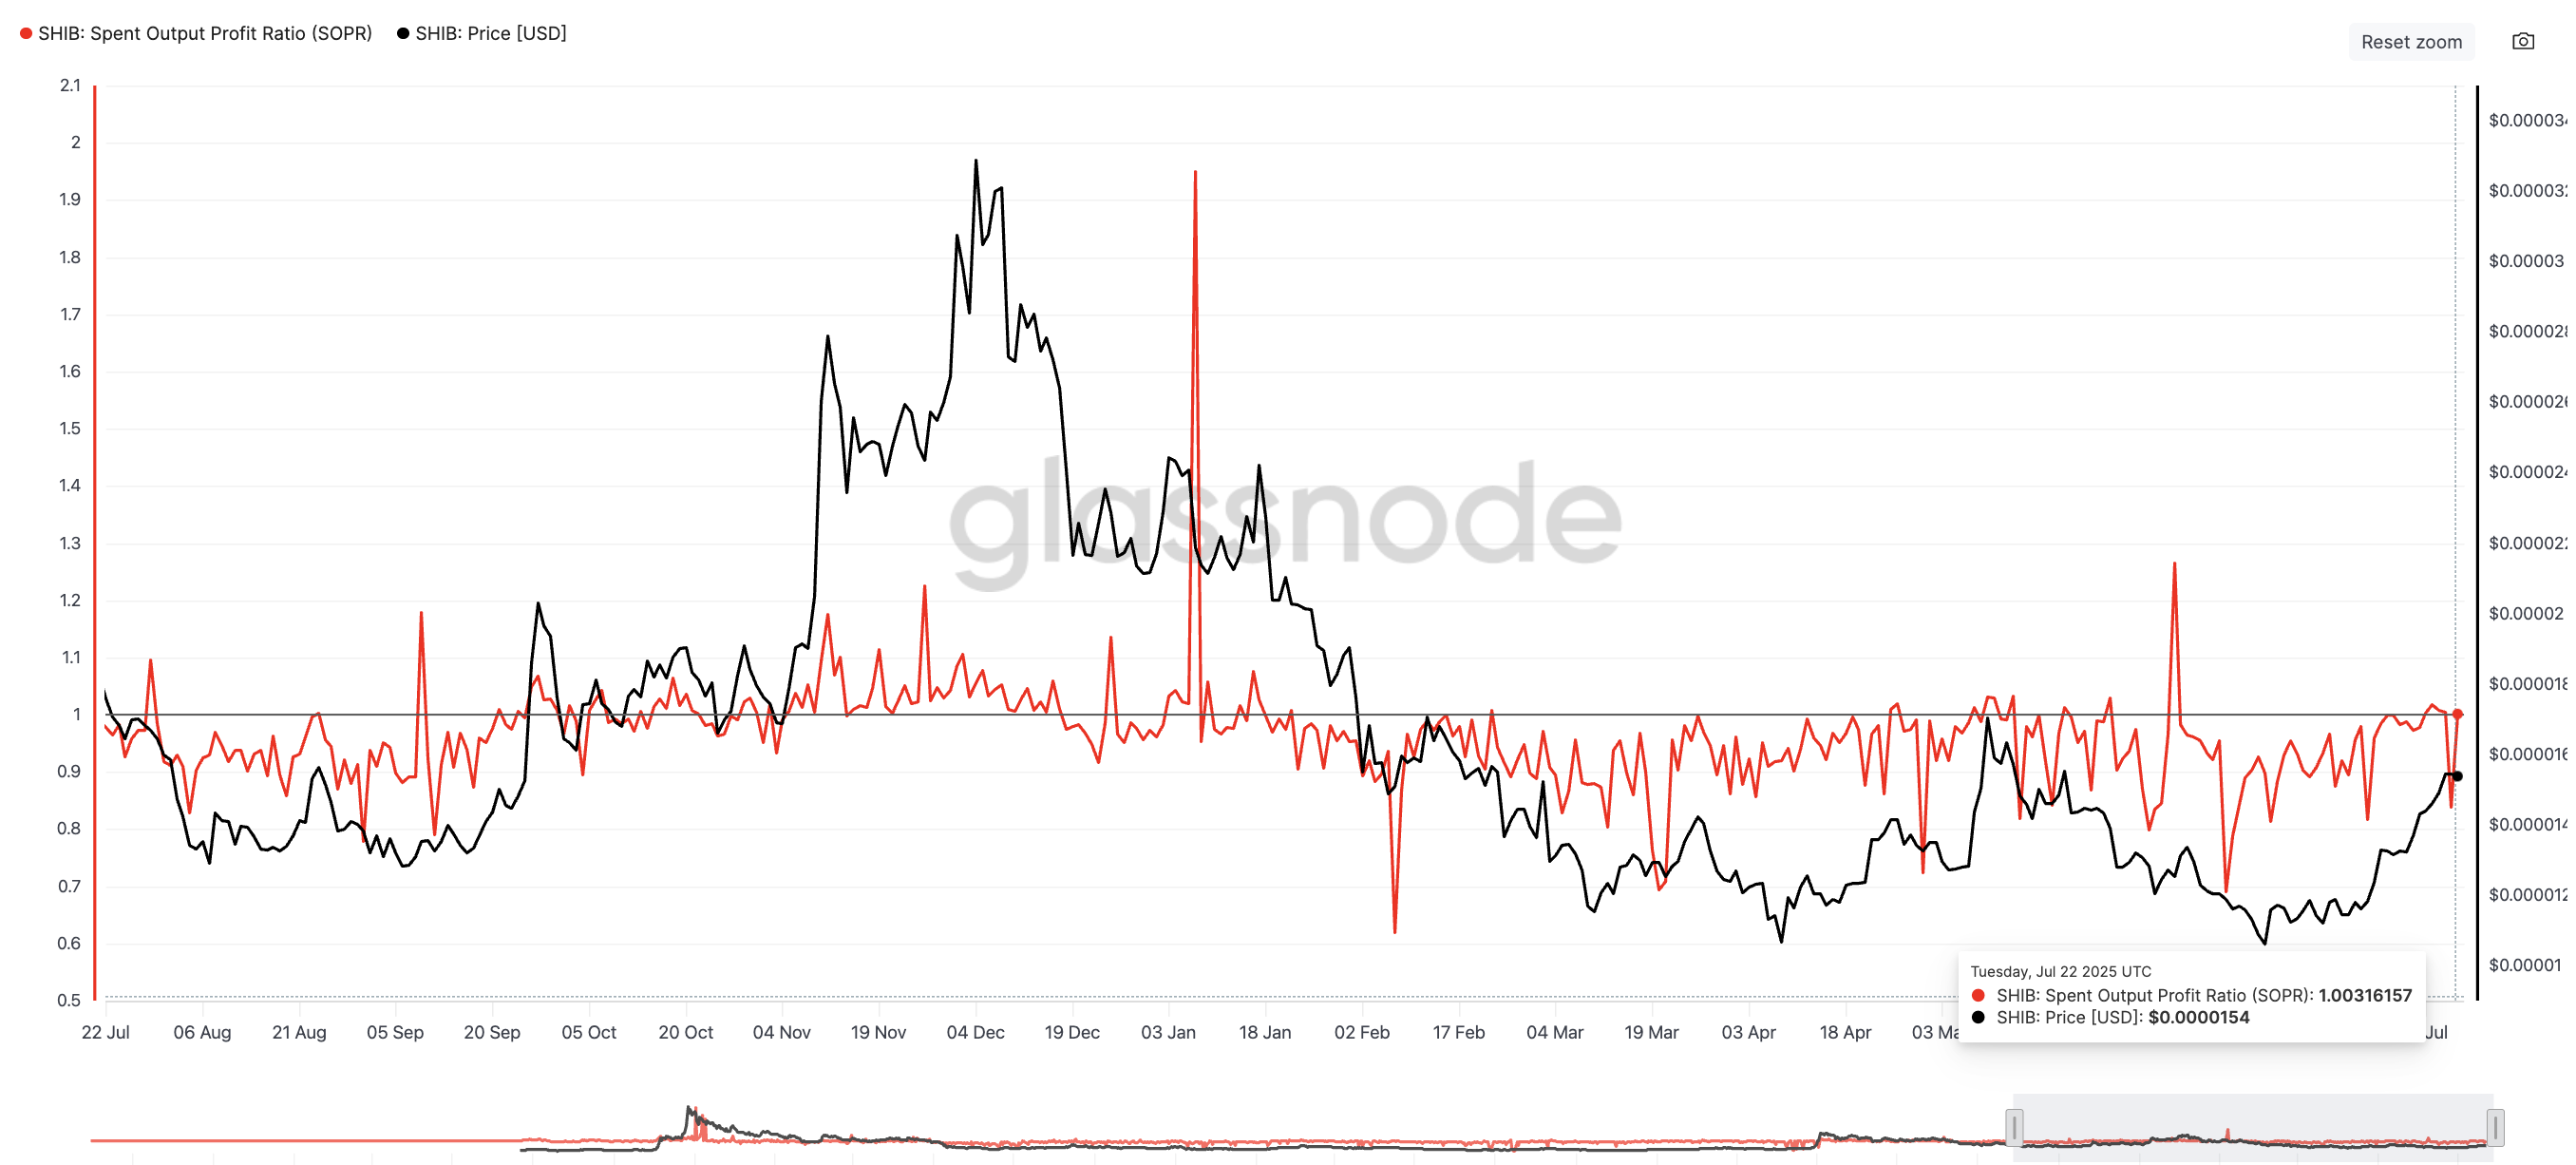
Profit taking is what usually stalls a rally, so the Spent Output Profit Ratio (SOPR) matters here. SOPR shows if coins sold on-chain are in profit (>1) or loss (<1).
It is around 1.0 currently after weeks below that line. Back on April 30, SOPR dropped to roughly 0.72 when price was near $0.00001327. Price then climbed about 28% to around $0.00001700 while SOPR drifted back toward 1.0.
On June 16, SOPR sank even lower to about 0.69 with price near $0.00001188. Price later rose roughly 30% to about $0.00001546 and SOPR again moved toward 1.0. SHIB’s SOPR dipped again to 0.83 two days earlier. The corresponding price upside is still pending.
The data shows coins being spent are near break-even or at a loss, not big profit. Despite the price rise, it implies weaker hands are leaving quietly, thinning supply above.
Historically, real pullbacks started when SOPR pushed clearly above 1.0 while price stalled. That has not happened yet.
RSI Shows Buyers Gaining Strength Under the Surface
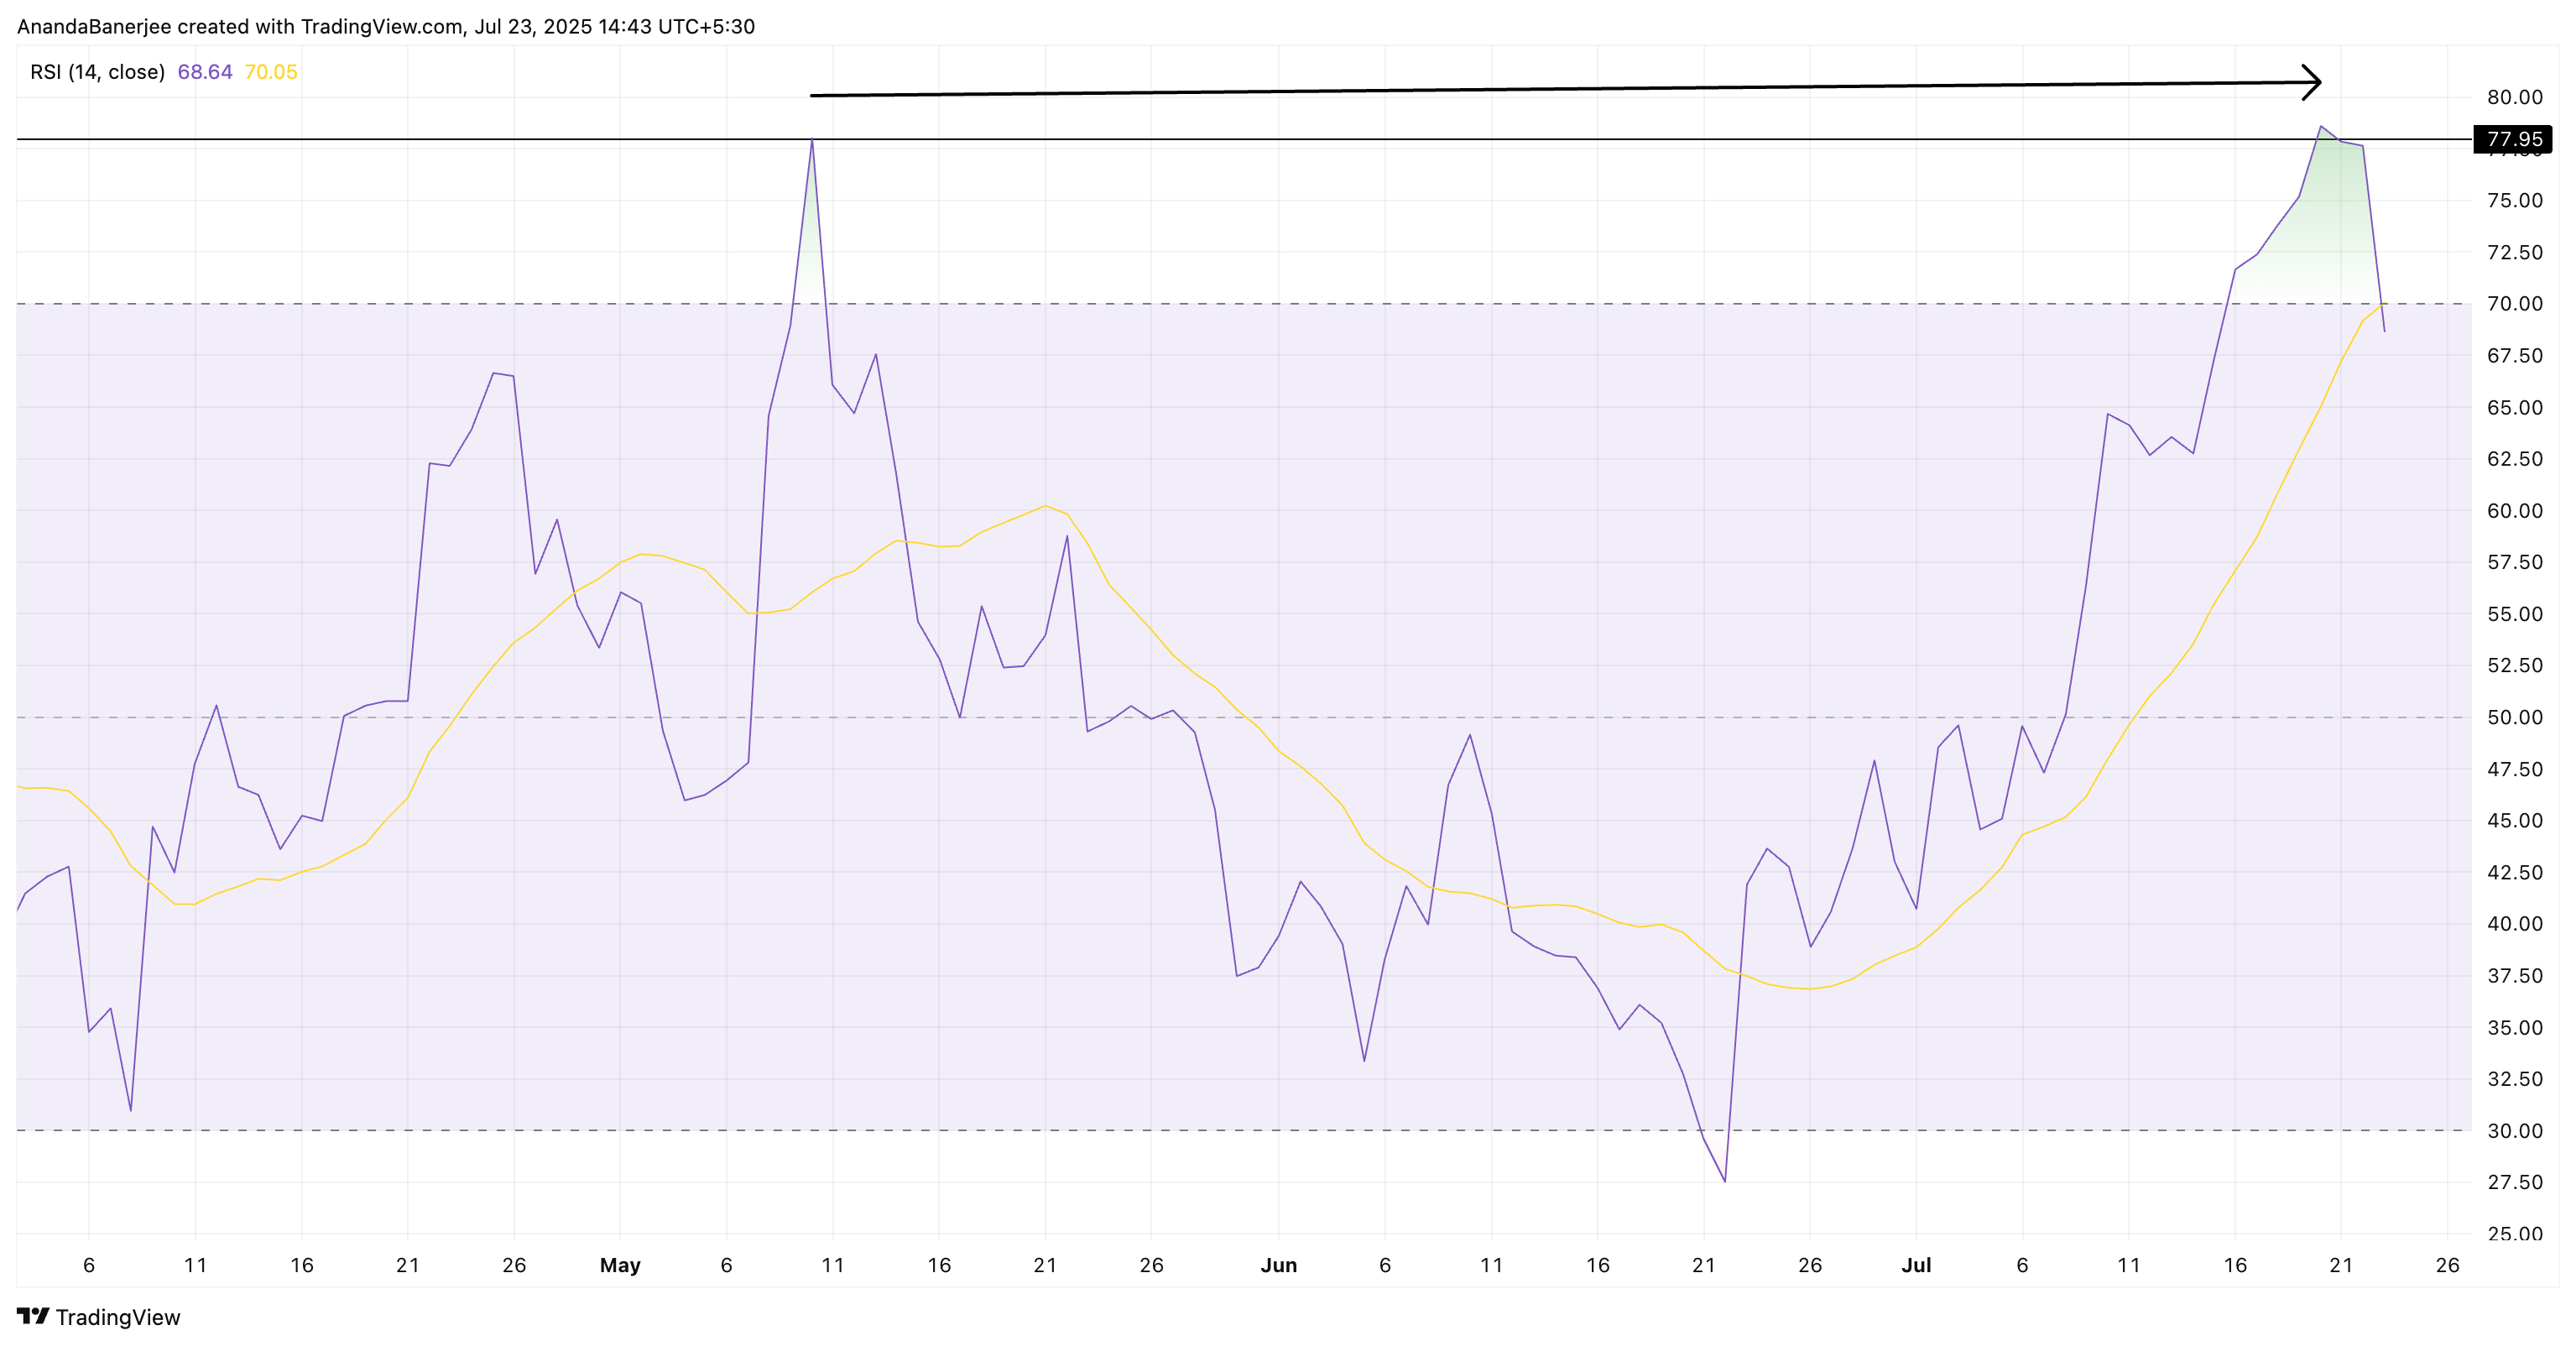
A move needs momentum to carry through, so the Relative Strength Index (RSI) is checked next.
RSI measures the strength of recent price moves on a 0–100 scale. Since mid-June, the daily RSI has made a small higher high, while the price has made a lower high. That bullish divergence says momentum is improving faster than price.
Even though the RSI divergence is barely there, it hints at growing momentum, positive for the Shiba Inu price action.
This means buyers are getting stronger even though the price has not broken out. If RSI keeps rising and price follows, the breakout chance increases. If RSI turns down while price stalls, the move can pause.
For token TA and market updates: Want more token insights like this? Sign up for Editor Harsh Notariya’s Daily Crypto Newsletter here.
Shiba Inu Price Levels Decide If the 45% Target Opens
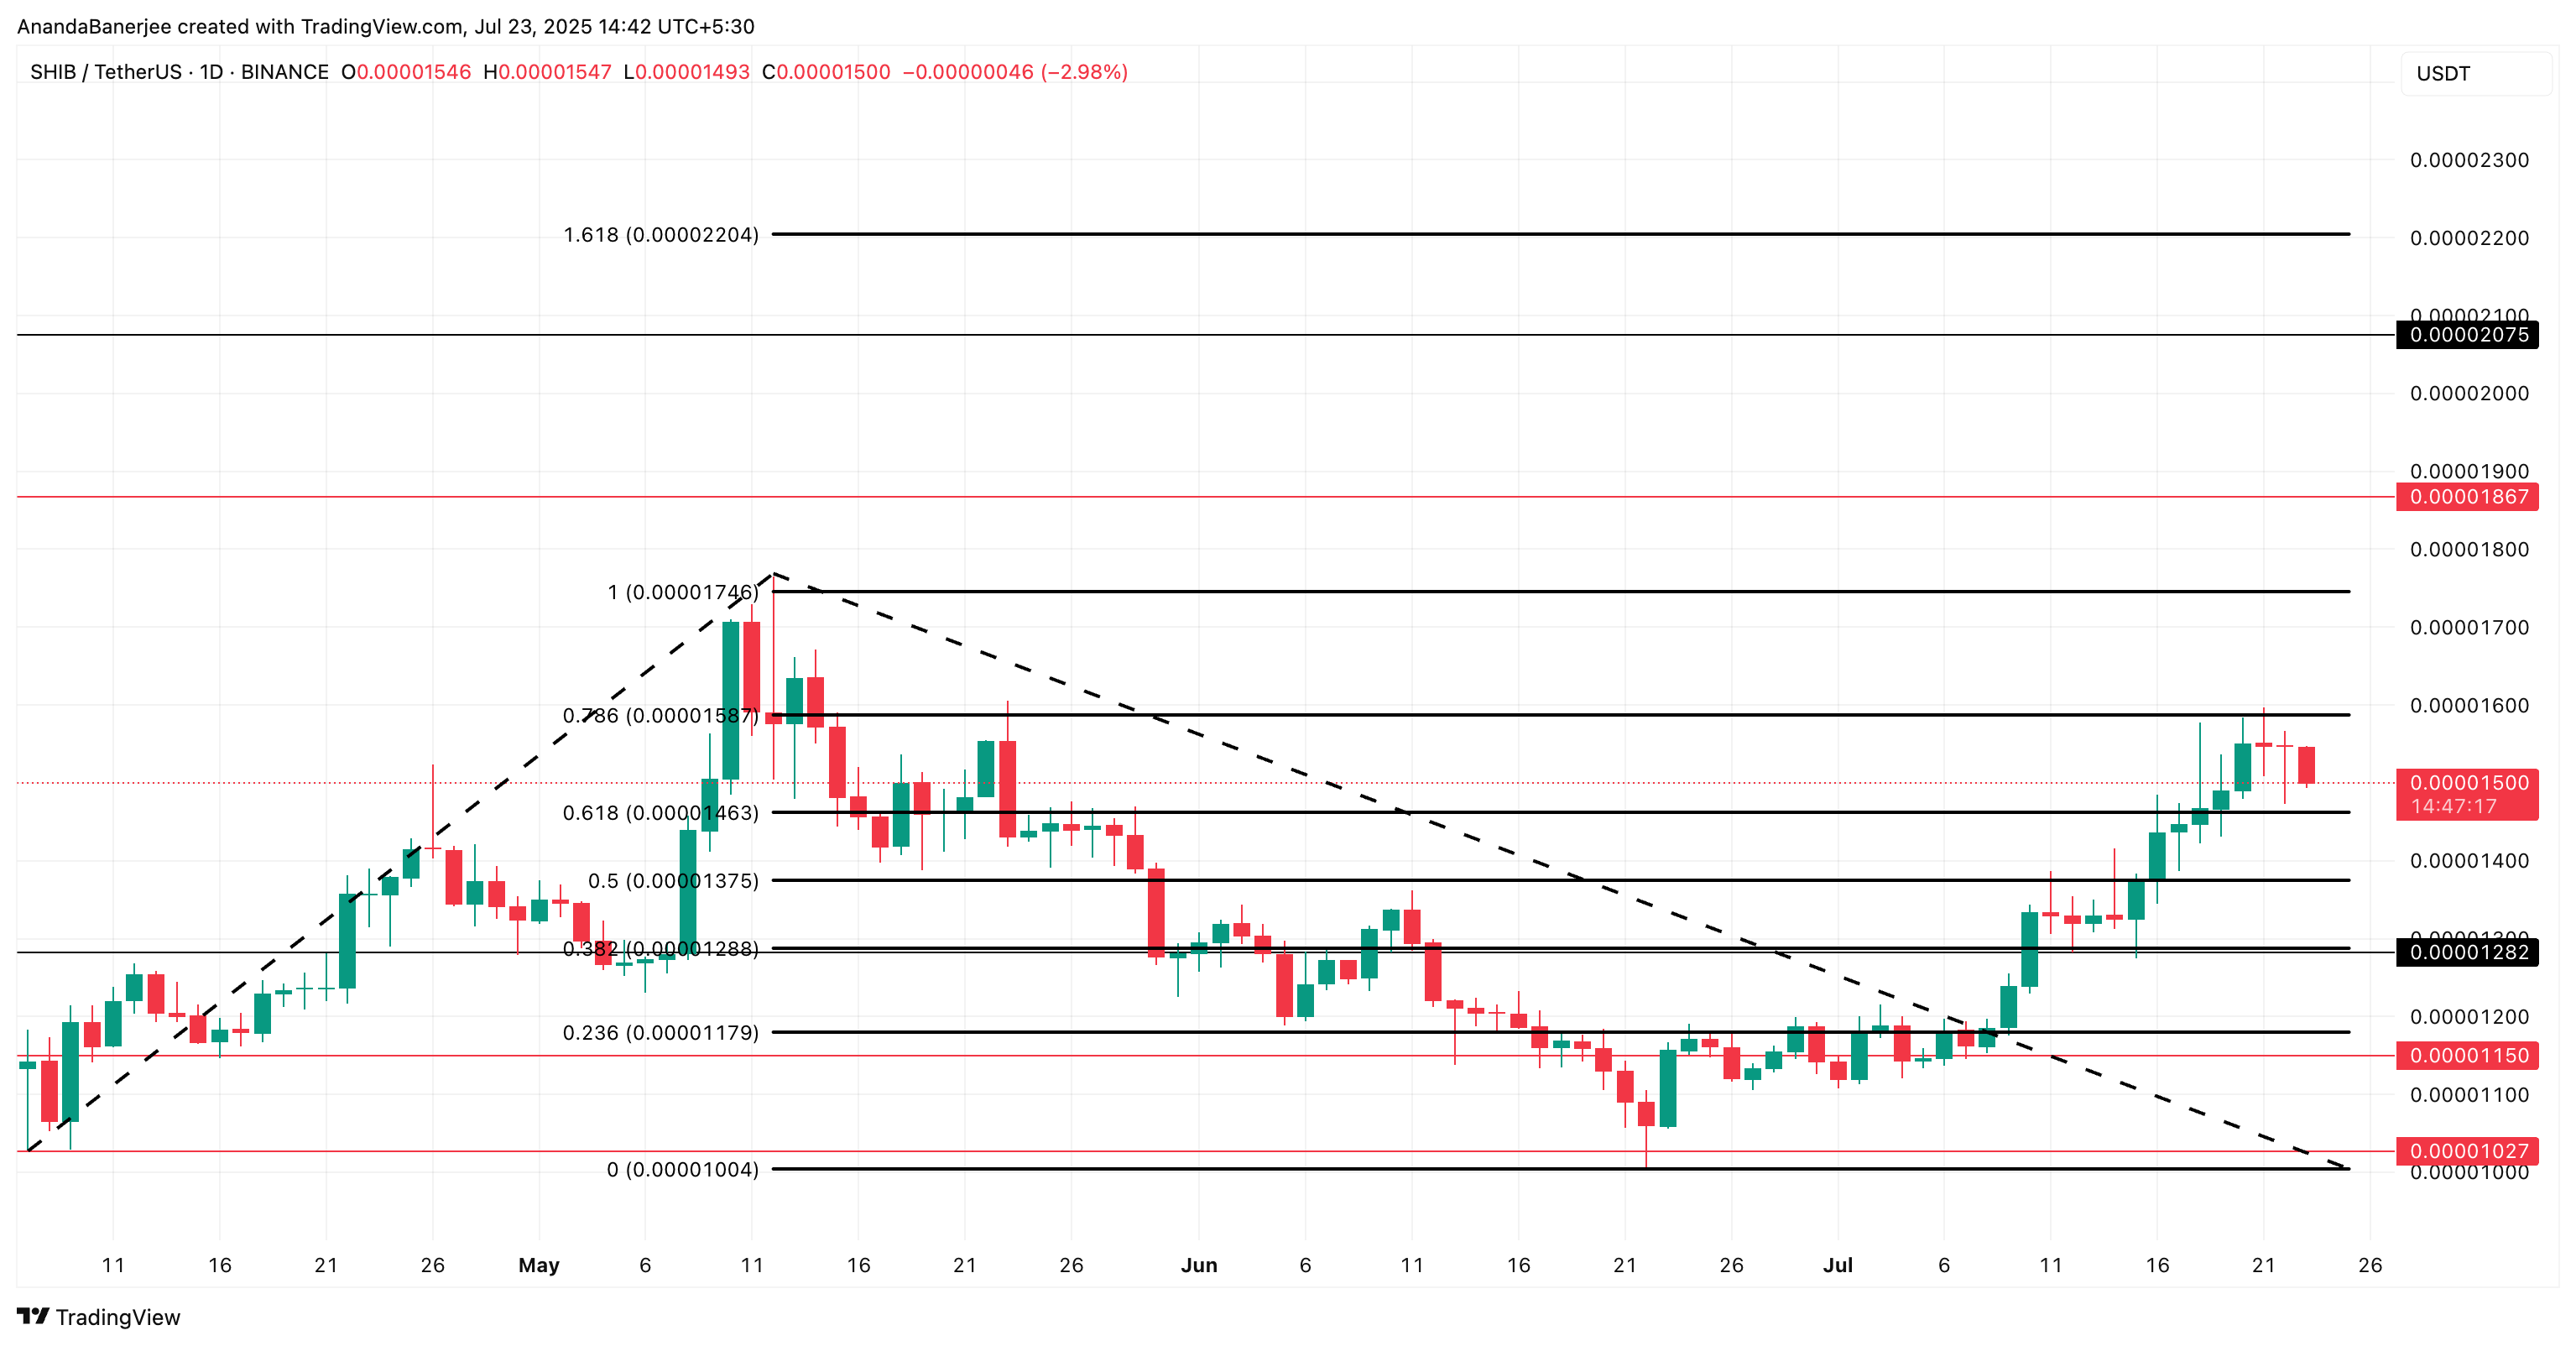
Levels are needed to confirm what the indicators suggest. The main ceiling is $0.00001587, a level that has been rejecting the Shiba Inu (SHIB) price for a while now.
A daily close above $0.00001587 could push SHIB price to $0.00001746 (roughly 16% higher) and then $0.000022 (roughly 45% higher). However, SHIB price would still need to first cross above the psychological resistance of $0.000020 before heading higher, a 33% from the current level.
Note: Not many technical resistance levels exist once the Shiba Inu price manages to cross $0.00001746
On the downside, $0.00001463 is the first level to hold, followed by $0.00001375, the 0.5 Fibonacci level. The bullish view weakens fast if the price falls under these levels while SOPR jumps above 1.0. That would show profit sellers finally stepping in.
Fibonacci extension levels are used because they mark common pullback and target zones that traders act on.
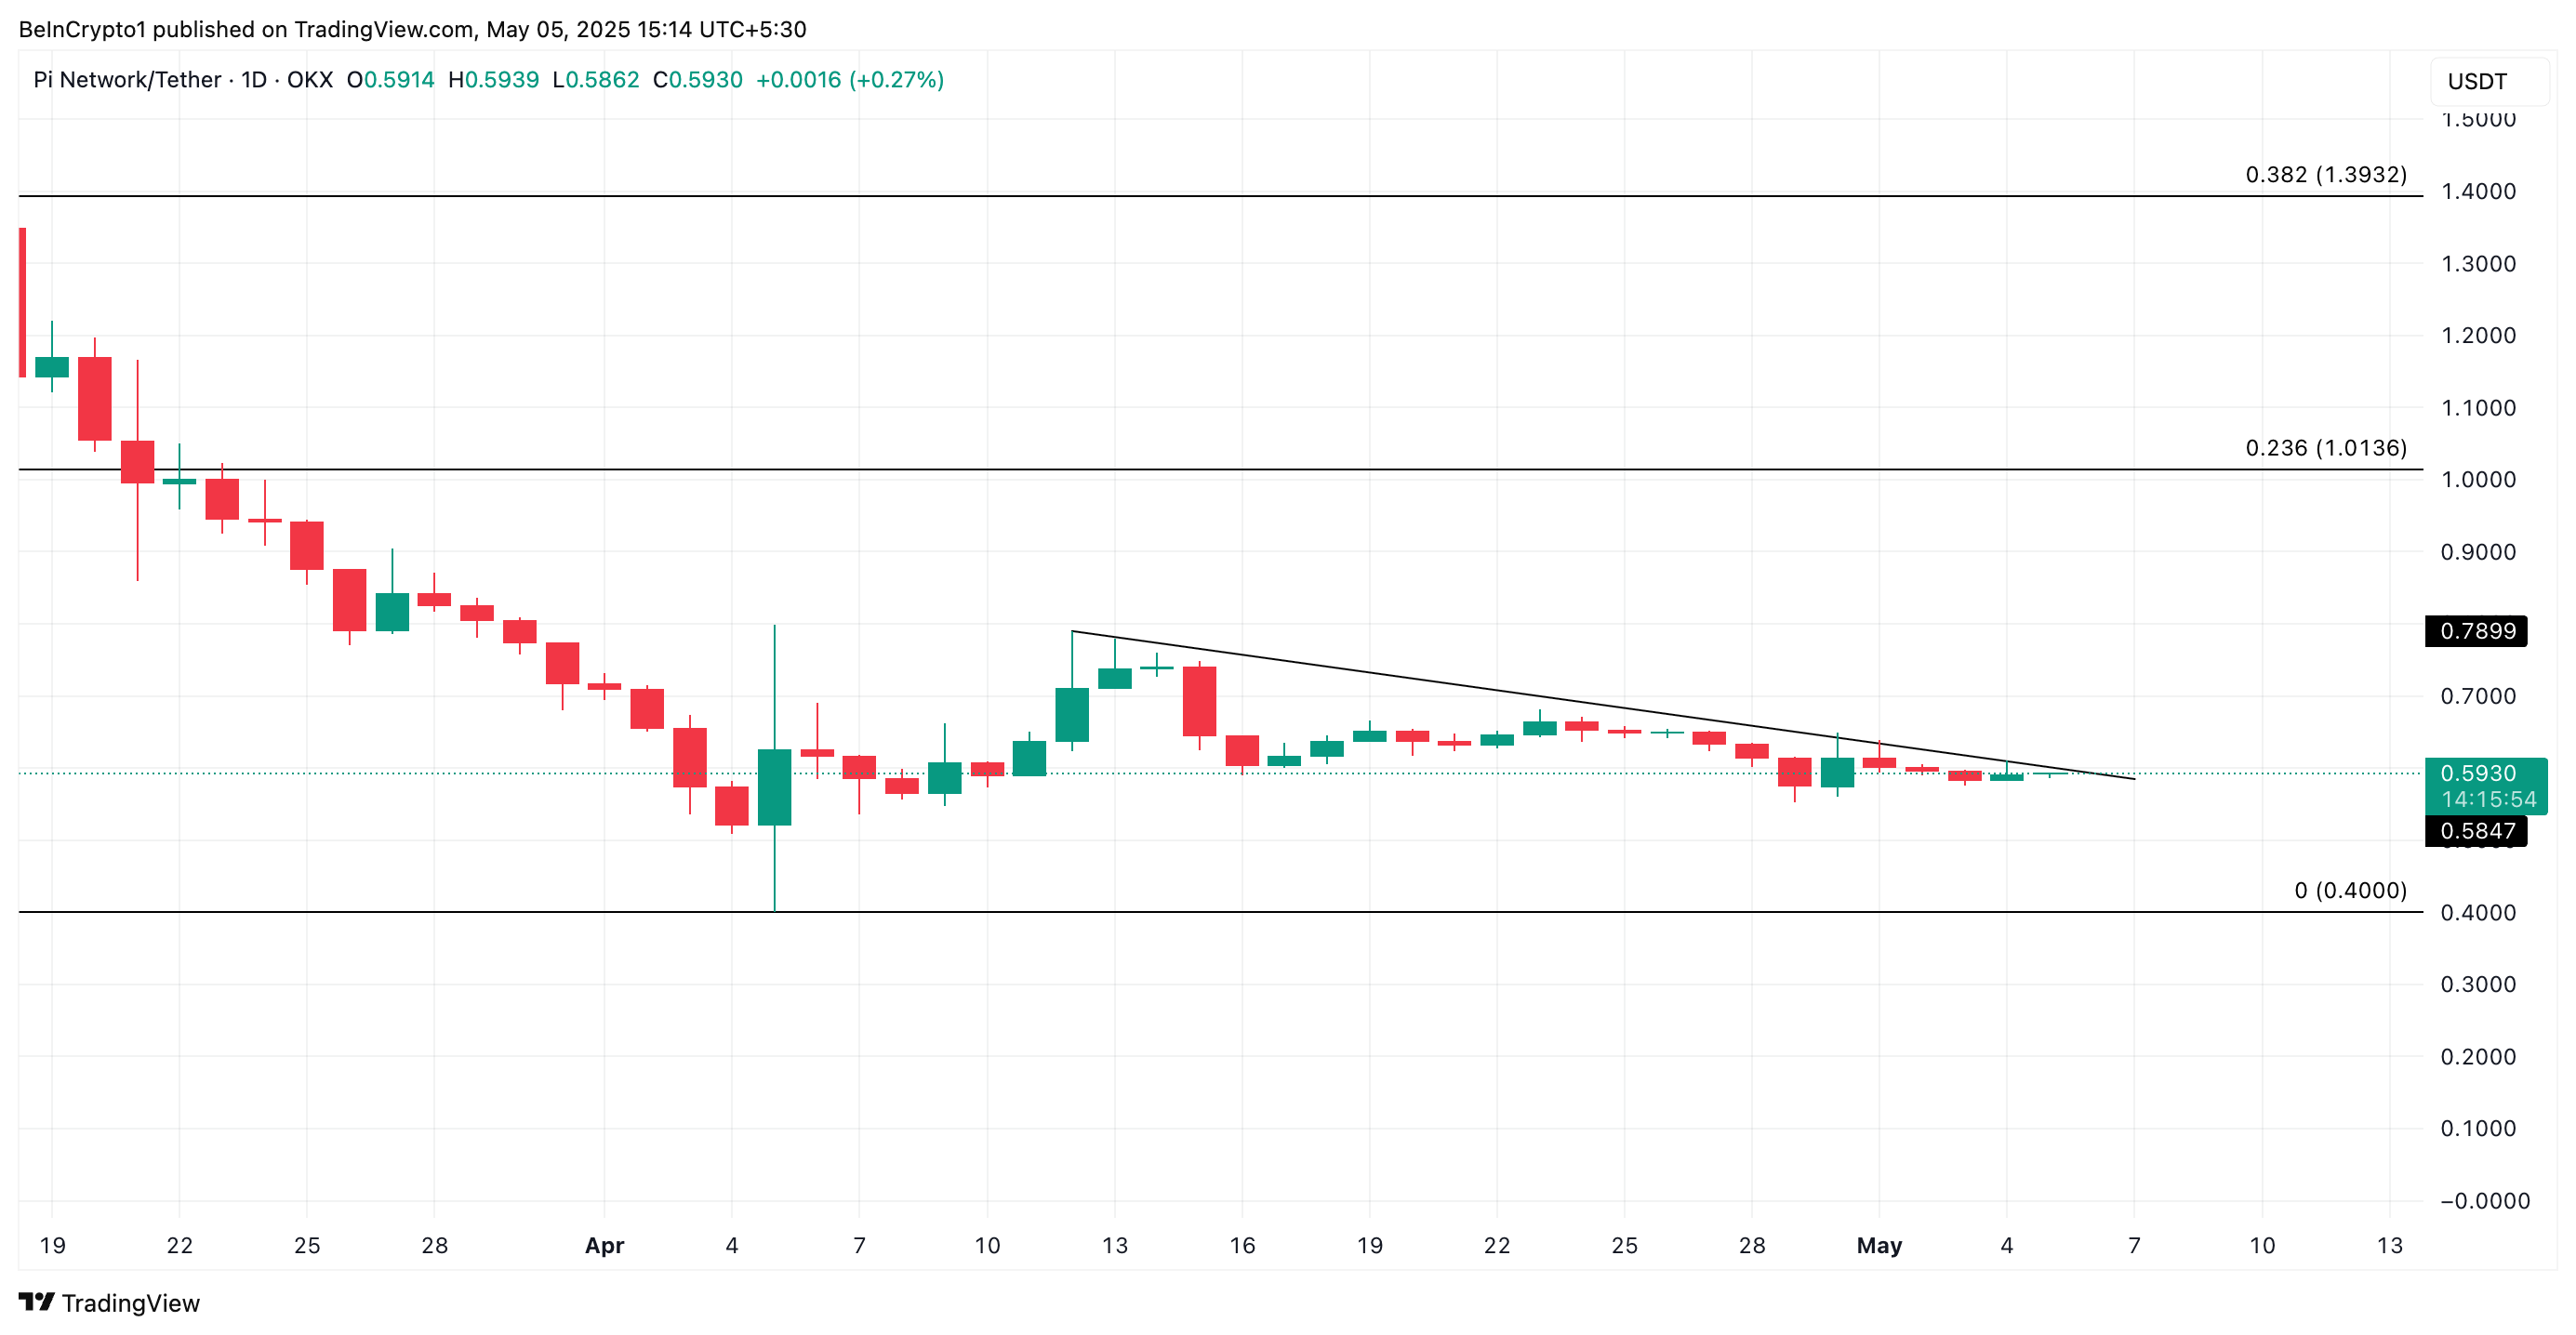
PI has been in a persistent downtrend since reaching an all-time high of $3 on February 26. In fact, it has traded below a descending trendline since April 12, highlighting the negative bias against the altcoin.
However, the tide may finally be turning. Technical indicators now point to a potential bullish resurgence, hinting at a PI rebound in the short term.
PI’s Quiet Accumulation Phase Could Trigger a Rally
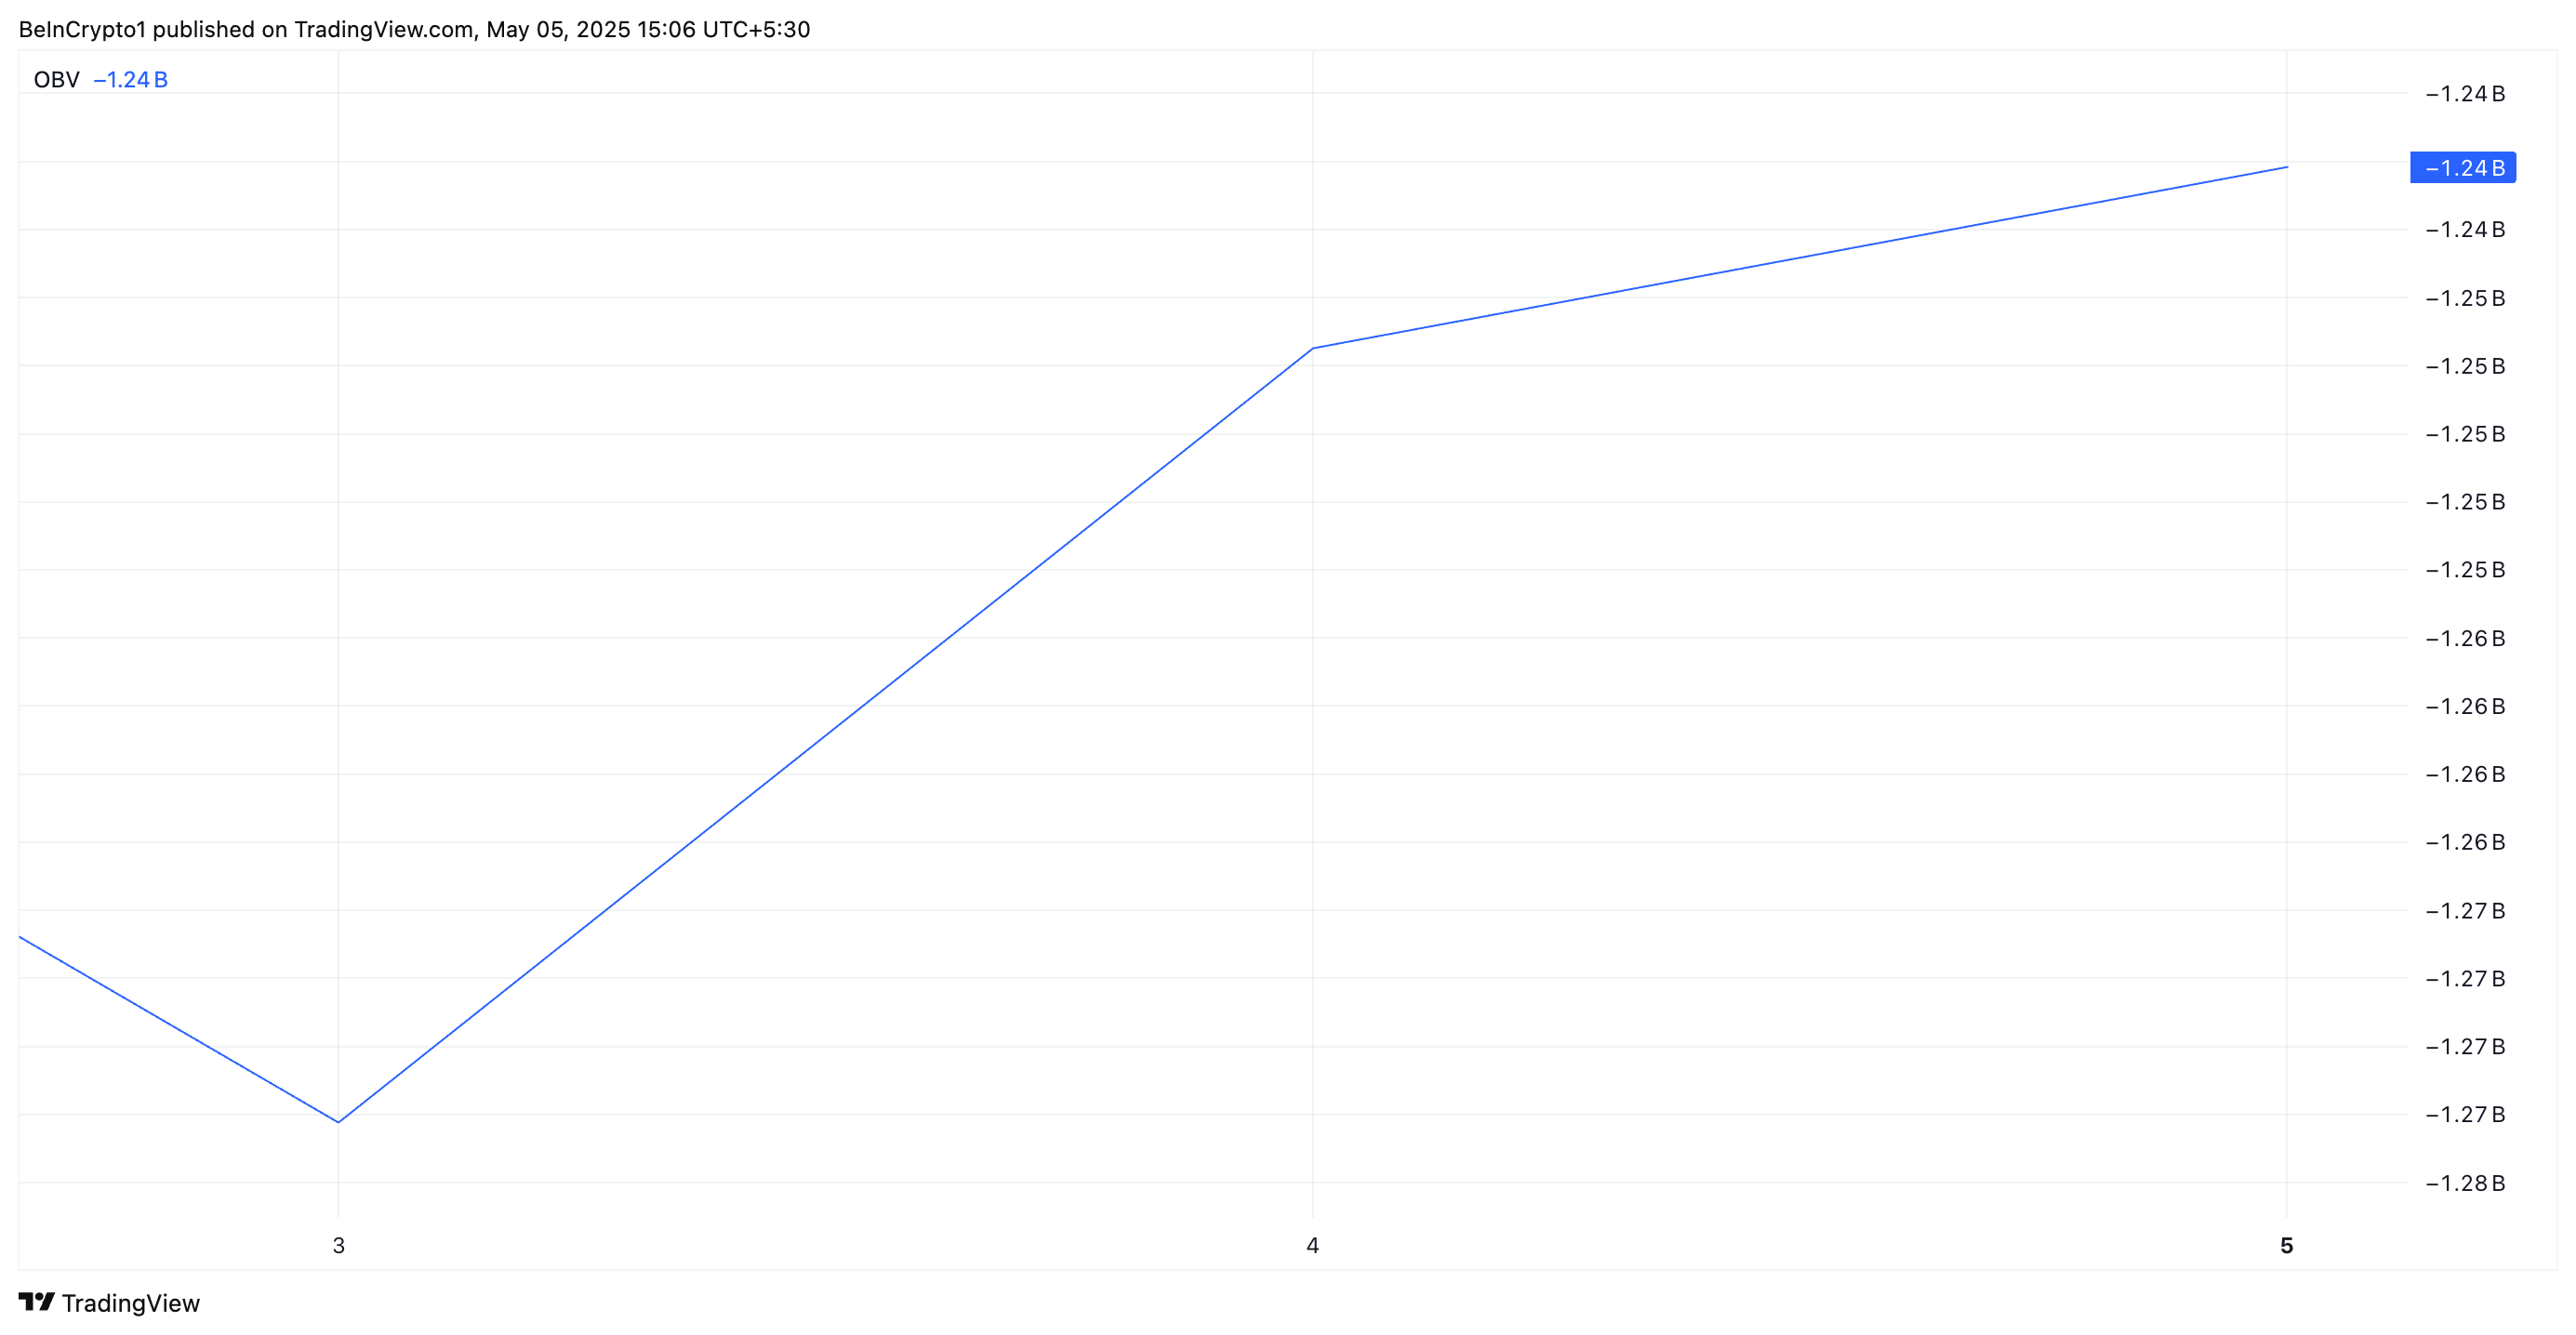
BeInCrypto’s assessment of the PI/USD one-day chart suggests that the altcoin may be preparing for a bullish breakout. For example, its on-balance volume (OBV) has spiked over the past two days, showing early signs of accumulation.
The OBV indicator uses trading volume to predict price movements, adding volume on up days and subtracting it on down days. When its value rises like this, it suggests a surge in buying pressure.
OBV is considered a leading indicator, meaning it often moves ahead of price action and can signal shifts in market sentiment before they are reflected in the asset’s price. Therefore, PI’s rising OBV indicates that buyers are quietly accumulating the token, even as its price remains subdued.
This divergence signals that bullish momentum is building, increasing the likelihood of a PI breakout once broader market sentiment aligns.
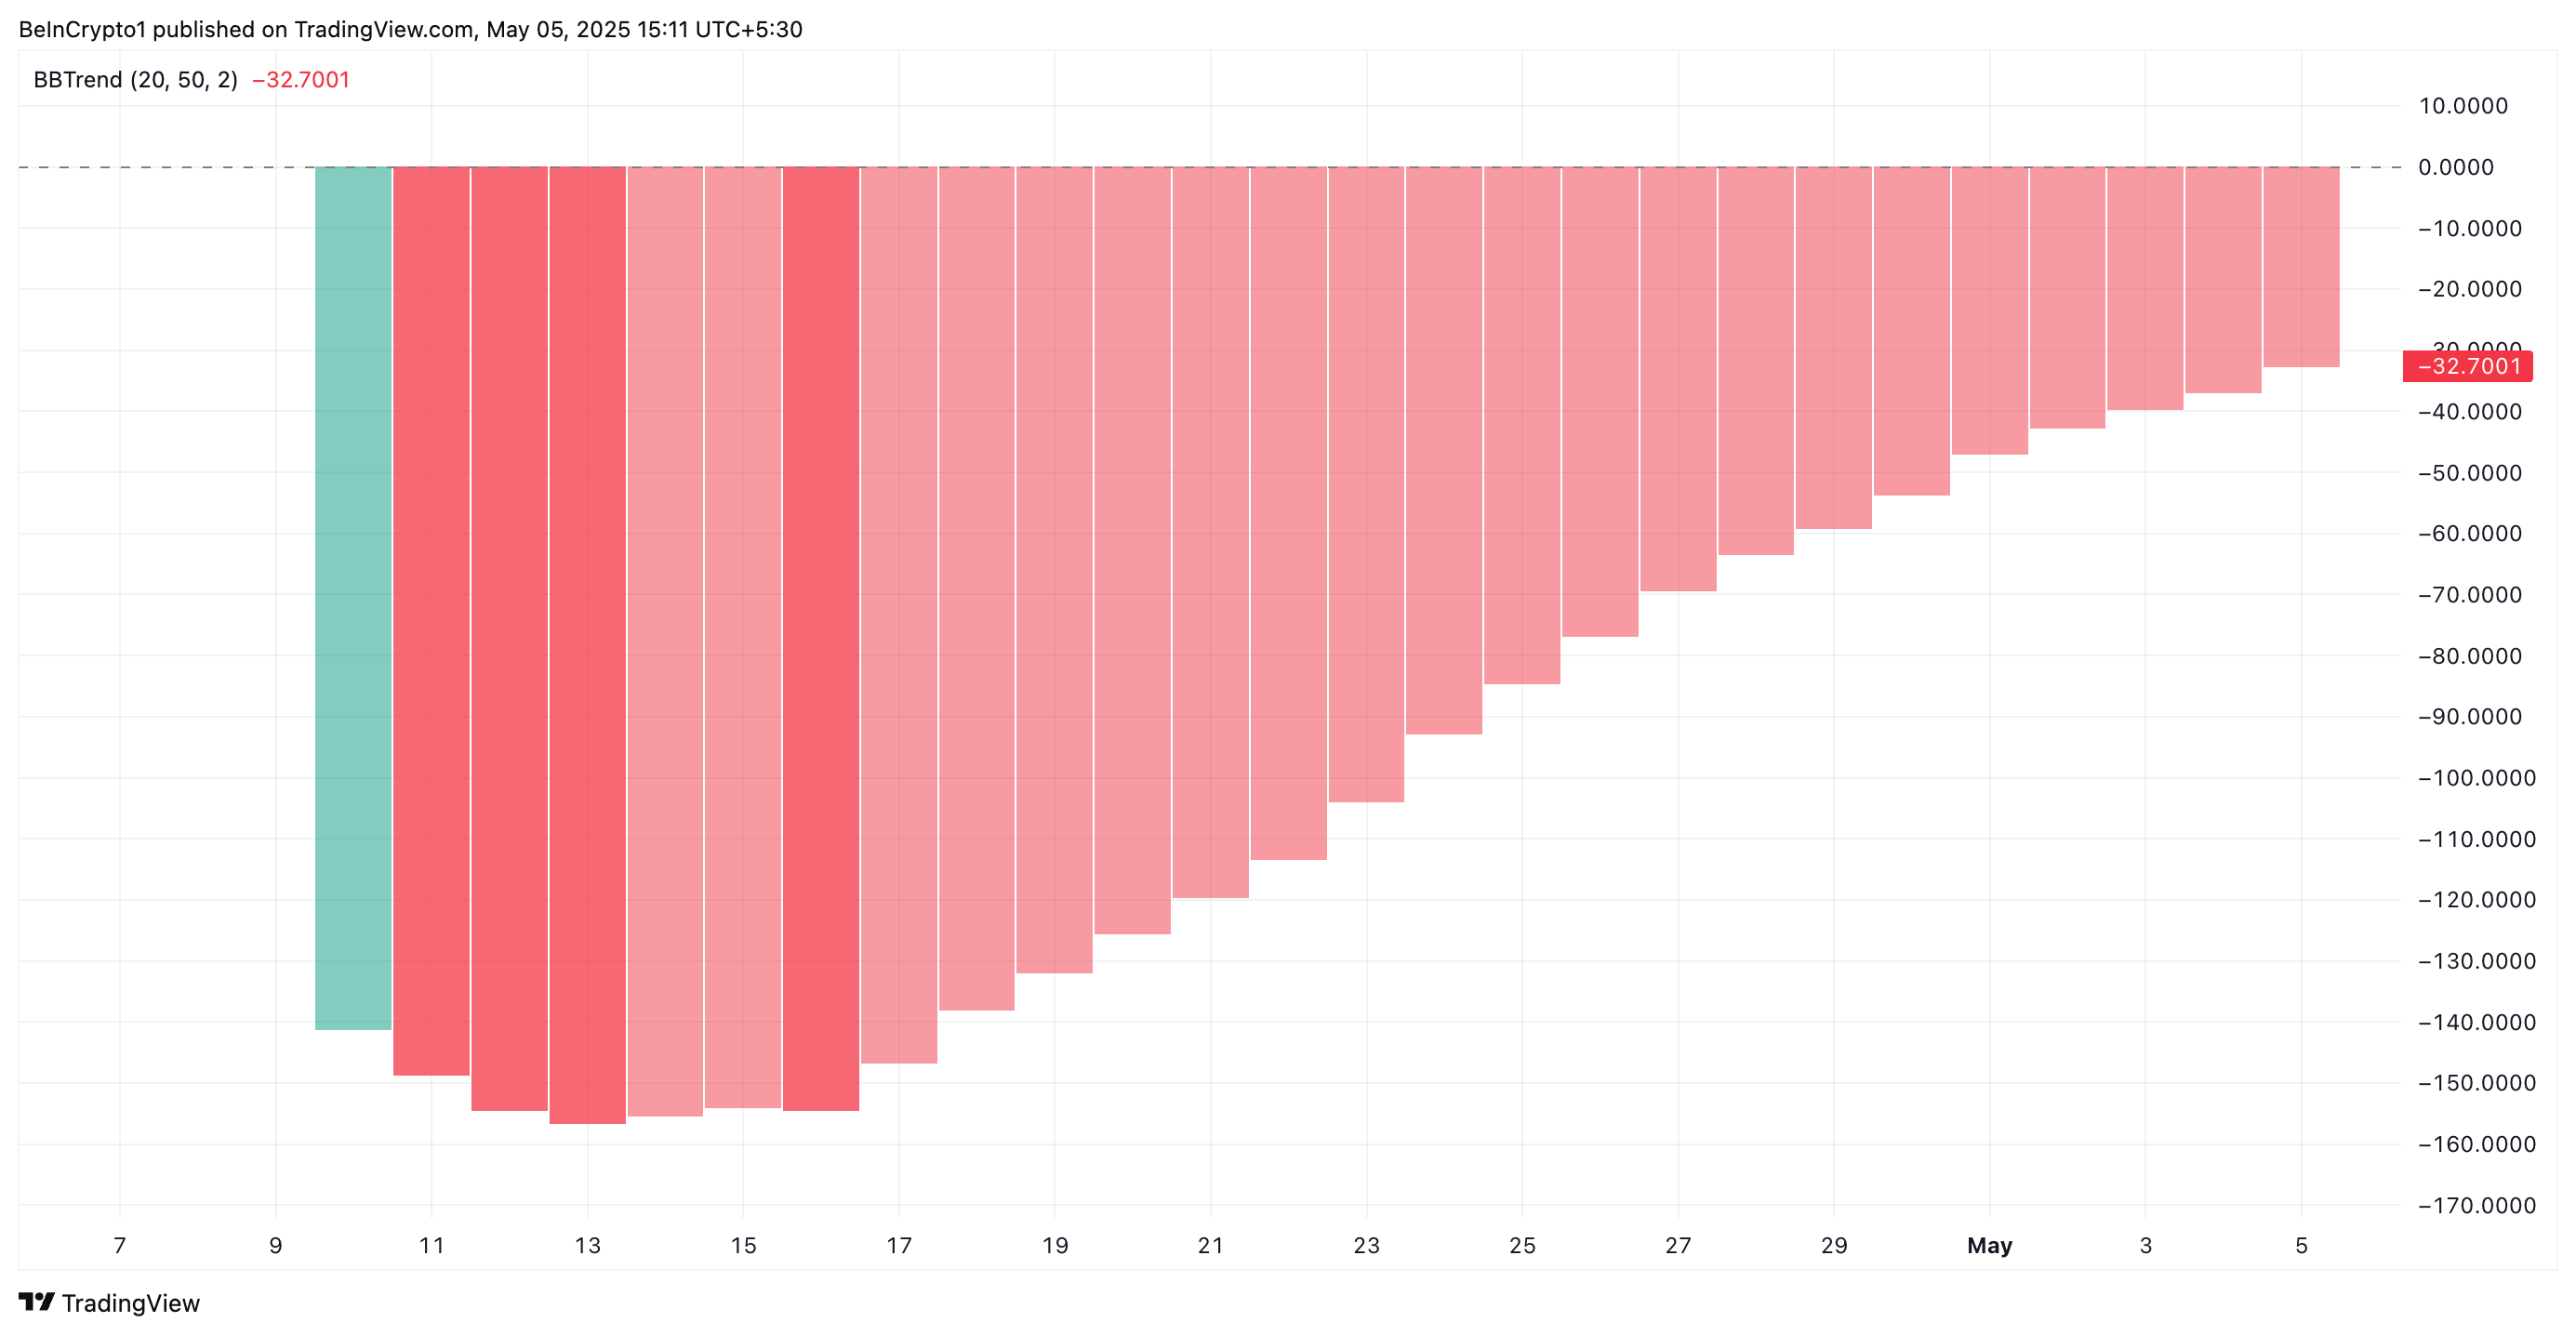
Furthermore, the red bars forming PI’s BBTrend indicator have gradually shrunk. This reduction suggests that selling pressure is weakening, serving as an early signal that the current downtrend may be losing steam.
In technical analysis, a contraction in the BBTrend histogram is a precursor to a potential trend reversal, especially when accompanied by rising volume and other bullish indicators.
As the bars shorten, it indicates that volatility is stabilizing in the PI market and that a bullish shift in price is increasingly likely.
PI for Reversal as Bullish Signals Point to $1 Breakout
PI currently trades at $0.591, resting below its descending trend line, which forms resistance above it at $0.605. If bullish pressure strengthens and PI demand rockets, it could flip this price point into a support floor and climb toward $1.01.