SUI, a blockchain project that many now call Solana’s biggest rival, is suddenly back in the action. Over the past week, its price has jumped nearly 25%, going from $1.86 to around $2.32. But this quick surge is just part of a much bigger picture. Several signs are pointing to something much bigger on the horizon for this rising Sui token.
Sui Stablecoin Inflows Hit Record High
SUI was once seen as one of the worst-performing assets this year, with its price falling nearly 60% since January. But things started to change in March and April, as the token began showing signs of a strong comeback.
In the last week alone, the SUI network saw a major jump in stablecoin activity. Around $60 million worth of stablecoins flowed into the network in just 24 hours, marking a new record.
This surge has now placed SUI among the top blockchain networks when it comes to stablecoin inflows, even outpacing giants like Ethereum and Solana.
SUI Showing Strong Bullish Signals
Adding even more excitement, popular crypto analyst Raoul Pal has shared a very bullish outlook for the token. Looking at the SUI’s 1-day price chart, Pal believes the coin is close to breaking out of a downward trend and may be ready for a strong rally.
Supporting this view, another well-known crypto trader, Capital Faibik, points to a “falling wedge” pattern forming on SUI’s chart. This pattern often signals a breakout, and if that happens, he believes the price could surge to around $4.80.
Big Prediction: SUI to $10?
But the most eye-catching prediction comes from investment giant VanEck. The firm, which manages over $116 billion in assets, says SUI could rise by more than 350% and hit $10 by the end of 2025.
This prediction seems more likely now, as Canary Capital Funds has just filed for the first-ever SUI token ETF. This move could attract institutional investors, which usually helps the asset grow in the long term.
SUI Price Analysis
As of now, SUI is currently trading at $2.32, showing a 1.5% increase in the last 24 hours, with the market cap reaching $7.5 billion.
Looking at the charts, it’s clear that the bulls are in control. The RSI has jumped from 48 to 68, indicating renewed buying activity. Plus, the MACD has turned bullish, showing that the trend could continue its upward trajectory.
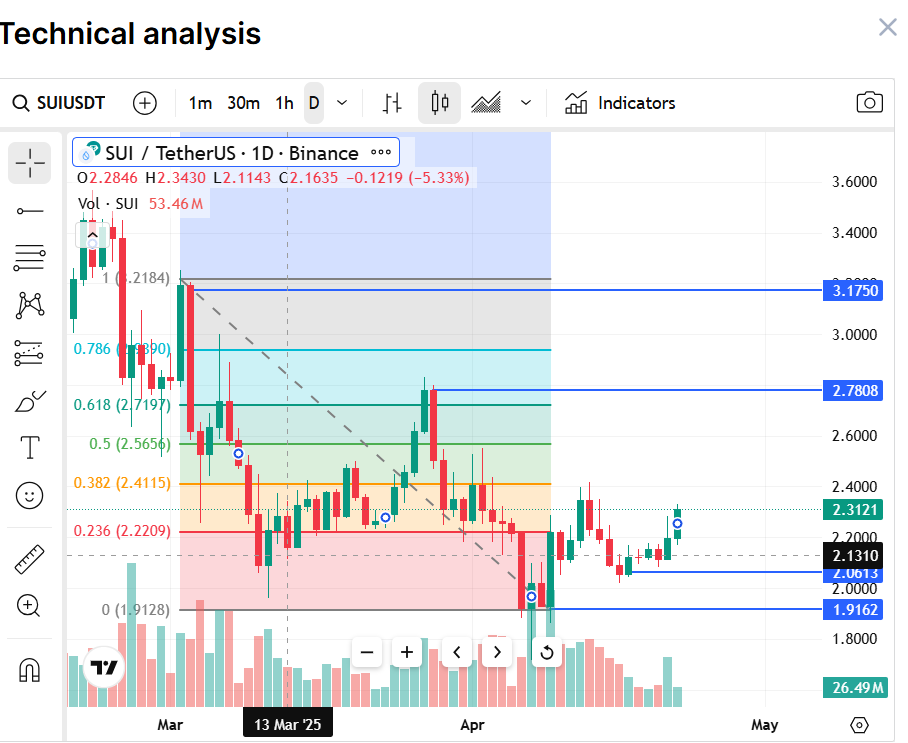
The token recently broke past a critical resistance at $2.25, a level that now offers solid support. If SUI keeps pushing forward, the next resistance point to watch is $2.78. A breakout above this could lead to a rise toward $3.17.
Bitcoin ETFs (exchange-traded funds) recorded significant net outflows this week, with institutional investors pulling out nearly $800 million amid market uncertainties.
Despite high expectations for the White House Crypto Summit, Bitcoin ETFs saw their fourth consecutive week of outflows, suggesting that institutional sentiment remains cautious. Over $4.5 billion in net assets have exited the market in the past four weeks.
Bitcoin and Ethereum ETFs Experience Heavy Outflows
Data on SoSoValue shows US Bitcoin ETFs faced total net outflows of $799.39 million this week after five consecutive days of negative flows.
The largest single-day outflow of the week occurred on Friday, with $409 million withdrawn from Bitcoin ETFs.
Data on Farside Investors corroborates the outlook. It shows that the largest contributors to Friday’s landmark outflows were Ark Invests’ ARKB and Fidelity’s FBTC ETF instruments. They posted $160 million and $154.9 million in negative flows, respectively.
BlackRock’s IBIT and Grayscale’s GBTC followed with $39.9 million and $36.5 million. Meanwhile, the other issuers, save for Bitwise (BITB), recorded zero flows.
Ethereum ETFs also continued their negative trend, logging a second consecutive week of net outflows.
Ethereum ETFs Weekly Net Outflow. Source: SoSoValue
These negative flows come despite anticipation that this would be a bullish week amid White House Crypto Summit hype. The outflows suggest that macroeconomic concerns and strategic market positioning have overshadowed the event’s impact.
Some analysts point to persistent fears over President Trump’s trade tariffs and broader economic instability. These, they say, sour institutional confidence. Specifically, industry experts have highlighted structural shifts in the market as a possible explanation for the ongoing capital flight.
Kyle Chasse recently explained that hedge funds have been exploiting a low-risk arbitrage trade between Bitcoin spot ETFs and CME futures. However, as these trades collapse, liquidity is withdrawn from the market, influencing sell-offs and outflows from crypto investment products.
QCP Capital Explains Crypto Market Reaction
Meanwhile, a recent report from QCP Capital provided additional insight into the market reaction. The firm noted that while the White House Crypto Summit was initially expected to be a key bullish catalyst, President Donald Trump preempted expectations by signing an executive order establishing the Strategic Bitcoin Reserve and US Digital Asset Stockpile.
Upon the signing, Bitcoin’s price dropped sharply from $90,000 to $85,000 in what analysts called a “sell the news” event. Market participants positioned for a bullish outcome at the summit were caught off guard, leading to a sharp sell-off.
“The knee-jerk reaction lower likely stems from the realization that no actual budget has been allocated for BTC purchases in the near term,” read an excerpt in the QCP report.
This explains Friday’s climax of the week’s Bitcoin ETF outflows. Overall, it’s evident that macroeconomic factors are driving fears among institutional investors, at least for the short term.
At the start of 2025, several altcoins surged to new all-time highs. Others climbed to multi-month peaks, riding the wave of the Donald Trump-fueled rally that swept through the crypto market.
However, Trump’s escalating trade wars and broader macroeconomic unrest have led to a significant downturn in many altcoins, raising questions about the timing of the next altcoin season.
Altcoin Season Slips Further Away
Altcoin season refers to a market cycle in which crypto assets other than Bitcoin significantly outperform BTC in terms of price gains. Many altcoins witness significant price surges during this period, often due to increased investor speculation, capital rotation from BTC into other crypto assets, and bullish sentiment in the market.
This cycle commences when at least 75% of the top 50 altcoins outperform BTC over a three-month period. However, this is far from the reality. The Altcoin Index, which tracks this trend, has plunged to its lowest level since October 2024, signaling continued weakness in the sector.
As of this writing, only 24% of top altcoins have outperformed leading crypto Bitcoin over the past 90 days, highlighting its dominance in the current market cycle. This persistent underperformance suggests that an altcoin season may still be far off.
Further reinforcing this bearish outlook, TOTAL2, the metric tracking the total market capitalization of all cryptocurrencies excluding BTC, has remained in a descending parallel channel since the beginning of the year.
This pattern signals a sustained downtrend. It is formed when an asset’s price moves between two downward-sloping parallel trendlines, with lower highs and lower lows over time. As of this writing, TOTAL2 is at $1.14 trillion, plummeting by 17% since January 1.
This decline confirms the lack of strong bullish momentum across the altcoin market, hinting at zero likelihood of an altcoin season kicking off anytime soon.
Bitcoin Dominance Climbs as Market Pullback Deepens
While the market has witnessed a significant pullback recently amid Trump’s trade wars, Bitcoin dominance has continued to increase. An assessment of Bitcoin’s dominance (BTC.D) on a daily chart confirms the same.
This metric, which measures the percentage of the total cryptocurrency market capitalization that Bitcoin holds, has remained above an ascending trend line since last December. As of this writing, it sits at 61.29%.
If BTC’s dominance remains elevated, it could further delay the prospects of an altcoin season.
XRP price opened trading at $2.25 on Thursday, March 19, with key derivatives trading signals leaning bullish ahead of the U.S. Federal Reserve’s rate decision. Can XRP price breach the $2.5 resistance in the upcoming trading sessions?
XRP Price Remains Below $2.30 as Investors Shift Focus to Low-Cap Altcoins
Ripple (XRP) was among the top-performing altcoins last week, driven by reports that the U.S. Securities and Exchange Commission (SEC) was considering classifying XRP as a commodity as part of its settlement talks with Ripple. The anticipation that this move could eliminate a significant regulatory hurdle for altcoin ETF approvals fueled a strong rally.
Investors flocked to XRP, alongside other top altcoins such as Litecoin (LTC), Cardano (ADA), and Hedera (HBAR), with ETF approval filling in progress, all of which posted double-digit gains before facing corrections this week.
However, this week, the momentum has shifted away from XRP as new ETF developments have emerged. Canary Capital’s filing for a SUI spot ETF—its sixth altcoin ETF filing —alongside Nasdaq’s Polkadot ETF application has spurred fresh investor interest. As a result, both DOT and SUI have experienced notable price surges.
A broader market analysis suggests that investors are rotating capital out of last week’s top gainers, including XRP, in pursuit of these emerging narratives.
This rotation has left Ripple price trading below the $2.30 mark on Thursday, with its trading volume declining alongside other major altcoins such as LTC, SOL, and ADA, all of which have seen increased selling pressure over the past 24 hours.
XRP Derivative Traders Take a Cautious but Optimistic Stance Ahead of US Fed Rate Decision
While XRP’s price has struggled to maintain momentum this week, investors have rotated capital into emerging altcoins like Polkadot (DOT) and SUI, driven by fresh ETF narratives. Despite the bearish sentiment in the spot market, derivatives trading data reveals a more optimistic outlook, with traders positioning themselves for potential upside ahead of the U.S. Federal Reserve’s rate decision.
Three vital derivative trading indices compiled by CoinGlass on Wednesday suggesting an imminent bullish reversal in XRP price momentum:
1. XRP Derivatives Volume Climbs 7.34% as Open Interest Rises
XRP derivatives trading volume has increased by 7.34%, reaching $5.05 billion, while open interest (OI)—the total value of active futures contracts—has edged up 1.85% to $3.19 billion. This signals growing market participation, with traders actively opening new positions in anticipation of heightened volatility. An uptick in OI typically reflects confidence in an impending price move.
2. Long/Short Ratio Indicates Bullish Leverage Bias
On leading exchanges, XRP traders are showing a strong inclination towards long positions. The long/short ratio on Binance XRP/USDT accounts stands at 2.394, meaning there are nearly 2.4 long positions for every short. Similarly, OKX’s long/short ratio is 2.01, reinforcing the bullish outlook. When traders disproportionately favor longs, it often suggests an expectation of upward price movement.
3. Sell-Side Liquidations Decline as Bulls Gain Control
XRP’s sell-side liquidations have notably decreased, suggesting that bearish pressure is easing. In contrast, buy-side liquidations have risen, indicating that leveraged traders are positioning for an upward price move. This shift reduces the risk of downside volatility and supports the case for a potential recovery rally.
XRP Market Outlook:
Despite short-term price consolidation below the $2.30 level, XRP derivatives traders appear to be positioning for a bullish breakout towards $2.50. With rising open interest, a positive long/short ratio, and reduced sell-side liquidations, XRP may be primed for an upward move—contingent on the broader market reaction to the Fed’s rate decision on Wednesday.
XRP Price Forecast: $2.50 Breakout Could Spur More Gains
XRP price forecast remains cautiously bullish as the price consolidates around $2.28, with technical indicators showing mixed signals ahead of a potential breakout. The Bollinger Bands (BB) midpoint at $2.33 remains a key resistance level, while the lower BB at $1.95 provides strong support. A decisive break above $2.33 could trigger momentum toward $2.50, where a breakout may fuel an extended rally.
XRP Price Forecast
The MACD indicator is flashing early signs of a bullish crossover, with the MACD line moving upward toward the signal line, suggesting waning bearish momentum. Additionally, the histogram bars are transitioning from red to green, reinforcing the potential for a bullish reversal. The previous 30% rally within four trading sessions, highlighted in the chart, sets a precedent for XRP’s ability to surge once a breakout occurs.
However, the recent 7.88% retracement over the last four sessions raises caution. A failure to reclaim $2.33 could see further declines, with $2.00 as the next major support. The trading volume of 609M during the recent pullback suggests some hesitation among buyers. If XRP can sustain momentum and break $2.50, it could target $2.70-$2.90 in the coming weeks. Conversely, rejection at resistance could trigger further downside consolidation.