During the last week of April, the crypto markets triggered a strong recovery, and most of the cryptos rebounded from their bottoms. Virtuals Protocol’s price also flipped after hitting the bottom below $0.6 and rose above $1.6. Multiple reasons account for the surge, and now that the token has triggered a strong upswing, the VIRTUAL price is expected to complete the parabolic recovery and experience another 130% upswing in the next few weeks.
The surge in the VIRTUAL price was followed by a popular exchange, Binance, which enabled deposits and trading by listing it. The listing led to stronger liquidity and new market interest as VIRTUAL became more easily accessible to all. Moreover, the Virtuals Protocol platform has launched the Genesis launch event, which was exploited by a project called PlayGame AI. Despite this, the token regained the trust of the investors, which materialised with the recent surge.
Now the question arises whether the VIRTUAL price will rise by another 100% after surging by over 200%?
The daily chart of VIRTUAL suggests the price has triggered a parabolic recovery and may follow the curve to rise and reach the neckline. After securing the range above the 50-day MA, the price has surged above the 200-day MA, which could further head towards a Golden Cross. On the other hand, the RSI has surged and entered the overbought range for the first time in 2025, validating the bullish claim. Therefore, the VIRTUAL price is believed to maintain a strong ascending trend and rise above the crucial resistance at $1.84 in a short while.
Here, the token may face some resistance. Once cleared, the next pitstop could be above $2.5, which may validate the beginning of a fresh bullish trend. Despite this, the on-chain data of Virtuals Protocol lags significantly behind the price, with a steep decline in the daily revenues that grew rapidly in the last few weeks of 2024. However, the buying volume has surged notably, which could keep up the momentum of the rally for the rest of 2025 and mark a new ATH above $7.
Murad Mahmudov, a well-known investor and meme coin proponent, predicts that older meme coins will continue to outperform their newer counterparts.
This forecast comes amid a broader bull run, where meme coins as a whole are benefiting from renewed investor enthusiasm.
Why Investors Are Betting Big on Older Meme Coins
According to CoinGecko data, the overall meme coin market capitalization has increased 17.33% over the past month. Among the top coins, Dogecoin (DOGE), Floki (FLOKI), and Pudgy Penguins (PENGU) have experienced 22.3%, 46.4%, and 116.6% appreciation, respectively, contributing greatly to the overall growth.
Furthermore, over the past day alone, the total market cap of meme coins has increased 4.9% to nearly $70 billion. Amid this market surge, a pseudonymous analyst, “boot”, stressed that investors are showing a growing preference for established mid- and large-cap meme coins over newly launched tokens.
“The best traders I know have pivoted entirely to mid/high-cap memes. Very few of these tokens launched in 2025. They won’t touch a new launch, regardless of the narrative. Do with that information what you will,” the analyst posted.
Moreover, he added that coins with large market caps are relatively safer investments compared to smaller, newer, or low-market-cap tokens.
Prominent crypto investor Murad echoed this sentiment in a reply to Boot’s post. The investor forecasts that coins launched in 2023 and select tokens from 2024 will maintain stronger performance.
“2023 and some 2024 coins will continue to outperform,” Murad said.
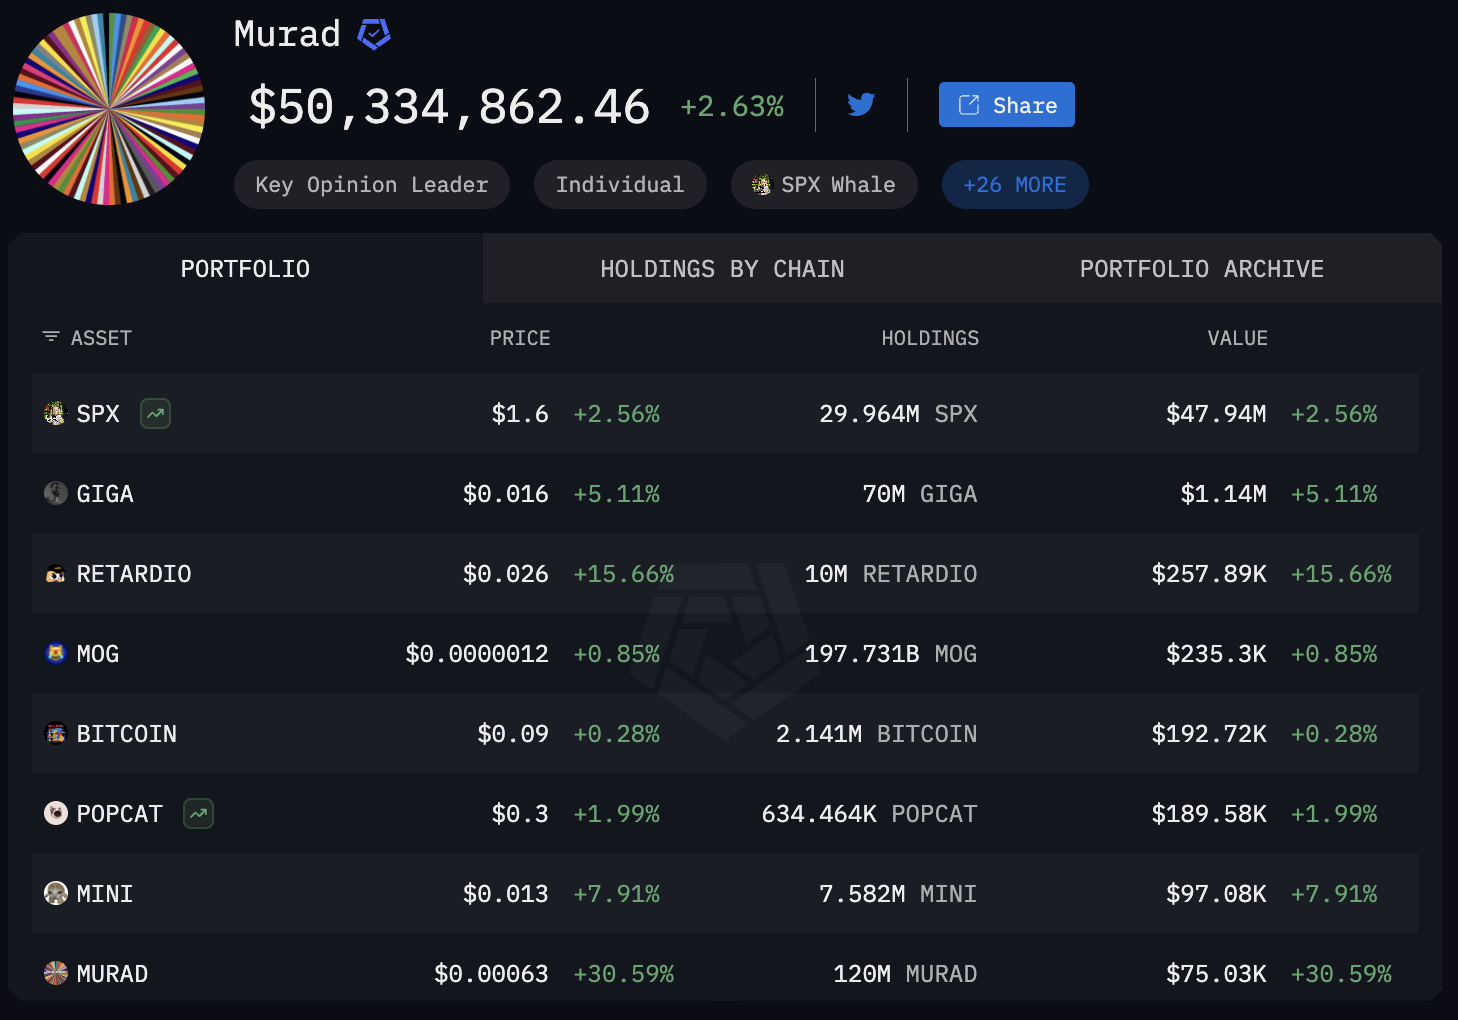
His confidence in older tokens aligns with his investment portfolio, which recently neared record highs, as reported by BeInCrypto. Data from Arkham Intelligence, a blockchain analytics platform, showed that Murad’s largest holdings by value, SPX6900 (SPX), Gigachad (GIGA), and Retardio (RETARDIO), are all older meme coins launched between 2023 and 2024.
But why would investors favor some coins over others? Analyst Ignas pointed out that this all comes down to the intention behind most token launches.
He said that many founders create tokens with their own personal gain in mind, not the community’s. In addition, many tokens lack excitement and purpose.
“When I buy a token, I want to DREAM BIG. Yet most projects focus on selling their features rather than their grand ambitions. Token is there to make your community dream,” he stated.
Nonetheless, another pseudonymous analyst, Xero, emphasized that investors are favoring older meme coins right now because the market is likely still in Phase 1 of the meme coin cycle. In this early stage of a bull run, capital tends to flow into established tokens before rotating to other meme coins.
“It think that’s because it’s phase 1. Before we have runners again we need multiple ath on older coins,” the analyst replied.
Therefore, for now, Murad’s prediction and the broader trader pivot suggest a strategic preference for older coins. Still, time will tell whether investors will continue to favor them or shift their strategies.
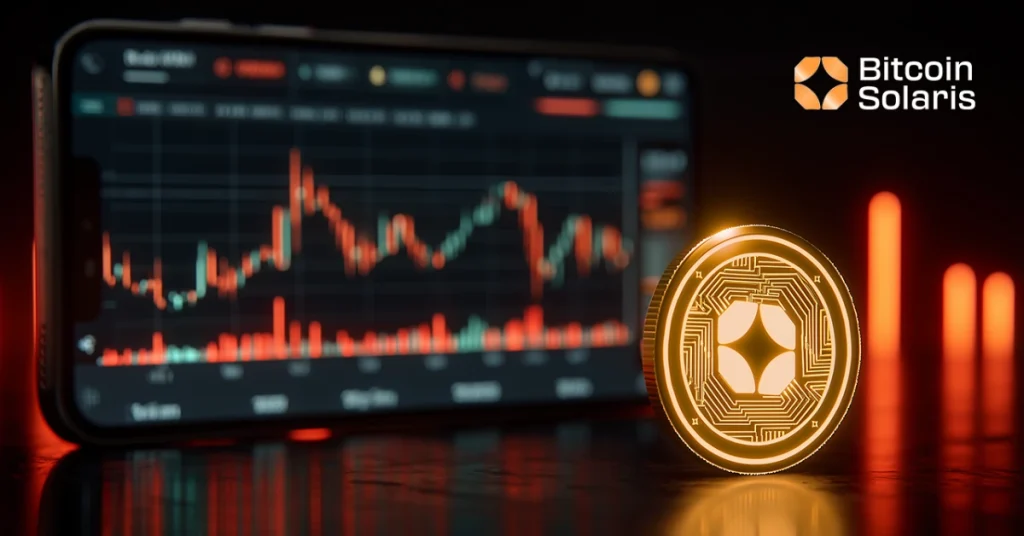
Bitcoin’s first wave of gains went to early participants — the ones mining and moving BTC before it hit headlines. Ethereum, Solana, and Avalanche followed similar patterns. The biggest returns always came before exposure, while networks were still small and tokens were still affordable.
Bitcoin Solaris is in that phase right now. The presale is live at $8 per token. More than $5 million has already been raised by over 11,500 wallets. The projected listing price is $20 — locking in a 150% gain before a single exchange opens.
But the difference here isn’t just timing. It’s function. BTC-S already powers products that reward users daily, with token velocity, live mining, and an expanding reward economy.
Daily Rewards, Real Token Flow
At the center of the Bitcoin Solaris economy is Nova — the mobile mining app that lets users earn BTC-S directly from their phones. It’s not a wrapped service or outsourced cloud pool. The system measures real usage and distributes token rewards based on device contribution, with no capital lockup or staking period required.
Early beta testers out-earned some of the largest staking platforms, all without buying rigs or running wallets 24/7. The app is in active rollout, with more users onboarded as presale expands.
BTC-S also moves through the Bitcoin Solaris Casino — an on-chain reward engine that distributes tokens daily. All verified users get one free spin per day, with instant payout chances. Buyers who hit specific spending tiers unlock larger reward pools, including up to 0.5 BTC in bonuses. The spin logic is automated and smart contract-driven — no centralized draw, no delayed credits.
These systems keep BTC-S circulating before it even hits public markets. That flow drives demand, creates winners daily, and reinforces the core value loop that’s already running.
Presale at $8, Capped Supply, and No Inflation
Only 4.2 million BTC-S tokens are available in the presale. The total supply is capped at 21 million — forever. There are no future emissions, no inflation schedules, and no hidden unlocks waiting to dilute value. What’s being sold now is the only public supply until listings.
At $8, the token is still priced under 40% of its projected launch value. With active products already distributing BTC-S and more utilities on the way, the price is still trailing the value.
Every user participating now is ahead of both the listing and the demand wave that comes with it. The opportunity isn’t just in scarcity — it’s in position. This is the phase where utility already works, but market access hasn’t priced it in yet.
Audited, Verified, and Already Covered by Analysts
In a recent breakdown, Token Empire called Bitcoin Solaris the only project under $10 where rewards are moving, products are active, and upside hasn’t been locked out.
Product Momentum Is Pushing Value Forward
BTC-S isn’t sitting in wallets. It’s circulating. Between Nova and the Casino, tokens are moving daily, creating reward loops that continue to grow as new users join in.
The next expansion is the Mining Power Marketplace — a live-use platform that lets users monetize unused processing power or rent capacity using BTC-S. The feature is already in development and ties directly into the network’s value cycle.
Wallet upgrades, testnet deployment, and developer tools are all scheduled for release this year. These aren’t stretch targets. They’re tracked, funded, and moving forward with presale capital that’s already raised.
Bitcoin Solaris isn’t a theory or a bet on potential. It’s a network already distributing tokens, already rewarding users, and still sitting at just $8 per token. The $20 listing target gives new buyers immediate upside. But the real value is in getting in before BTC-S becomes harder to earn — and more expensive to buy.
The post Bitcoin Solaris: The $8 Token Set to Explode Like Early Bitcoin – Crypto Presale Already Raised $5 Million appeared first on Coinpedia Fintech News
Bitcoin’s first wave of gains went to early participants — the ones mining and moving BTC before it hit headlines. Ethereum, Solana, and Avalanche followed similar patterns. The biggest returns always came before exposure, while networks were still small and tokens were still affordable. Bitcoin Solaris is in that phase right now. The presale is …
According to the latest reports from Reuters, the exchange had prior knowledge of the data breach but delayed public disclosure, sparking concerns about transparency and security practices. Coinbase suffered a major data breach last month, exposing sensitive customer information, including names, addresses, and phone numbers. Coinbase Hack: Prior Knowledge & Delayed Disclosure Raise Concerns In a surprising revelation, Reuters reported that Coinbase had prior knowledge of a customer data leak as early as January. This raises questions about the company’s delayed public disclosure. According to Coinbase’s SEC filing, the company was aware that contractors had accessed unnecessary data in the “previous months”. The company added that they didn’t know that it was part of the larger operation until they received an extortion demand on May 11. On May 15, as CoinGape reported, Coinbase revealed a significant hack that involved the stealing of personal information of high-profile users like Sequoia Capital’s… Read More at Coingape.com