Last week, US-listed spot Bitcoin exchange-traded funds (ETFs) recorded net inflows exceeding $600 million.
While this marked a continuation of positive capital movement into digital asset products, it also had the lowest weekly inflow figure in the past month, signaling investor caution or profit-taking at higher levels.
ETF Inflows Slow as Price Consolidation Cools Investor Appetite
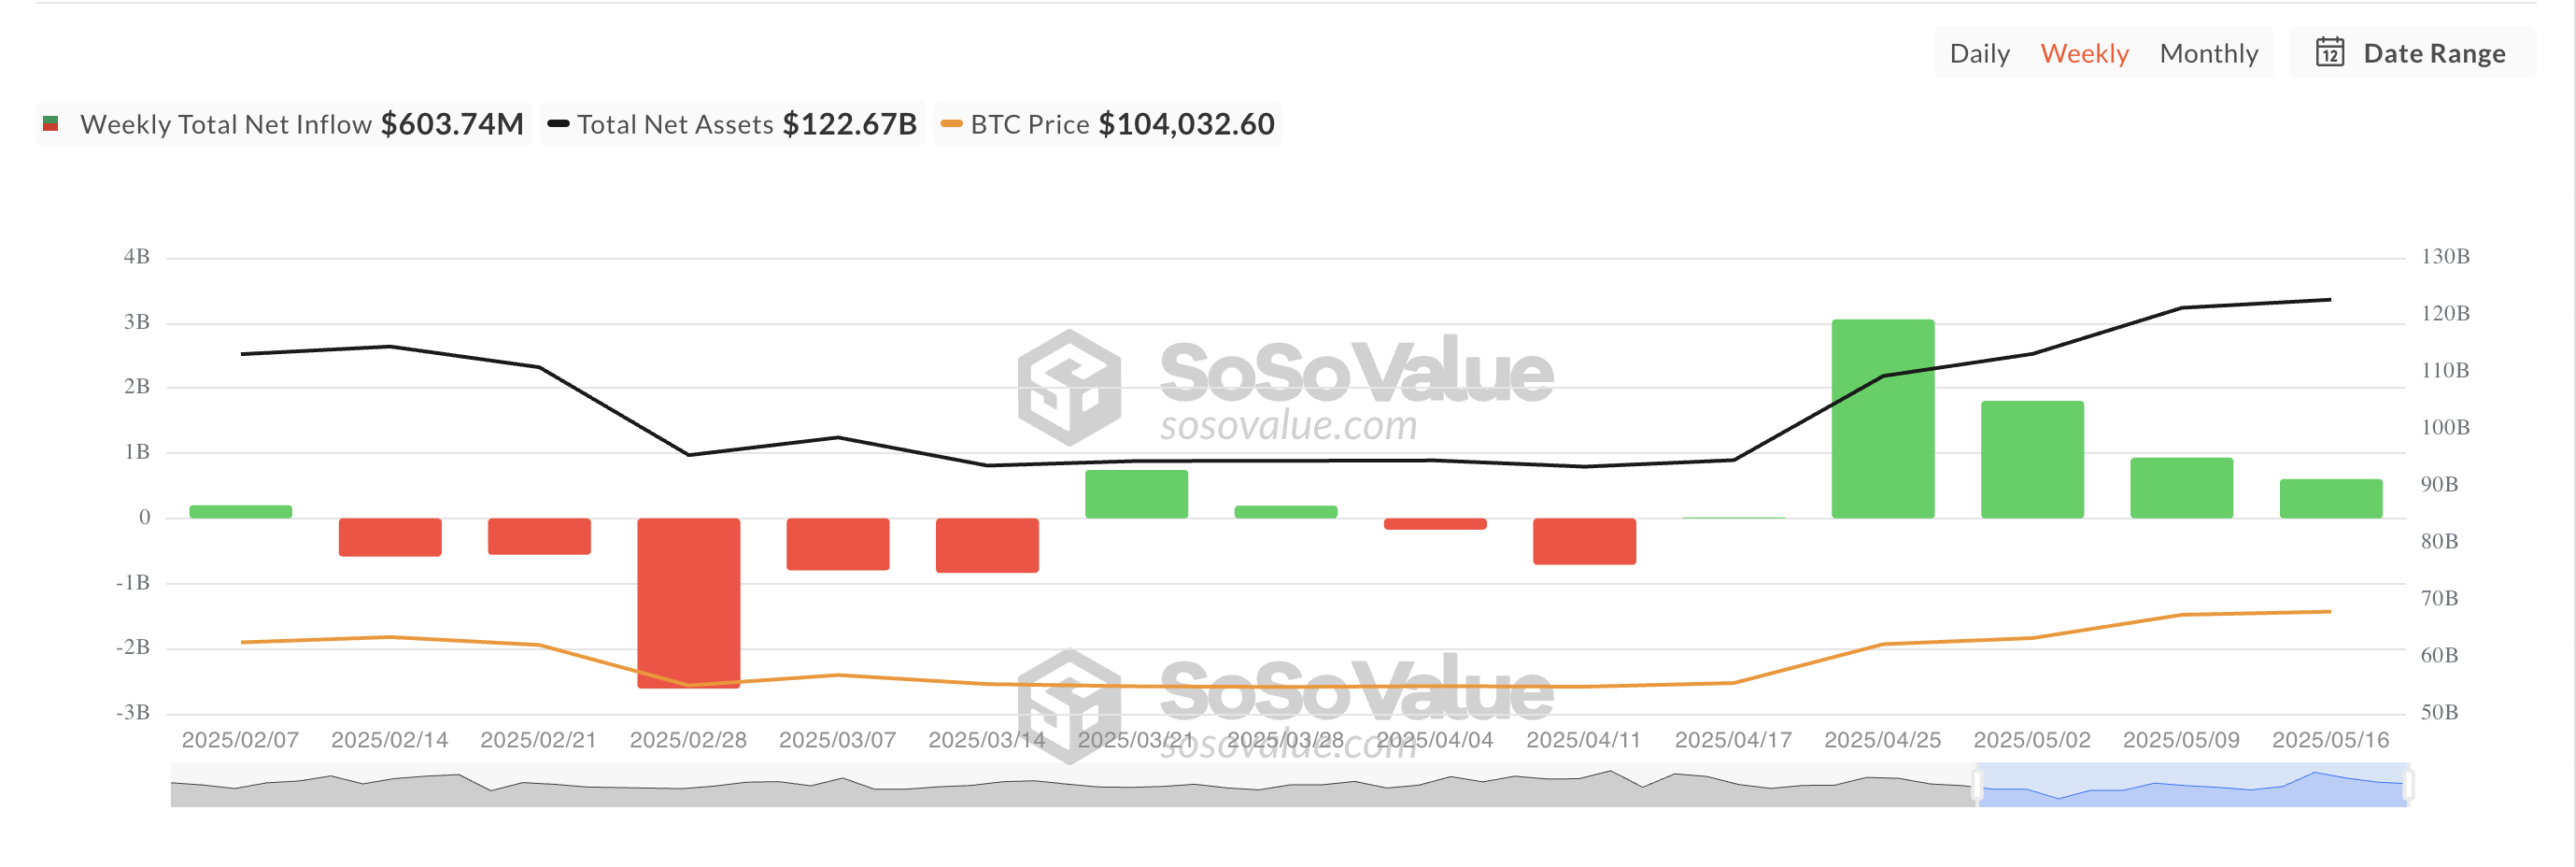
Between May 12 and May 16, inflows into spot BTC ETFs totaled $603.74 million. Although this was a net positive in terms of inflow into these funds, last week’s figure was the lowest weekly inflow in the past month. This highlights a more cautious but sustained capital movement into the market.
Total Bitcoin Spot ETF Net Inflow. Source: SosoValue
The slowdown in ETF inflows can be linked to BTC price consolidation during the five-day period under review. Throughout that period, BTC traded sideways, facing resistance at around $104,971 while finding consistent support at $102,711.
This lack of clear movement likely led some investors to be more cautious, resulting in reduced capital inflows into BTC ETFs last week.
BTC Eyes Fresh Highs
Still, bullish momentum persists in the BTC market. The king coin briefly surged to a three-month high of $107,108 during Monday’s early Asian trading session. While it has since corrected to trade at $104,956, the bullish bias toward the coin remains significant.
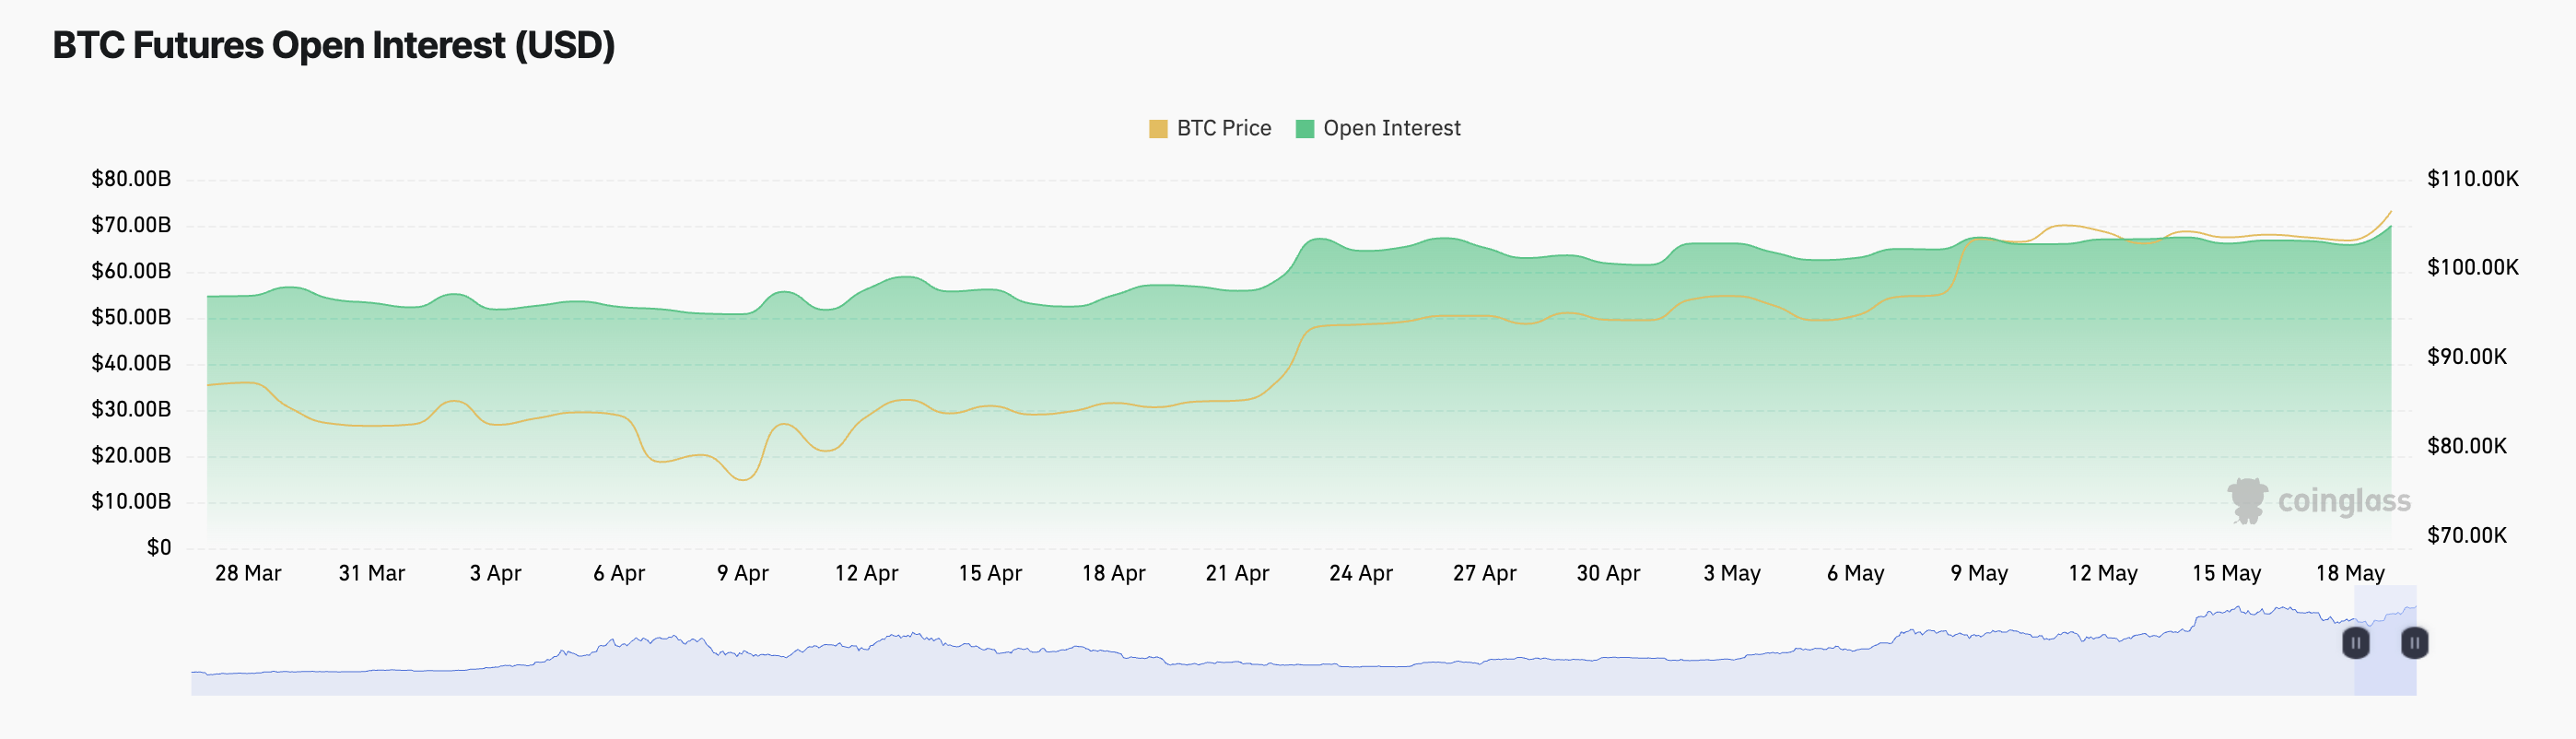
BTC’s price uptick comes alongside a rise in its futures open interest. This stands at $70.03 billion at press time, climbing 7% over the past day.
Open interest refers to the total number of outstanding derivative contracts, such as futures or options, that have not been settled. When open interest rises alongside price, it typically signals that new money is entering the market. This supports the strength of BTC’s ongoing trend and could trigger a sustained price uptick in the near term.
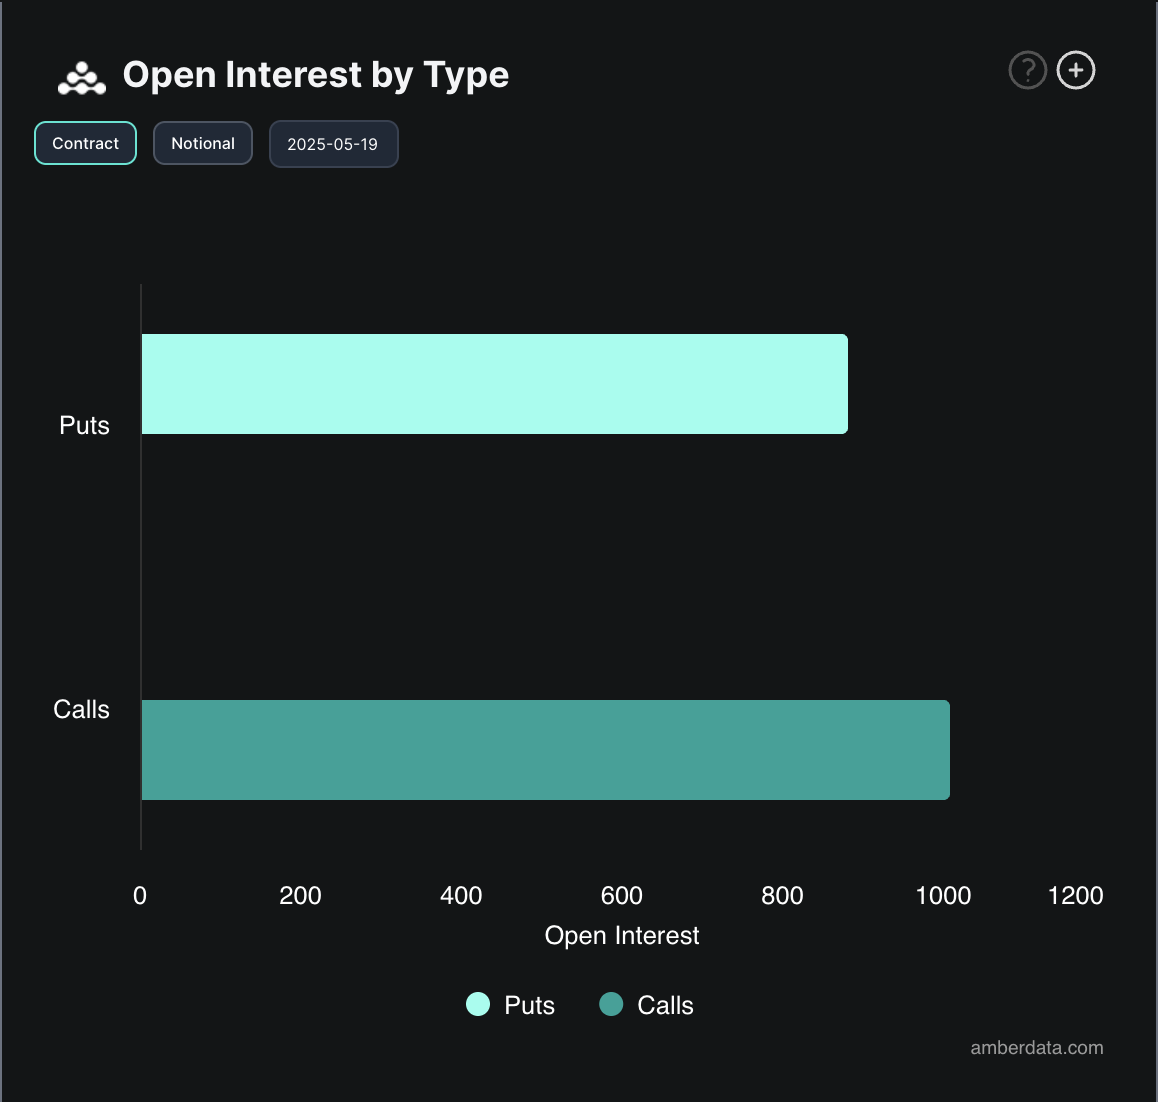
Moreover, options market data further supports this optimistic outlook. Today, the demand for call options has outpaced puts, pointing to a growing demand for bullish positioning.
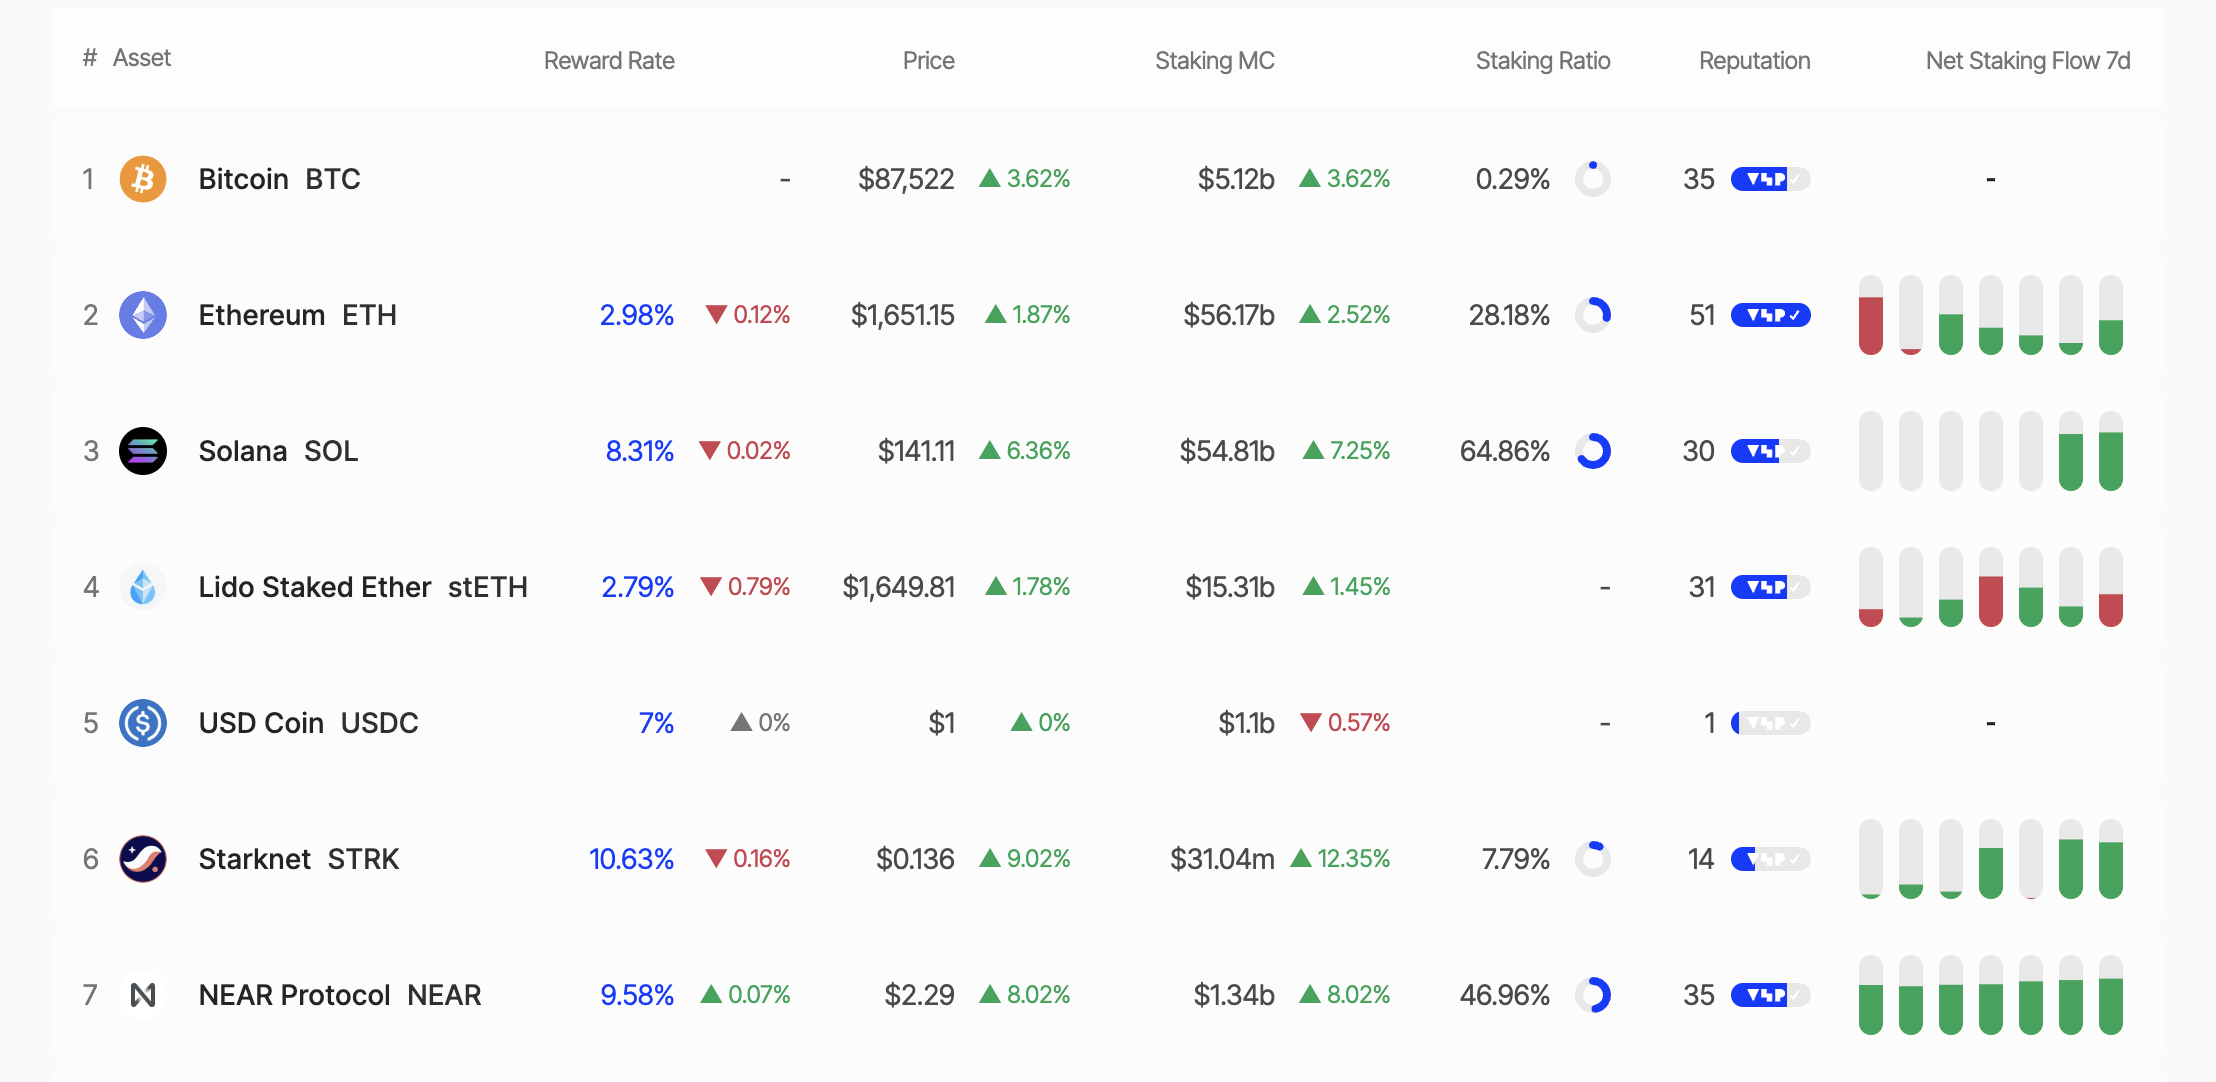
According to data from StakingRewards, Solana (SOL) has overtaken Ethereum (ETH) in staking market capitalization, reaching $53.15 billion compared to Ethereum’s $53.72 billion.
This milestone has sparked heated discussions across the social media platform X, raising the question: Is this a turning point for Solana, or merely a short-lived surge?
Solana Outpaces Ethereum As High Staking Yields Prove Appealing
Recent data reveals that 64.86% of Solana‘s total supply is currently staked, delivering an impressive annual percentage yield (APY) of 8.31%. In contrast, Ethereum has only 28.18% of its supply staked, with an APY of 2.98%.
Staking rewards for Solana and Ethereum. Source: StakingRewards
This disparity highlights Solana’s growing appeal for investors seeking passive income through staking. Staking market capitalization is calculated by multiplying the total number of staked tokens by their current price. With SOL priced at $138.91 as of this writing, Solana has officially surpassed Ethereum in this metric.
However, Solana’s high staking ratio has sparked some controversy. Critics, such as Dankrad Feist on X, argue that Solana’s lack of a slashing mechanism (or penalties for validator violations) undermines the economic security of its staking model. With its slashing mechanism, Ethereum offers greater security, despite its lower staking ratio.
“It’s very ironic to call it ‘staking’ when there is no slashing. What’s at stake? Solana has close to zero economic security at the moment,” Dankrad Feist shared.
Increased Whale Activity Signals Caution
Meanwhile, recent moves by “whales” (large investors) have further fueled interest in Solana. On April 20, 2025, a whale unstaked 37,803 SOL (worth $5.26 million). Similarly, Galaxy Digitalwithdrew 606,000 SOL from exchanges over four days (April 15–19, 2025), concluding with 462,000 SOL.
Additionally, on April 17, 2025, a newly created wallet withdrew approximately $5.15 million worth of SOL from the Binance exchange. In the same tone, Binance whales withdrew over 370,000 SOL tokens valued at $52.78 million.
While some whales withdrew their SOL holdings, other large holders accumulated. Janover, a US-listed company, increased its Solana holdings to 163,651.7 SOL (worth $21.2 million) and partnered with Kraken exchange for staking on April 16, 2025.
These actions signal diverging plays from institutional investors and whales, as the Solana price fluctuates around key levels.
SOL Price Analysis: Opportunities and Challenges
As of this writing, SOL was trading at $140.49, up 3.53% in the past 24 hours. Analysts highlight $129 as crucial support for the Solana price, with $144 presenting the key roadblock to overcome before Solana’s upside potential can be realized. Breaking above the aforementioned roadblock could propel SOL toward new highs.
The most important support for SOL is at $129. Source: Ali/X
Conversely, dropping below the $129 support level could trigger increased selling pressure. Nevertheless, SOL has shown a remarkable recovery, with a 14.34% increase over the past week.
Another factor to consider is the ongoing development of the Solana ecosystem. Key innovations include the QUIC data transfer protocol, the combination of Proof-of-History (PoH) and Proof-of-Stake (PoS), and the diversification of validator clients.
With these, Solana continues to enhance its performance and decentralization. Additionally, the launch of the Solang compiler, compatible with Ethereum’s Solidity, has attracted developers from the Ethereum ecosystem.
BeInCrypto also reported on Solana’s upcoming community conference, otherwise termed Solana Breakpoint. Key announcements from this event could provide further tailwinds for the SOL price.
Nevertheless, despite surpassing Ethereum in staking market capitalization, Solana faces significant challenges. Ethereum benefits from a more mature DeFi ecosystem, greater institutional trust, and enhanced security through its slashing mechanism.
To some, Ethereum’s lower staking ratio (28%) may be a deliberate strategy to reduce network pressure and ensure liquidity for DeFi applications.
In contrast, Solana’s high staking ratio (65%) could limit liquidity within its DeFi ecosystem. This raises the question of whether Solana can strike a balance between staking and the growth of its decentralized applications.
As Solana continues challenging Ethereum’s dominance, the crypto community remains divided. Is Solana’s rise a sustainable breakthrough, or just another wave of hype?
Pi Network (PI) is showing mounting technical weakness, down nearly 15% over the past seven days and 4.4% in the last 24 hours, with its market cap now sitting at $5.12 billion. Trading volume has surged 25% in the past day, reaching $104.6 million, signaling heightened activity amid a deepening downtrend.
Key indicators like the ADX, CMF, and EMA structure all point to growing bearish momentum, with selling pressure intensifying and price action struggling to hold support. Unless momentum shifts, PI appears vulnerable to further downside in the near term.
PI Network’s Bearish Trend Strengthens
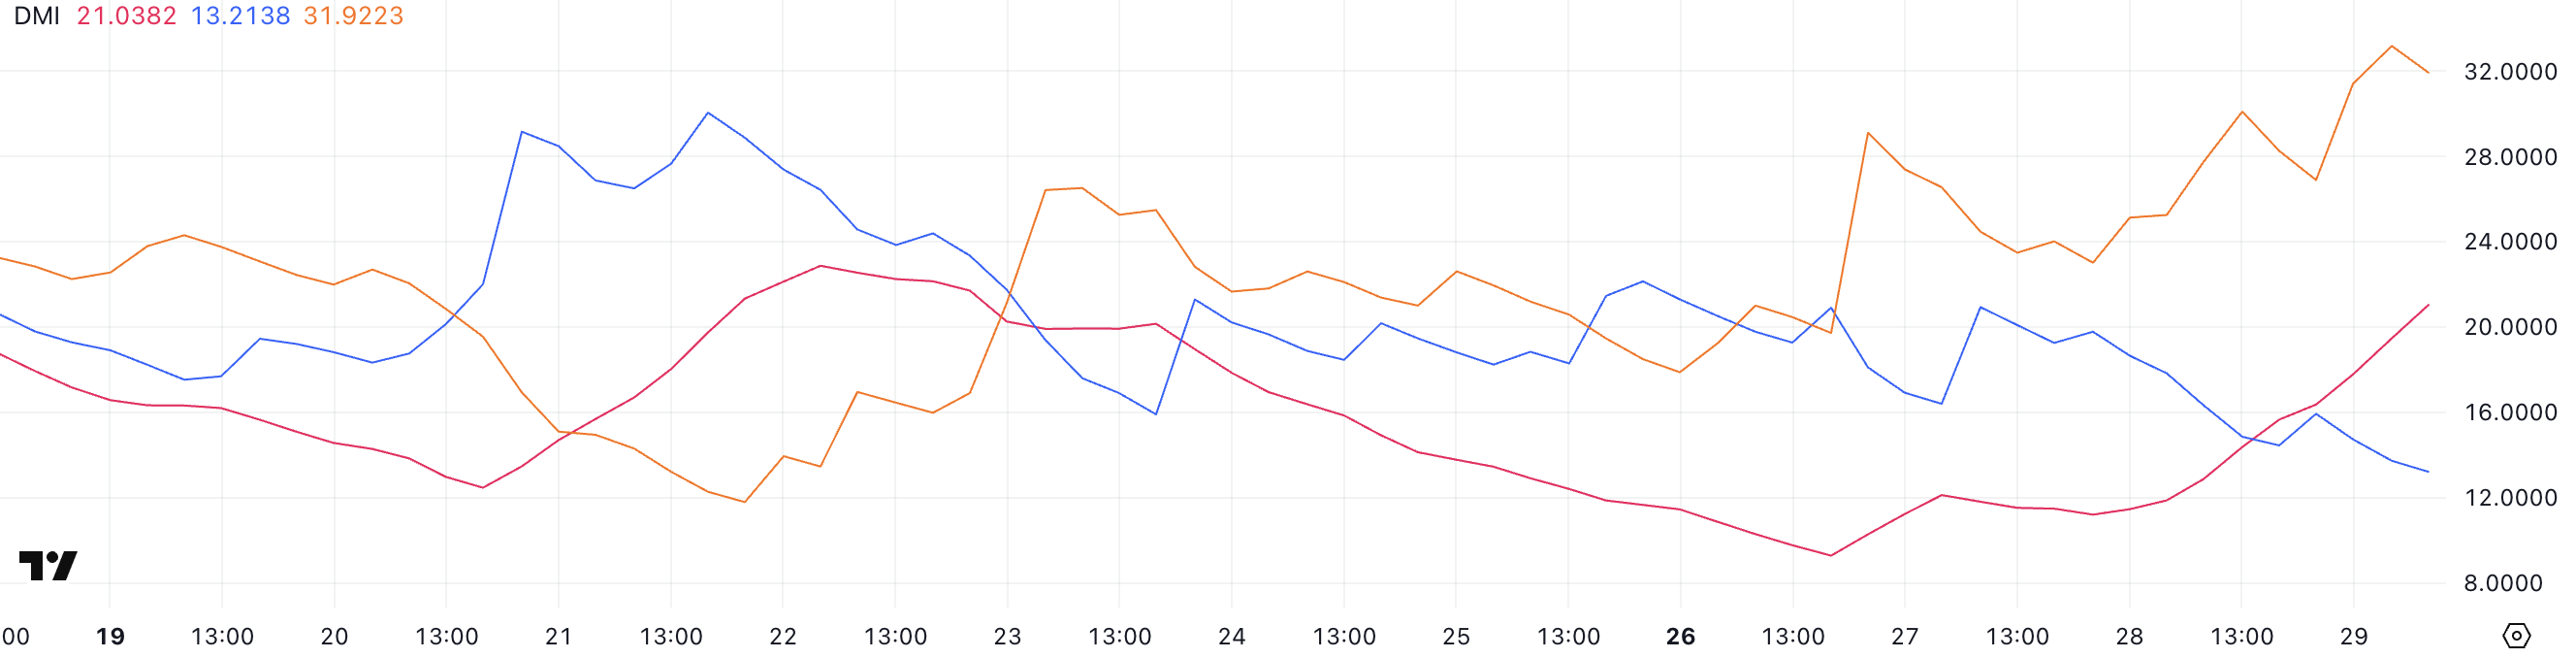
The Directional Movement Index (DMI) chart for Pi Network (PI) shows a notable rise in the Average Directional Index (ADX), which has climbed to 21 from 11.46 just a day earlier.
The ADX measures the strength of a trend, regardless of direction. Generally, an ADX below 20 suggests a weak or non-trending market, while readings above 20 indicate that a trend is beginning to gain strength.
With PI’s ADX now breaking above this threshold, the data suggests that a more decisive move—either bullish or bearish—may be developing.
Looking deeper, the +DI (Positive Directional Indicator) has dropped to 13.21 from 20.93 two days ago, while the -DI (Negative Directional Indicator) has surged to 31.92 from 23.48.
This widening gap, with -DI clearly dominant, signals increasing downward pressure on PI. When the -DI rises above the +DI alongside a strengthening ADX, it typically confirms a bearish trend gaining momentum.
In short, the indicators are aligning to suggest PI may be entering a stronger downtrend, and traders should watch closely for follow-through in price action.
Indicators Show Strong Selling Pressure
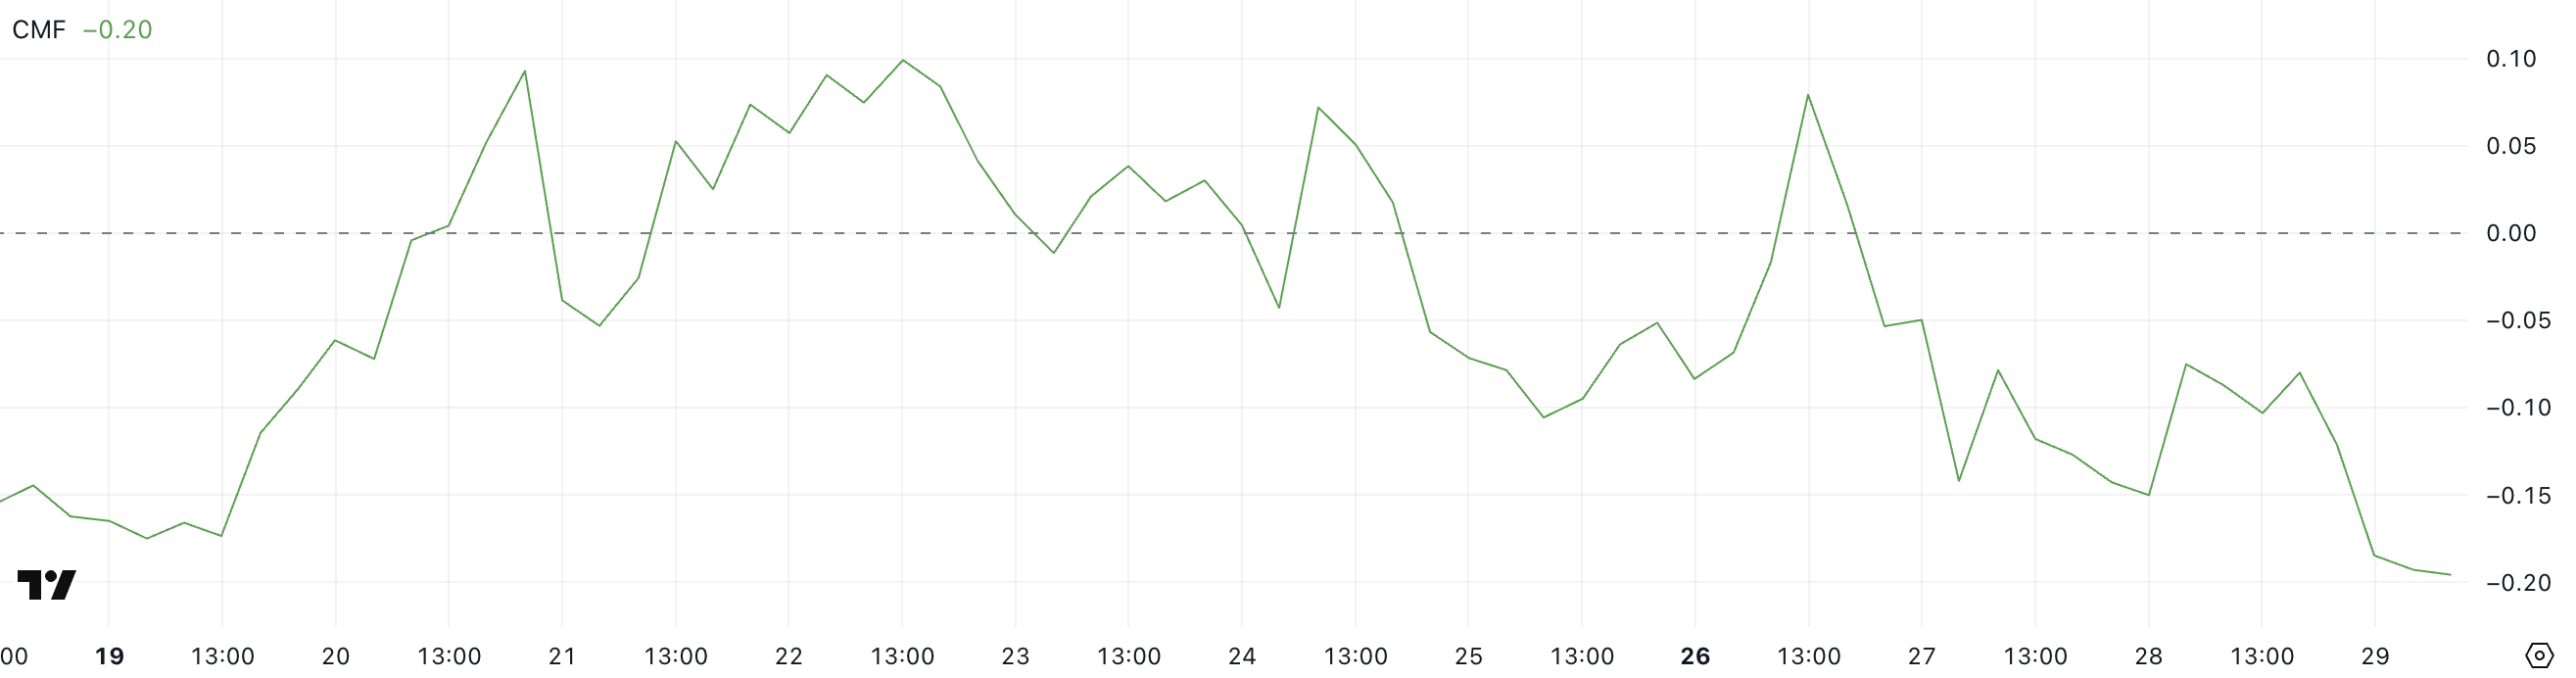
The Chaikin Money Flow (CMF) for Pi Network (PI) has dropped sharply to -0.20, down from 0.08 three days ago and -0.08 just one day ago.
The CMF is a volume-weighted indicator that measures the flow of money into and out of an asset over a set period, typically 20 or 21 days.
Values above 0 generally indicate buying pressure and accumulation, while values below 0 suggest selling pressure and distribution. A CMF reading beyond ±0.10 is usually considered significant, with deeper negative values pointing to sustained outflows.
With PI’s CMF now at -0.20—its lowest reading since May 17—there’s a strong signal that sellers are in control.
This steep drop reflects increasing capital leaving the asset, and when combined with recent price weakness, it reinforces a bearish outlook.
If CMF continues to decline or holds at deeply negative levels, it may suggest that any bounce attempts could face heavy resistance due to a lack of bullish volume support.
PI Price Eyes Lower Support
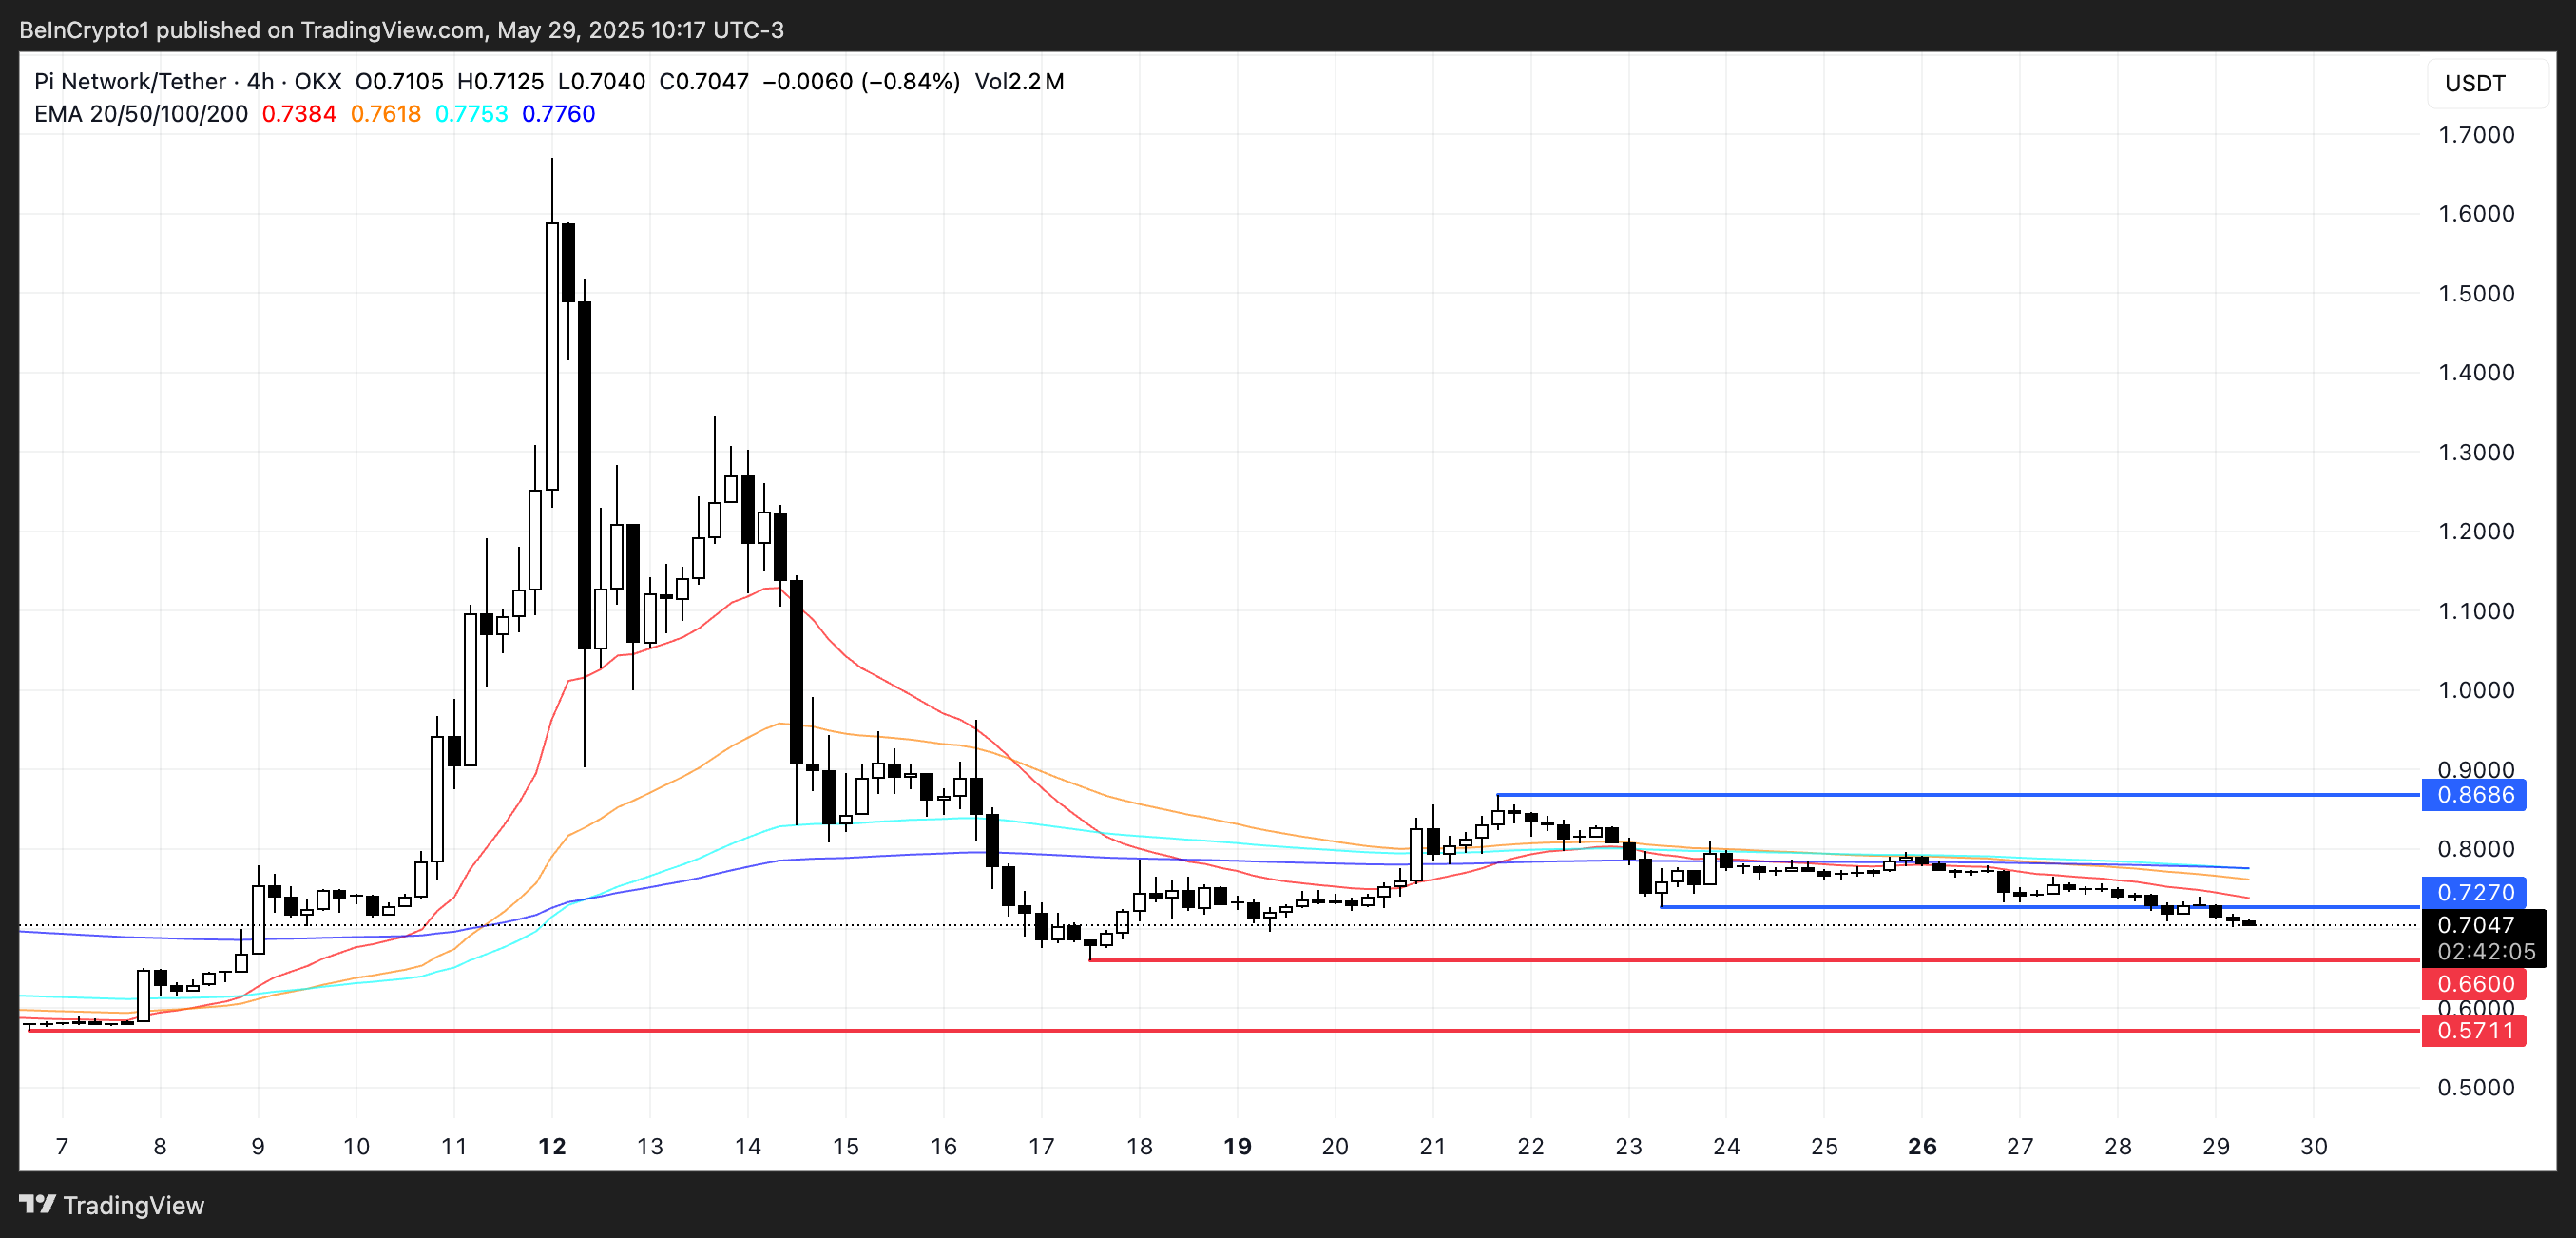
The Exponential Moving Average (EMA) indicators for PI remain bearish, with short-term EMAs positioned below long-term ones—a clear sign that downward momentum is still in control.
The growing distance between these EMA lines reinforces the strength of the current downtrend. If PI continues to slide, the next support level lies at $0.66, and losing that could open the door for a further decline toward $0.57.
On the flip side, if PI manages to reverse its current trajectory, the first key resistance to watch is at $0.727. A breakout above that level could signal a short-term recovery and potentially send the price higher toward the $0.86 mark.
However, until short-term EMAs start to flatten or cross above the longer-term ones, any bullish attempts may remain vulnerable to selling pressure.