Ethereum is poised to increase its gas limit capacity as Co-Founder Vitalik Buterin urges caution, with the network approaching a pivotal scaling decision. Vitalik Buterin Says Ethereum Is Ready for a Gas Limit Bump Vitalik Buterin, co-founder of Ethereum, has confirmed that almost 50% of validators have signaled support for raising the Layer 1 gas
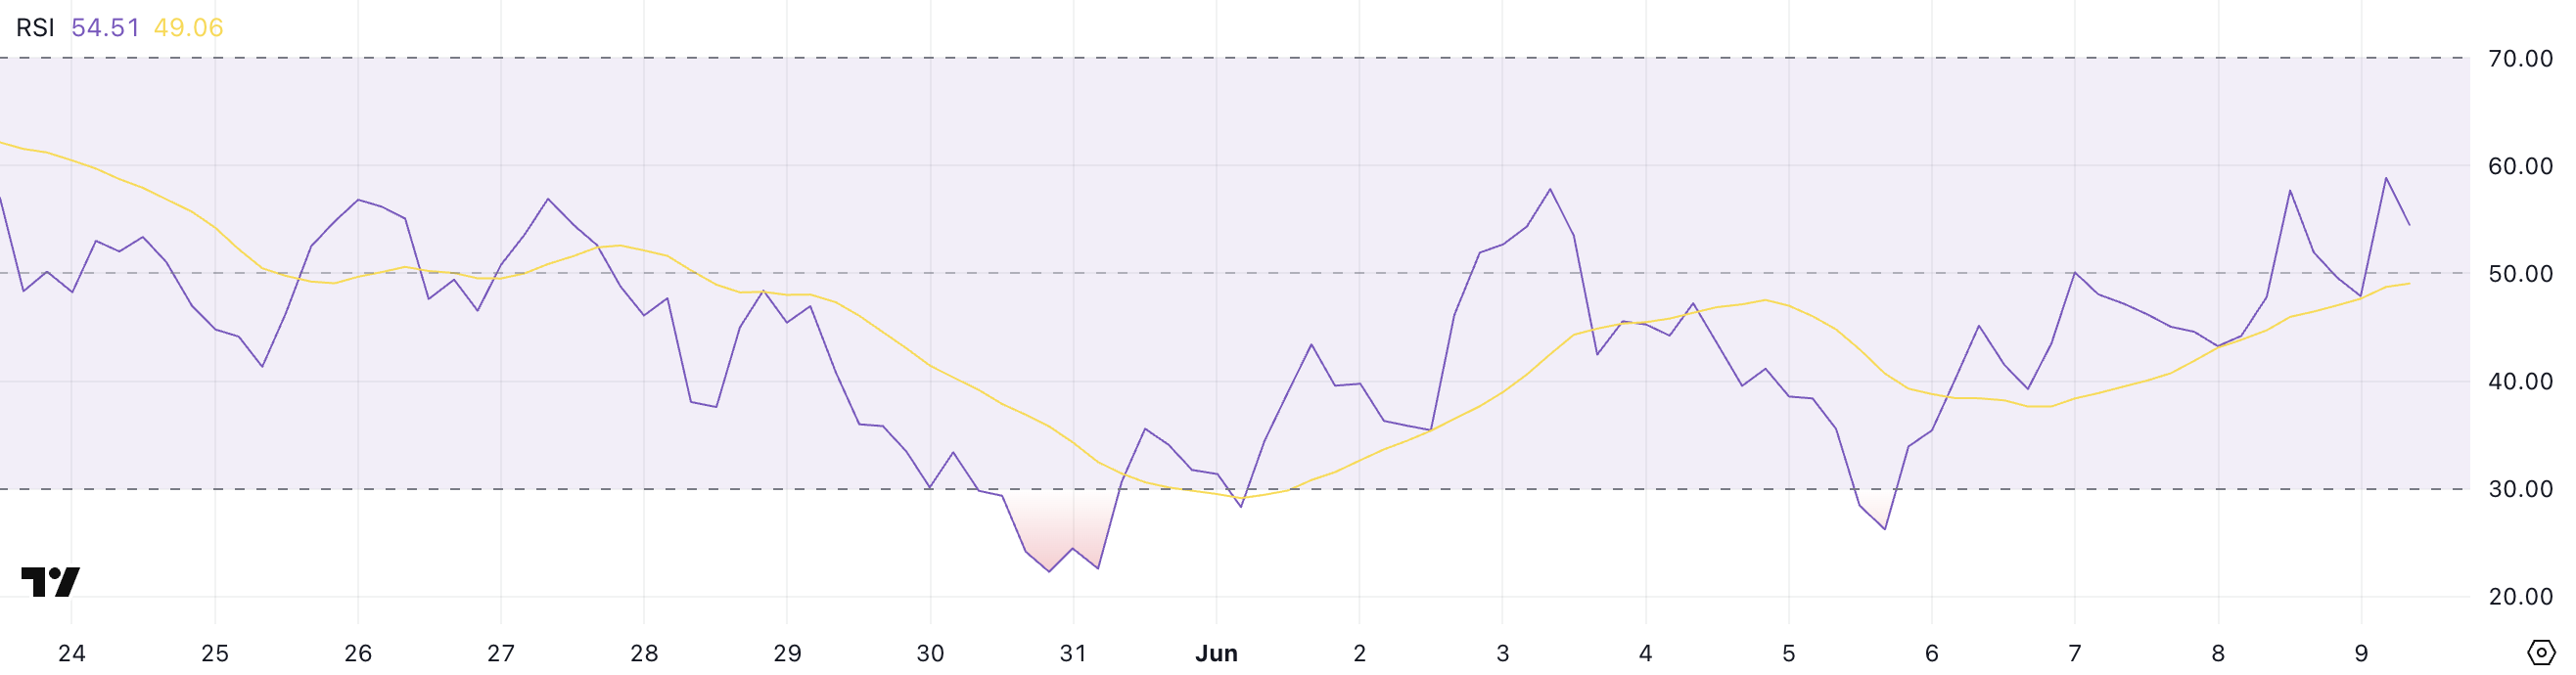
Solana (SOL) has a market cap above $80 billion but is down over 10% in the last 30 days. Despite a recent bounce, its price has stayed below $170 since May 29. The RSI has recovered to 54.51 but failed to break above 60, showing limited bullish strength.
The Ichimoku Cloud remains red and thick, signaling strong resistance ahead. The Tenkan-sen has crossed above the Kijun-sen, but the price is still inside the cloud. The EMA structure is still bearish, with short-term lines below long-term ones. Solana needs stronger momentum to break out and confirm a trend reversal.
Solana RSI Rebounds but Struggles to Cross 60 Threshold
SOL is showing early signs of a momentum shift, with its Relative Strength Index (RSI) currently at 54.51—up significantly from 39.26 just three days ago.
Since yesterday, RSI has been attempting to break above the 60 level, a threshold that often signals stronger bullish momentum.
While the climb from sub-40 levels suggests recovering buyer interest, the RSI remains stuck in the neutral zone for now, indicating hesitation among bulls to fully reclaim control.
The RSI is a widely used momentum indicator that ranges from 0 to 100. It is designed to measure the speed and change of price movements.
Readings above 70 typically indicate overbought conditions, while readings below 30 signal oversold levels. A value around 50 is considered neutral.
With SOL’s RSI currently at 54.51, the market is cautiously bullish, but a failure to push beyond 60 may limit further upside in the short term.
SOL Battles Resistance Within Bearish Ichimoku Cloud
Solana price is testing a critical resistance area defined by the Ichimoku Cloud. The price recently pushed into the red cloud from below, indicating an attempt to reverse the prevailing bearish trend.
However, the cloud remains thick and red—signaling that resistance is strong and the broader sentiment has yet to flip bullish.
The Leading Span A (green line) is still below the Leading Span B (red line), confirming that the cloud remains in bearish alignment.
The Tenkan-sen (blue line) has crossed above the Kijun-sen (red line), typically an early bullish signal. Additionally, the price is hovering around these conversion lines, showing some short-term upward momentum.
However, with the price still inside the cloud and the future cloud projecting continued resistance, SOL needs a strong breakout above the cloud to confirm a bullish reversal.
Until then, the trend remains uncertain, and the cloud’s upper boundary will act as a key hurdle.
Solana Rallies Above $150, But EMA Structure Remains Bearish
Solana price has climbed nearly 8% over the past four days, breaking above the $150 mark and showing renewed bullish interest.
Despite this rally, the EMA lines still reflect a bearish setup, with short-term averages below the longer-term ones. If the current momentum continues, SOL could push higher to test resistance at $163.76.
A breakout there might open the door to $169.20, and in a scenario of strong, sustained buying, the price could rally as high as $179.50—marking a potential 16.7% upside from current levels.
However, this bullish path depends on the strength of the ongoing uptrend.
If Solana fails to hold above its recent breakout level and the support at $150.65 is lost, the price could fall back toward $141.53.
XRP is currently trading near $2 after bouncing back from $1.61, with many traders viewing this as a setup for its next significant move.
The Ripple vs. SEC battle is over, and with a pro-crypto SEC boss now in place, XRP’s path seems clearer, making it a more appealing asset. Back in January, XRP reached a high of $3.39, but the recent dip feels more like a reset than a full retreat.
With IPO plans and XRP ETF filings generating bullish momentum, some analysts are still forecasting a potential dip, suggesting that for investors, this could be an opportunity to buy low before the next wave begins.
XRP Price Prediction: What Next?
According to market veteran Peter Brandt, there may be limited upside from the current price levels. He recently shared a chart predicting that XRP could end the year between $1.02 and $2, signaling potential stagnation.
Brandt is observing a head and shoulders pattern on XRP’s chart, and if the asset fails to hold above the $2 level, he believes a drop toward $1 could be in play. While this prediction may seem conservative, it’s based on classic chart analysis rather than market hype.
On the flip side, Standard Chartered, a major global bank, has issued an XRP price prediction of $5.50 by the end of 2025, with the possibility of it climbing even higher to $12.50 by 2028.
Meanwhile, crypto veteran Davinci Jeremie remains highly bullish, suggesting that XRP could even surge to $24 this year, pointing to support potentially coming from within the government.
The overall crypto market remains in a wait-and-watch phase, with many altcoins, including XRP, moving sideways after a strong start to the year. According to Dark Defender, a respected crypto analyst, XRP is nearing the end of its months-long consolidation phase, with bulls defending the $2 level.
Dark Defender believes this is the final stage before a potential breakout. Using a 5-wave pattern, the analyst predicts XRP could rally to $5.85 in the coming months, potentially achieving a fresh all-time high once Wave 5 kicks in. While the mood is cautious, the optimism is palpable as traders watch for a breakout.
XRP News: Overcoming Ethereum in Market Cap
In the latest XRP news, crypto analyst EDO Farina reported that XRP has officially overtaken Ethereum in Fully Diluted Market Cap, with XRP now valued at $208.4B compared to Ethereum’s $192.5B. Farina highlights that XRP has outperformed Ethereum for over six months, suggesting that the much-discussed “flippening” may already be in motion.
Never Miss a Beat in the Crypto World!
Stay ahead with breaking news, expert analysis, and real-time updates on the latest trends in Bitcoin, altcoins, DeFi, NFTs, and more.
The post XRP Price Prediction 2025 appeared first on Coinpedia Fintech News
XRP is currently trading near $2 after bouncing back from $1.61, with many traders viewing this as a setup for its next significant move. The Ripple vs. SEC battle is over, and with a pro-crypto SEC boss now in place, XRP’s path seems clearer, making it a more appealing asset. Back in January, XRP reached …
Fartcoin surged 173% in April, becoming the top-performing memecoin with a market cap of $1.14 billion and strong whale-driven activity.
PENGU saw a +136.35% weekly gain, but monthly growth slowed to +102% from 153% on 28th April, with a potential pullback on the horizon.
: Whale purchases of Fartcoin, including a $2.48 million increase, add volatility and bullish sentiment to the token’s rise.
Despite a short-term pullback, PENGU holds a bullish market structure, with support at $0.0100–$0.0110 crucial for continued upward momentum.
PENGU’s volume surged to $1.2B, driven by institutional and retail interest, though high leverage signals potential short-term volatility.
April has proven to be a breakthrough month for memecoins; in addition to their close correlation towards the major cryptocurrencies with their move towards the top on the altcoin charts monthly, Solana-based tokens have taken the top position in April, both with the latest gains and also market money transferred to be staked in them.
Fartcoin (FARTCOIN) has claimed the title of top-performing solana memecoin with +171.42% for the month. It is currently priced at $1.15 and boasts a market cap of $1.14 billion and a 24-hour trading volume of $255.86 million.
On the weekly performance side, Pudgy Penguins (PENGU) managed a +136.35% 7-day increase, moving its price to $0.01203, and it has enjoyed a monthly climb of +102.02%, although it fell from 3rd to 6th in 24 Hours since 28th April in monthly performance rankings of memecoins.
PENGU’s rise has also caused it to outperform TRUMP coin this week, as TRUMP coin rallied 62.42% – but did not cause the same level of traction after the u.s president with an exclusive event for the top 220 TRUMP holders event on May 22 to be hosted in New Jersey.
One of the better coins overall has been Brett (BRETT) which is currently priced at $0.06493 in April and has a month gain of +110.71%, while also experiencing similar week monthly metrics. Finally, Bonk (BONK) has reported a monthly return of +75.25%, while currently priced at around $0.00002019. Bonk currently has a 24-hour trading volume of $382.43 million.
PENGU Coin Price Pulls Back After 260% Rally, Bulls Eye $0.0205 Breakout
PENGU coin has shown impressive bullish strength, rallying over 260% from its base around $0.0040 to a recent high of $0.0144, breaking out from months of consolidation. However, after this sharp rally, the price has pulled back by 2%, currently sitting at $0.0118, near the key short-term support zone of $0.0100–$0.0110. This level is critical as it has acted as both a trendline retest and support, making it a key area to watch for potential price action.
The RSI, now at 75.82, remains above 70, indicating that buyers are still in control, though momentum has cooled. The MACD continues to show a bullish crossover, reinforcing the likelihood of trend continuation. If the price holds above this support zone, we could see a move towards $0.0145, $0.0170, and eventually $0.0205, aligned with the 38.2% Fibonacci retracement level.
A breakout above $0.0205 could pave the way for a mid-term rally toward $0.0256, $0.0343, or even $0.0500 in the next 6–10 weeks, depending on volume and broader market conditions.
Short-term traders should monitor the $0.0100–$0.0110 support zone closely. If this area holds, it could signal a rebound towards higher levels. Long-term traders can maintain a bullish outlook as long as the price stays above the 20 and 50 EMA ($0.0074), which continue to offer dynamic support.
After a 260% surge, PENGU is in a consolidation phase, and if support holds, the next leg higher could come quickly.
Overall, after a 260% surge, PENGU is in a textbook consolidation phase — and if the support holds, the next leg higher could come swiftly.
FARTCOIN (FARTCOIN) Price Eyes Breakout as Handle Formation Nears Completion
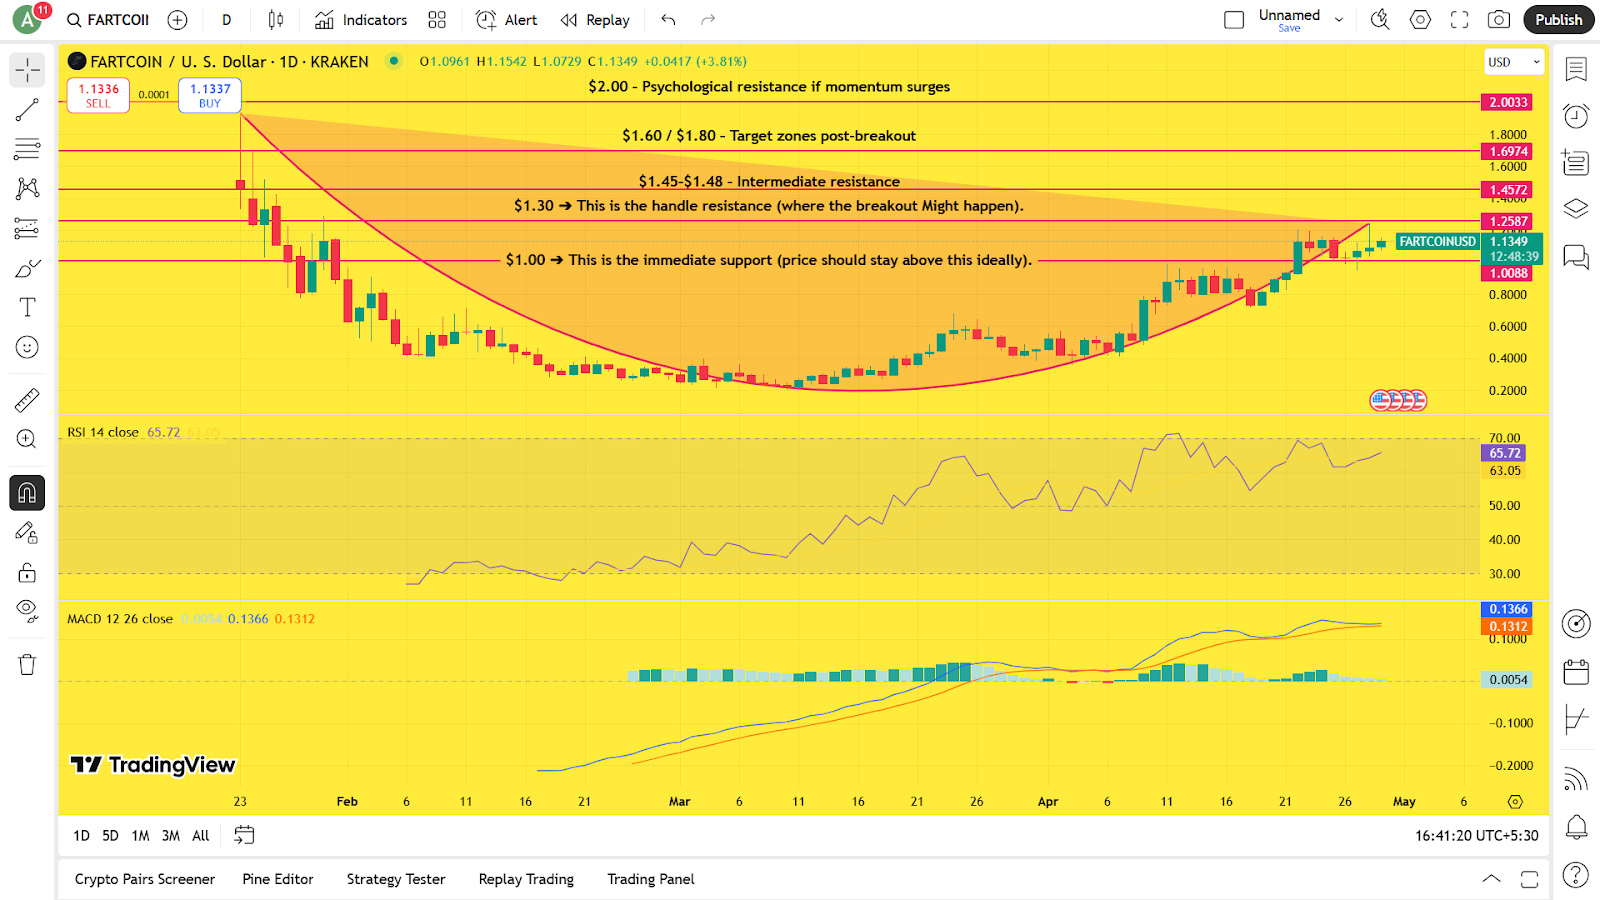
FART Coin continues to follow a classic bullish cup and handle pattern on the daily chart. After forming a rounded bottom between early February and mid-April, the price successfully completed the “cup” structure and has since carved out a shallow handle, marked by light consolidation just below the $1.30 resistance level.
Price Action & Structure:
FART is currently trading around $1.12–$1.13, maintaining its structure above the critical $1.00 support zone, which remains the ideal floor for the bullish scenario.
The immediate challenge lies at $1.30, acting as the “handle resistance.” A confirmed breakout above this level would validate the handle breakout and likely trigger a move toward the $1.60–$1.80 resistance targets.
The EMAs (20/50/100/200) continue to fan out in a bullish alignment, with the 20 EMA now well above the longer EMAs, indicating sustained upward momentum
Momentum Indicators:
RSI (14) is currently at ~65.20, slightly up from yesterday’s 66 but still comfortably below the overbought threshold (70). This cooling-off zone supports continued bullish momentum without exhaustion, giving bulls room to push higher.
MACD is showing positive momentum with the MACD line at 0.1355 and signal line at 0.1310, keeping the bullish crossover intact. The histogram, while modest, still reflects positive momentum.
Key Levels to Watch:
Immediate Support: $1.00 → Maintaining this level is crucial for the structure to stay valid.
Breakout Level: $1.30 → A daily candle close above this could confirm the handle breakout.
Upside Targets: $1.60 (Major Resistance) → Followed by $1.80 as the next potential Q2 target.
Downside Risk Zone: If $1.00 fails, watch for a pullback toward the $0.75–$0.73 zone where the 50 EMA also aligns as secondary support.
The post Solana Memecoins FART And PENGU Dominate Meme Coin Market: Can They Sustain the Momentum? appeared first on Coinpedia Fintech News
Key Takeaways: Fartcoin surged 173% in April, becoming the top-performing memecoin with a market cap of $1.14 billion and strong whale-driven activity. PENGU saw a +136.35% weekly gain, but monthly growth slowed to +102% from 153% on 28th April, with a potential pullback on the horizon. : Whale purchases of Fartcoin, including a $2.48 million …