The US Supreme Court has made a critical ruling, which could have a significant impact on the crypto industry. The Apex court ruled in favor of the IRS in a case involving the summons that the tax agency had issued to Coinbase to access user data. US Supreme Court Rules Against Coinbase In IRS Case
The XRP price slumped in the first quarter even after some notable Ripple news, including the end of the SEC case and its ecosystem growth. Ripple was trading at $2.2 on April 1, down by 35% from its highest level in 2025. There is a risk that the XRP coin will crash soon, even as the Ripple USD (RLUSD) volume to total value locked (TVL) jumped.
Ripple USD (RLUSD) Volume to TVL Has Jumped
One of Ripple’s strategies to grow its ecosystem has been the launch of RLUSD, a regulated stablecoin. Ripple hopes that its regulation and transparency will help to dethrone Tether and USD Coin.
Recent data shows that RLUSD stablecoin is still a small player in the stablecoin industry. It has a market cap of over $243 million, a tiny amount in an industry valued at over $237 billion.
However, a closely watched metric shows that RLUSD is in a good place. It has a volume-to-total value locked (TVL) of 37%. This figure is much higher than that of other stablecoins. For example, USDC has a ratio of 14.26%, while Tether is slightly behind at 34.5%.
RLUSD Stats
A higher ratio means that RLUSD holders use it to handle daily transactions. It also means that a higher liquidity is provided to facilitate trading. A stablecoin with a low ratio means that it is not being used.
RLUSD has become the biggest player in the XRP Ledger network, with the other notable players being Sologenic, Crypto Trading Fund, Coreum, and XRP Army.
XRP price has also lagged despite other bullish catalysts. The SEC has ended its Ripple case, while many companies have applied for a spot XRP ETF. Further, Ripple is working to become the best alternative to SWIFT, a network that handles billions of dollars each day.
XRP Technical Analysis Points to a Potential Crash
While Ripple has some solid fundamentals, there is a risk that it will have a strong downtrend in the coming weeks. There is a risk that the XRP price is about to form a death cross pattern as the spread between the 50-day and 200-day Weighted Moving Averages (WMA) narrows. A death cross is a highly risky pattern in technical analysis.
The other risk is that the Ripple price has formed a head and shoulders pattern, whose neckline is at around $2. This price coincides with the 50% Fibonacci Retracement, which is drawn by connecting the lowest point in 2024 and highest level this year.
XRP Price Chart
XRP Price Targets
Therefore, a drop below this neckline will be a victory for bears, who will trigger panic selling. More downside will push the token downwards, potentially to the $1.5, the 61.8% Fibonacci Retracement level.
The bearish Ripple price forecast will be canceled if the coin surges above right shoulder point at $3. Such a move will likely trigger a jump to the YTD high of $3.4, followed by the psychological point at $5.
Arbitrum (ARB) is up by nearly 40% in the last seven days as a bullish sentiment around it surges due to speculation around a partnership with Robinhood. Arbitrum price has gained by 18% today, June 30, to trade at $0.366 at press time. Meanwhile, the market interest was notably high, with trading volumes surging by
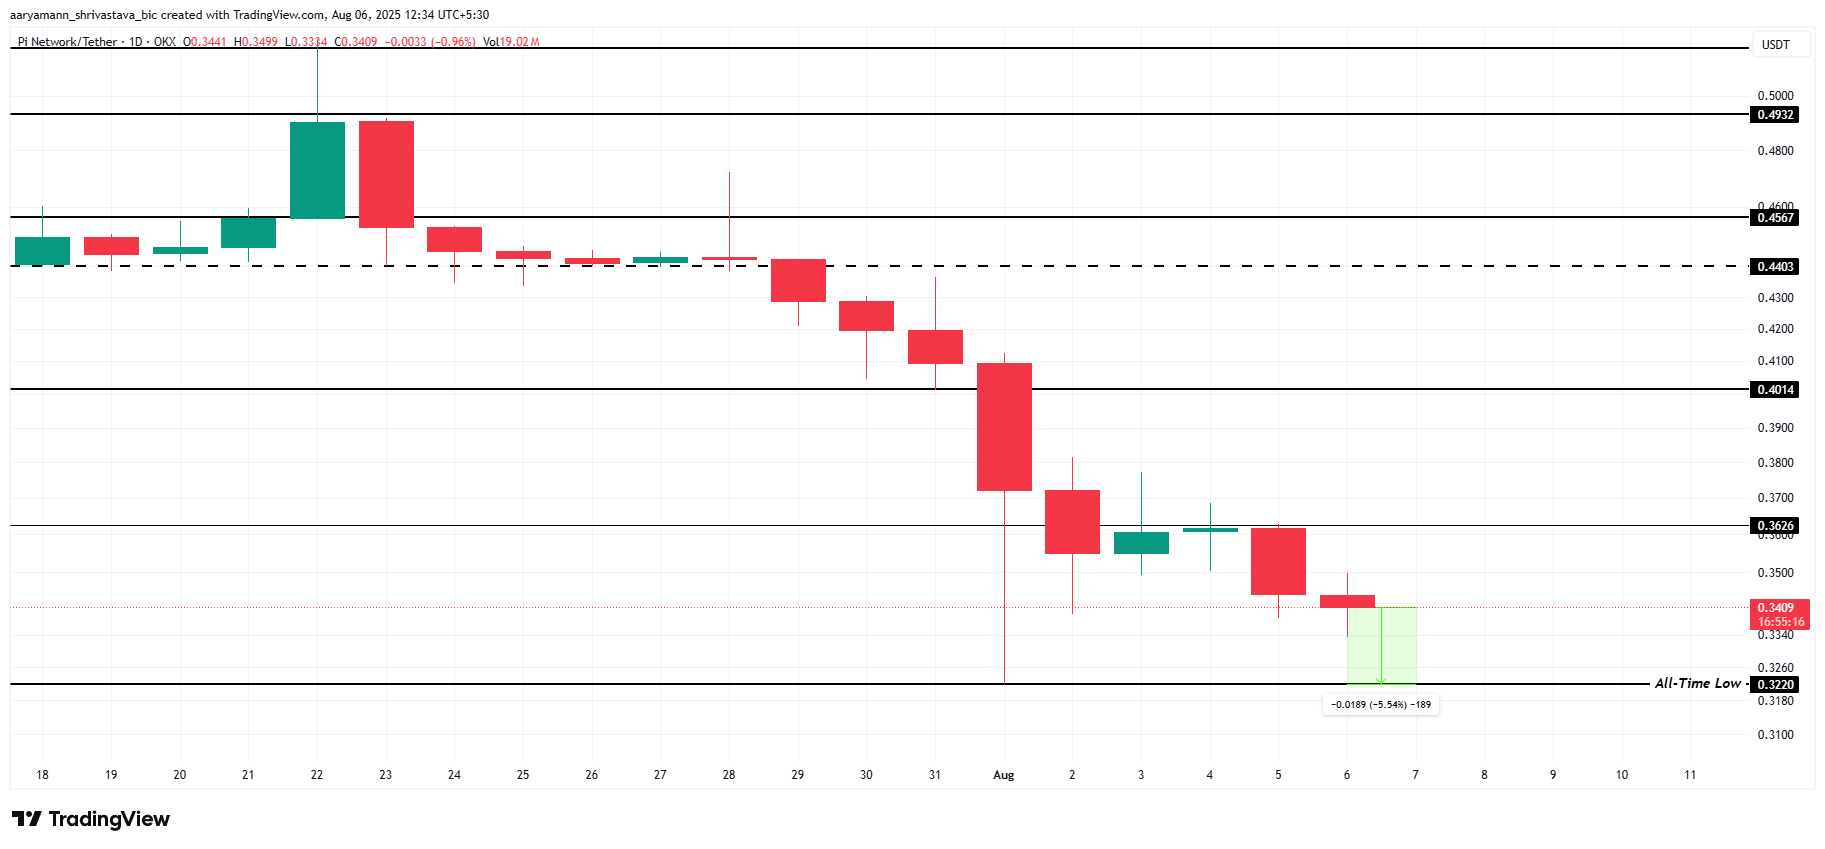
Pi Coin has recently faced a challenging price action, culminating in the formation of a new all-time low (ATL) earlier last week.
Despite the ongoing downtrend, Pi Coin remains close to hitting a new ATL, as investor sentiment continues to worsen, reflecting a lack of optimism in the market.
Pi Coin Holders Are Choosing Not To Hold
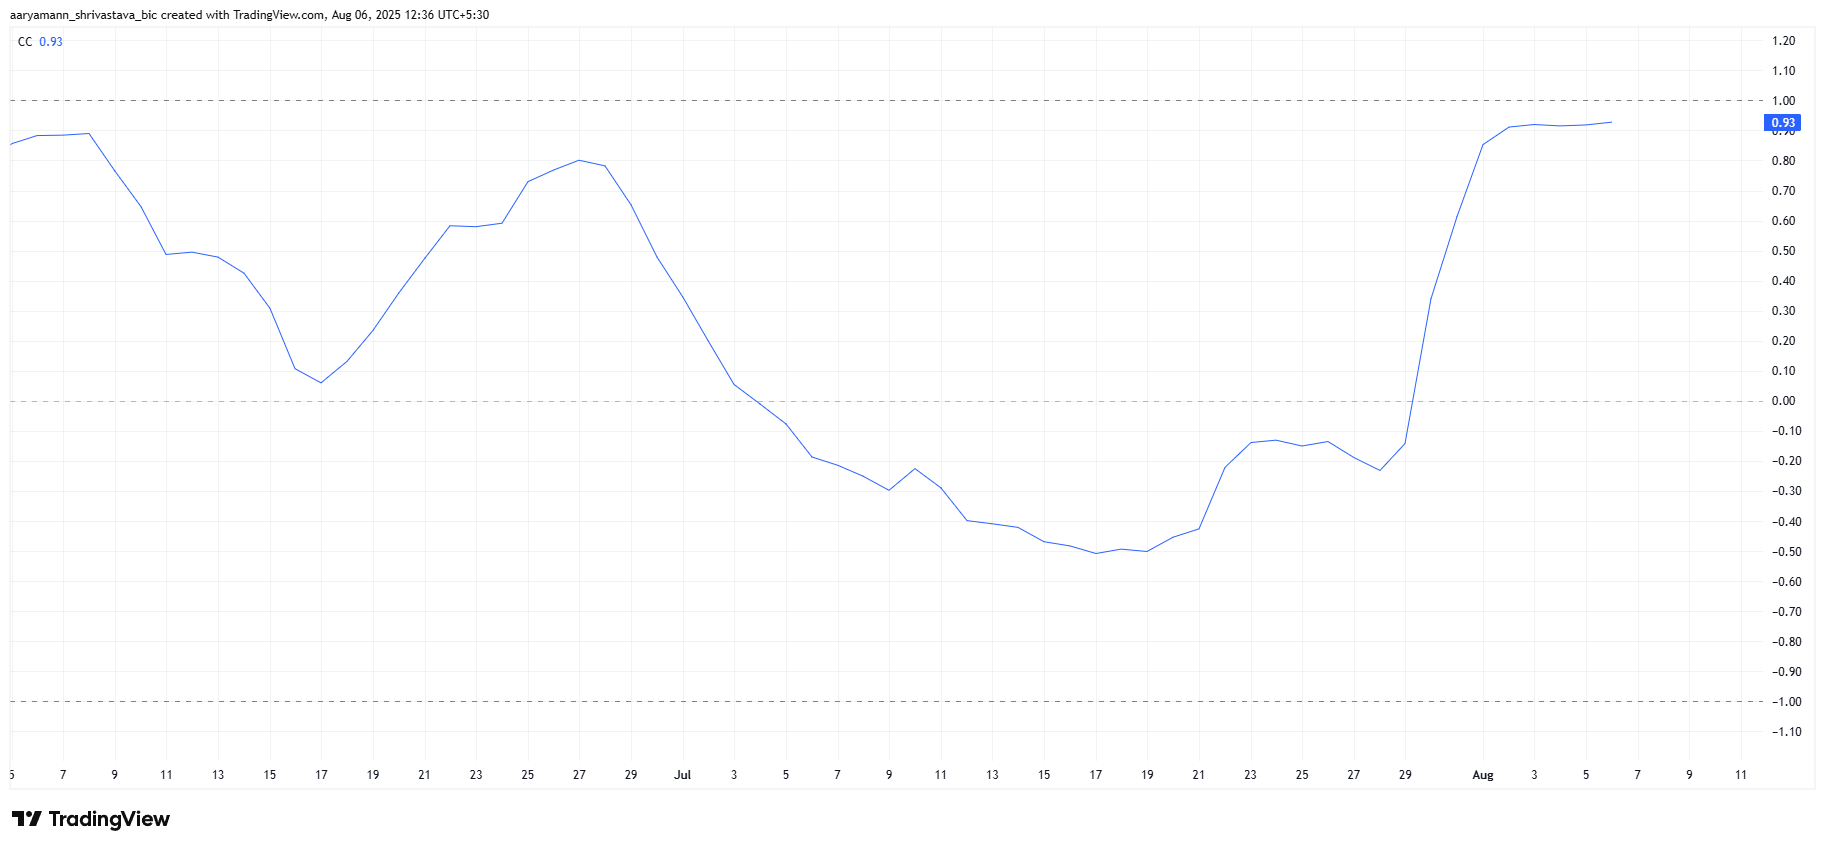
The correlation between Pi Coin and Bitcoin currently stands at 0.93, indicating a strong connection between the two assets. As Bitcoin experiences volatility and uncertainty, Pi Coin tends to follow its trajectory.
With Bitcoin’s price wobbling in recent days, Pi Coin’s price remains susceptible to the same market conditions. Bitcoin’s price uncertainty is a critical factor, as it often drives Pi Coin’s movements.
For token TA and market updates: Want more token insights like this? Sign up for Editor Harsh Notariya’s Daily Crypto Newsletter here.
Pi Coin Correlation With Bitcoin. Source: TradingView
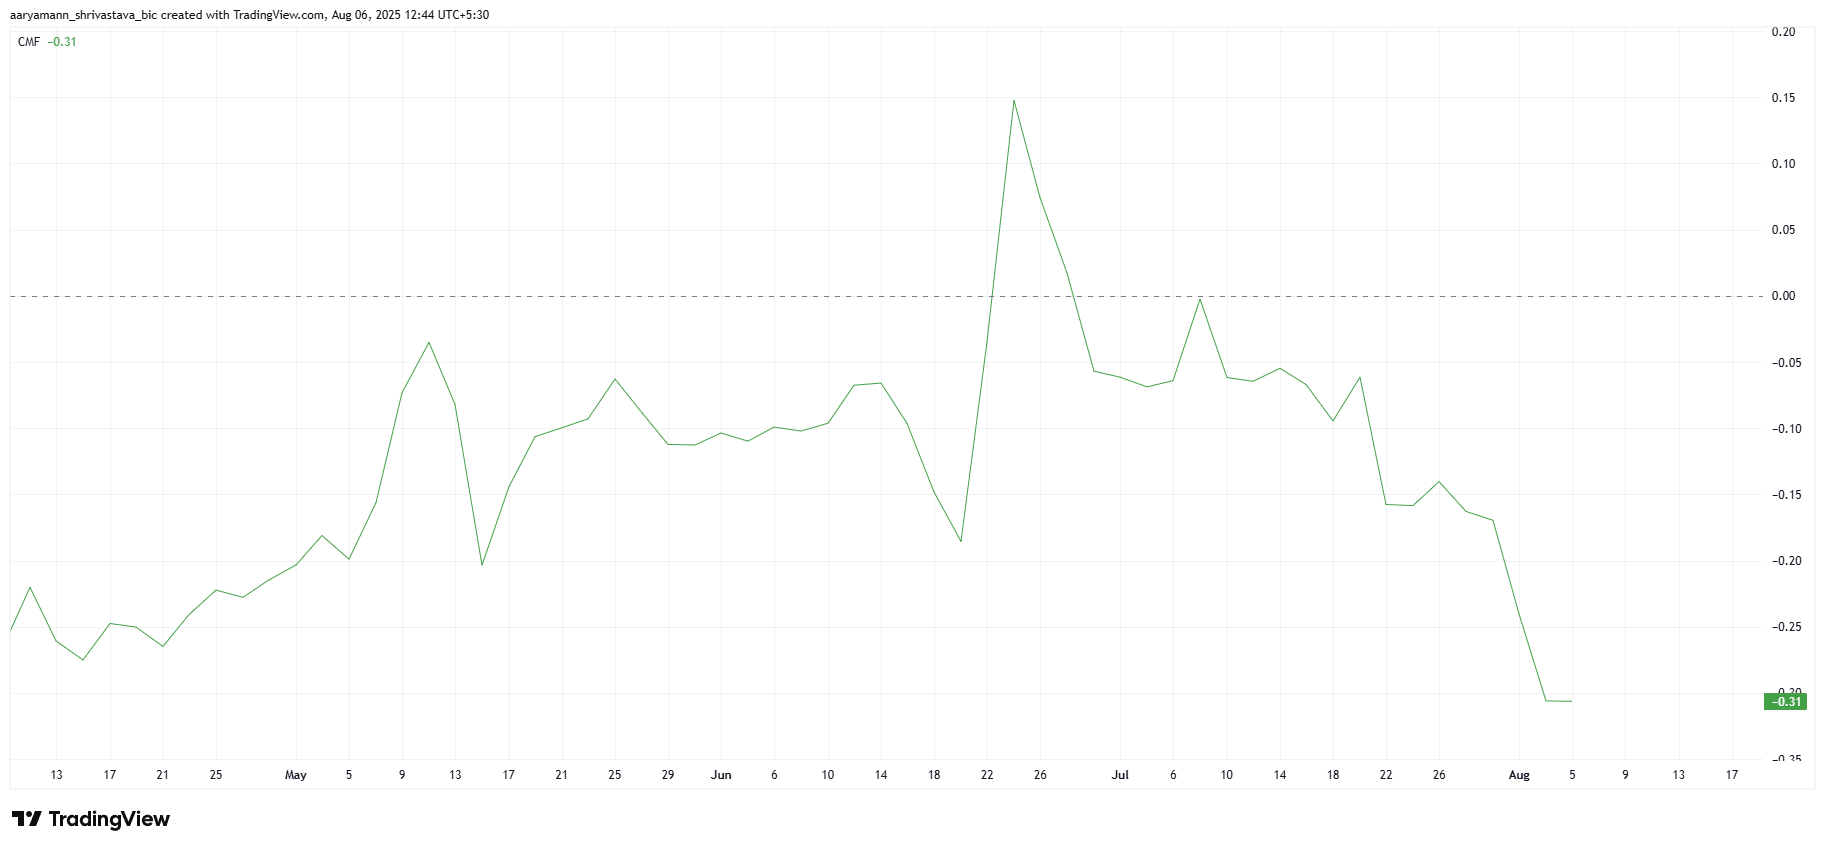
Pi Coin’s macro momentum is dominated by negative investor sentiment, as evidenced by the Chaikin Money Flow (CMF) indicator. The CMF has been steadily declining, showing that outflows are overwhelming inflows.
The continued decline in investor confidence is contributing to the overall negative momentum. This suggests that investors are bearish toward Pi Coin, with a significant portion of the market opting to sell their holdings.
Pi Coin’s price is currently at $0.340, just 5.54% away from revisiting its recent ATL of $0.322. Given the current market conditions, Pi Coin remains under significant pressure, making it likely that the price will continue to decline. A new ATL below the current $0.310 could be in the near future.
Given the ongoing outflows and the correlation with Bitcoin’s price movements, Pi Coin’s price trajectory appears bleak. It’s expected that the price will maintain its downtrend unless a shift in investor sentiment occurs. A decline through the support levels is highly probable, pushing the price toward further losses.
However, in the unlikely scenario that Pi Coin experiences a reversal, it would need to secure $0.362 as a support floor to initiate a rally. If the price manages to break this barrier, it could rise to $0.401, invalidating the current bearish outlook and offering hope for a price recovery.