The U.S. Securities and Exchange Commission (SEC) clarified on May 29, that certain protocol staking activities on proof-of-stake (PoS) blockchain networks do not qualify as securities offerings. The Division of Corporation Finance stated that staking on PoS networks, including related services, is not subject to federal securities laws registration or exemptions. US SEC Clarifies Staking Activities Are Not Securities According to the US SEC’s Division of Corporation Finance, participants in specific protocol staking activities do not need to register transactions with the Commission under the Securities Act. The guidance applies to self-staking by node operators, self-custodial staking with third parties, and custodial staking arrangements where a custodian stakes on behalf of asset owners. Per the Division, staking rewards are compensation for the services node operators provide the network. These payments do not represent profits that others earn through being an entrepreneur or manager. As a result, staking is not covered… Read More at Coingape.com
Ripple (XRP) price is under bearish pressure after shedding more than 8% of its value in the past week and recording the biggest seven-day loss among the top-ten largest cryptos by market cap. As the downward pressure intensifies, Ripple will likely lose its competitive edge over the largest altcoin, Ethereum, after the XRP/ETH ratio plunged to its lowest level in a month.
XRP Sheds $520M in Open Interest as Long Liquidations Surge
Data from Coinglass shows that Ripple’s open interest has declined from $4.15 billion to $3.63 billion in just one week, shedding more than $520 million. This drastic decline follows a surge in long liquidations with more than $8M positions by long buyers being forcefully closed in the last 24 hours as the XRP price declined.
Ethereum Open Interest
The declining OI may prevent an explosive Ripple rally as it indicates that futures traders are no longer willing to open new positions, amid the closure of existing ones due to price volatility. Nevertheless, the level of leverage remains notably high, with more than 75% of Binance traders opening long positions, causing the long/short ratio to reach its highest level in a month.
XRP Long/Short Ratio
While the opening of new long positions shows that many traders anticipate the XRP price to recover, an unprecedented downtrend will trigger liquidations that will push the Ripple price lower as those with open positions sell.
XRP/ETH Falls to Monthly Low
XRP price has been underperforming against other top altcoins, especially Ethereum. The XRP/ETH ratio has plunged to its lowest level in one month, and this suggests that while Ripple is shedding gains, Ethereum has successfully defended its support level and will likely continue dominating the altcoin market.
XRP/ETH: 1-day Chart
This ratio now stands at 0.00118, and if the price of XRP continues with the downward trend, and loses the next support at 0.00111, it will trigger the next bearish leg to 0.00102. Meanwhile, the RSI is showing that the bearish momentum is intensifying, indicating that Ripple is facing further correction against ETH.
XRP Price Eyes Drop Below $2 Before Recovery
XRP price will likely drop below $2 first before it can make an upward recovery, according to the analysis shared by trader CrediBULL Crypto. $2 has often been seen as a crucial psychological support for the altcoin, but a drop below it might spark a surge in buying activity by traders accumulating the dip, and this will likely support an upswing.
If Ripple drops to test the support level at $1.79, it may drive the next upward momentum that will aid a break of the critical $2.10 resistance level. Fliupping this level will then pave the way for an XRP breakout to $4.
Ripple Price Chart
To sum up, the price of XRP has been under intense selling pressure due to a surge in long liquidations that have also caused the open interest to drop by over $500 billion in a week. As these bearish headwinds continue, Ripple is losing its edge against Ethereum, with a breakout only possible if it drops to test support below $2 before resuming an upward trend.
Ethereum has seen an uptick in institutional interest in recent weeks; however, the price is consolidating in a tight range.
On-chain data has revealed that selling pressure from US-based whales and institutions has steadily declined over the past month despite the altcoin’s lackluster price performance.
Ethereum Demand Holds Strong Among US Investors
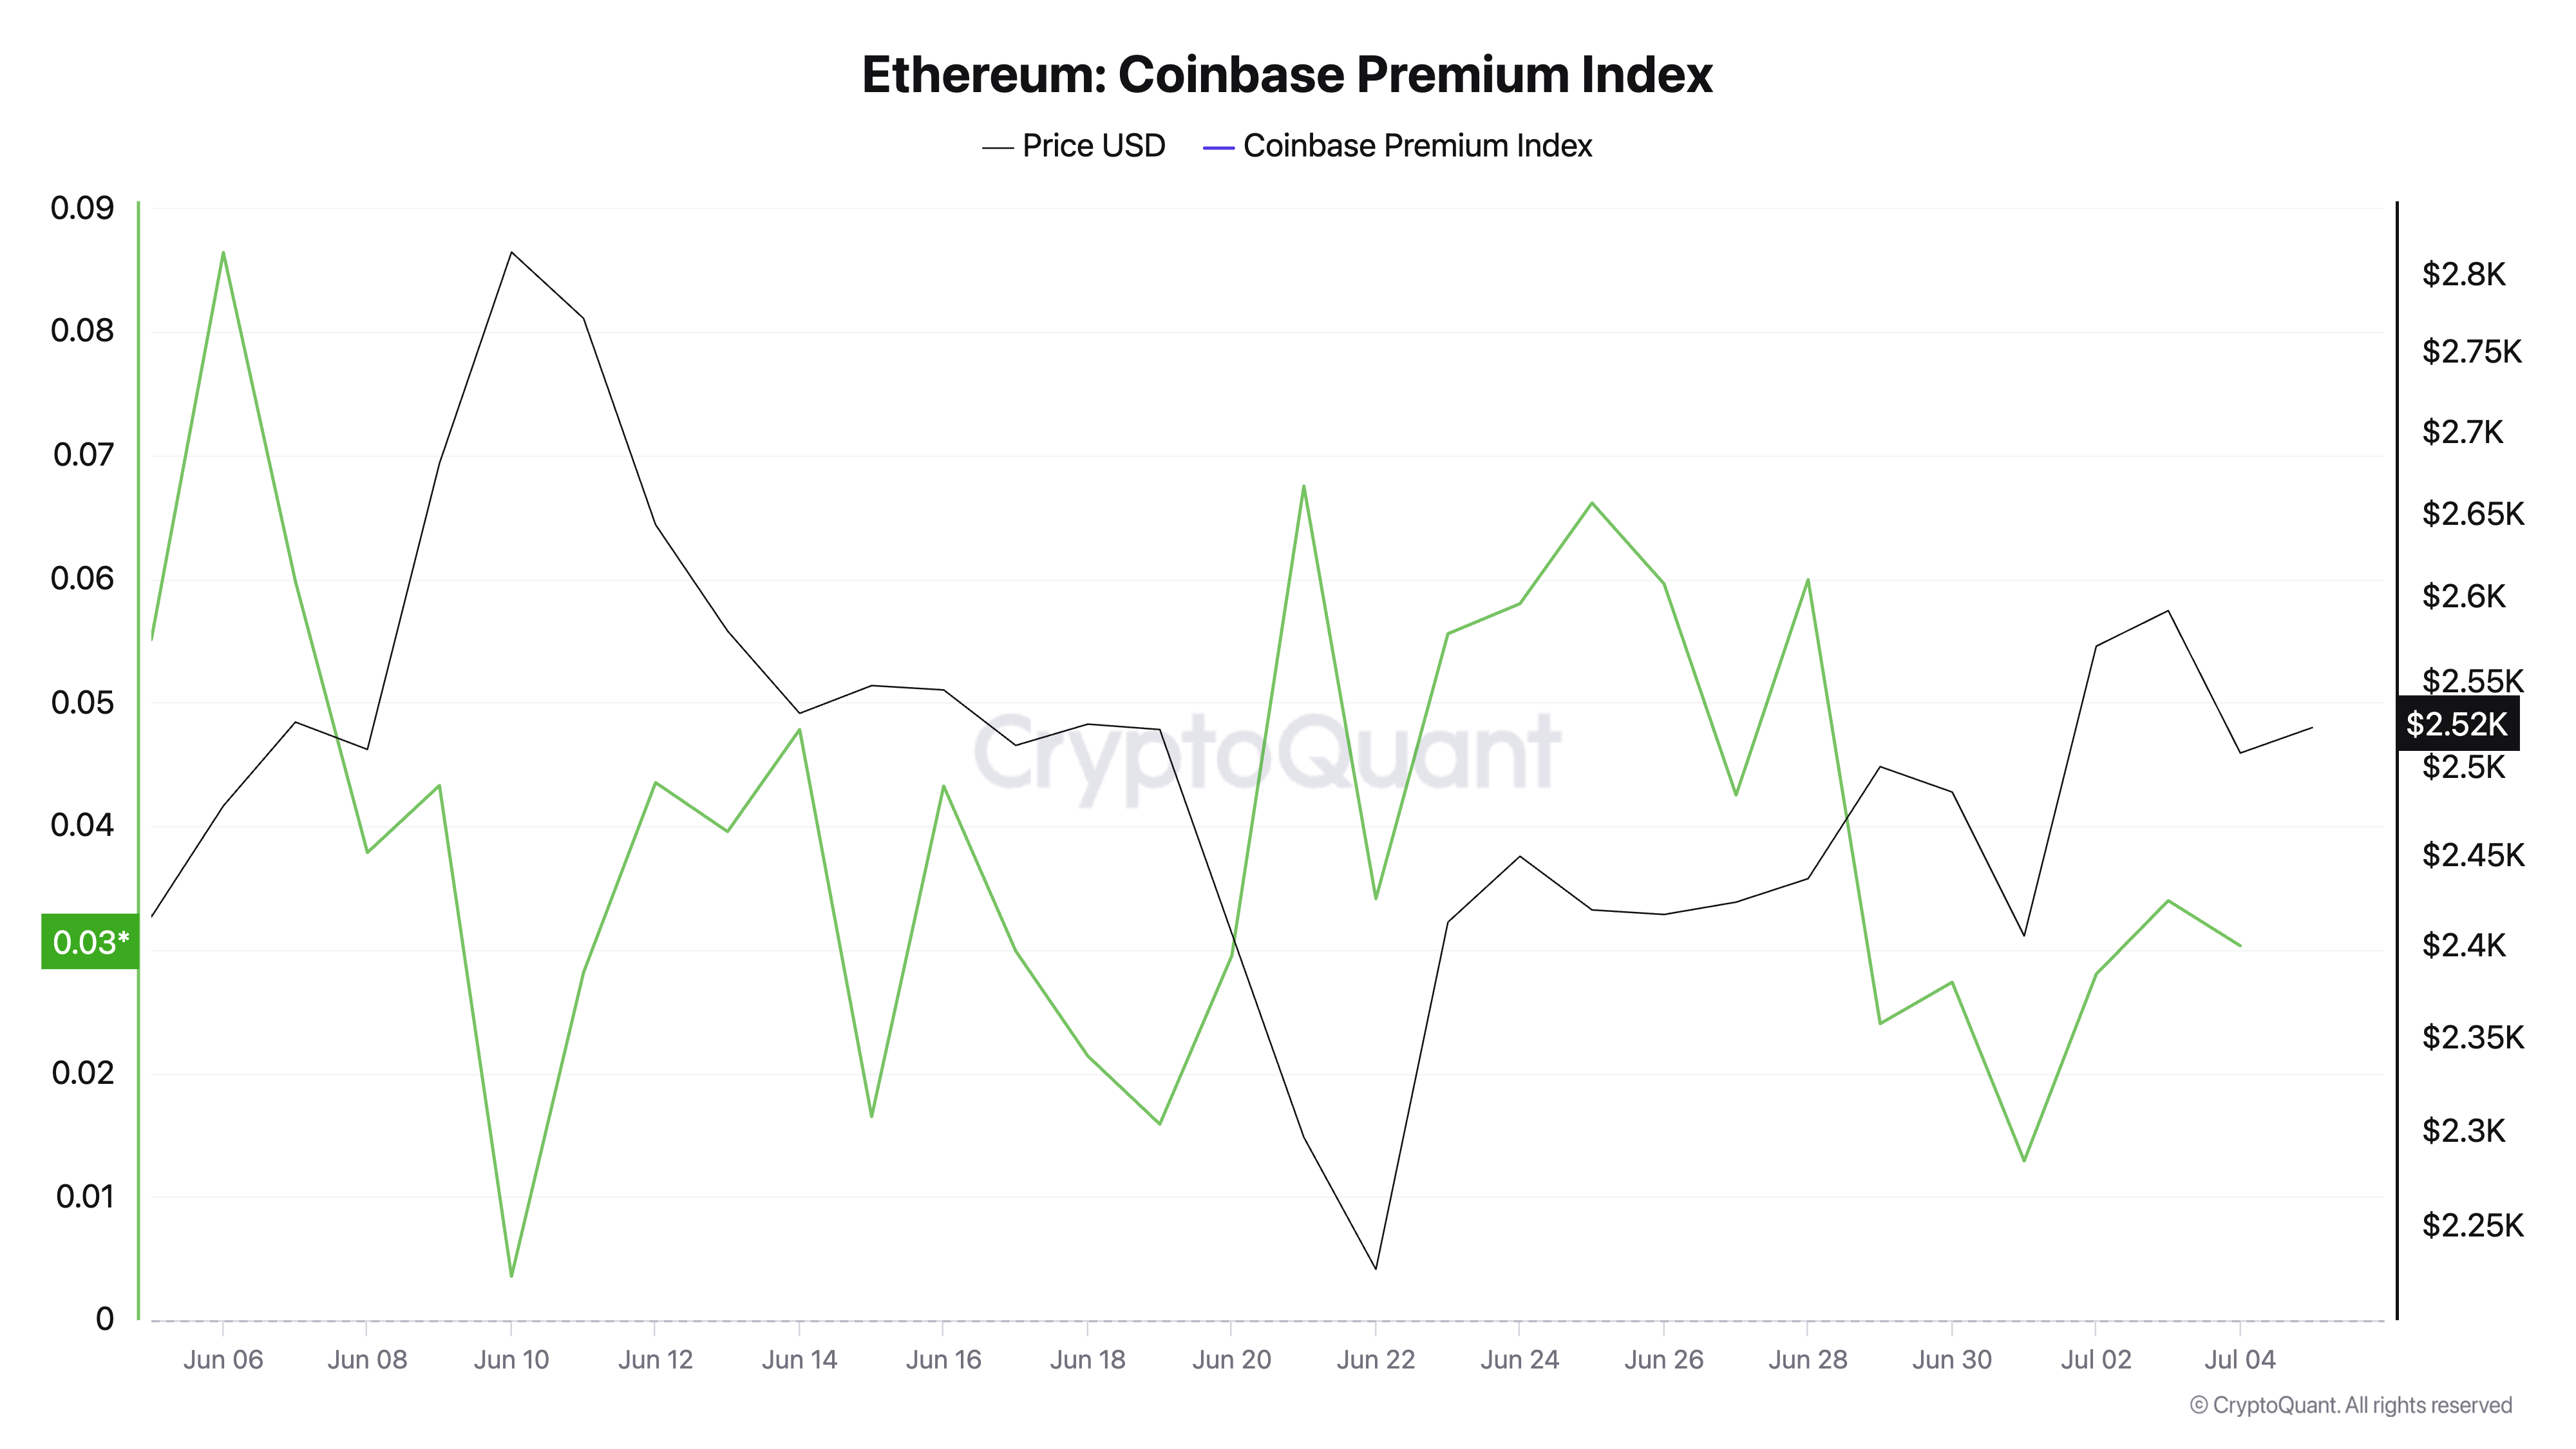
According to data from CryptoQuant, Ethereum’s Coinbase Premium Index (CPI) has remained consistently above the zero mark over the past month. This is a signal of sustained buying interest from U.S.-based investors.
This metric measures the difference between the ETH’s prices on Coinbase and Binance, and it is a good indicator for tracking US investor sentiment.
When the CPI rises, ETH trades at a premium on Coinbase compared to international exchanges. This reflects stronger buying pressure from US-based investors.
Conversely, when the CPI falls—or worse, turns negative—it signals that demand on Coinbase is lagging behind global markets due to profit-taking or waning interest among US buyers.
Therefore, despite its lackluster price performance in recent weeks, ETH’s steady CPI above the zero line suggests that US investors are continuing to buy rather than exit the market. This points to a measured accumulation trend rather than a sell-off.
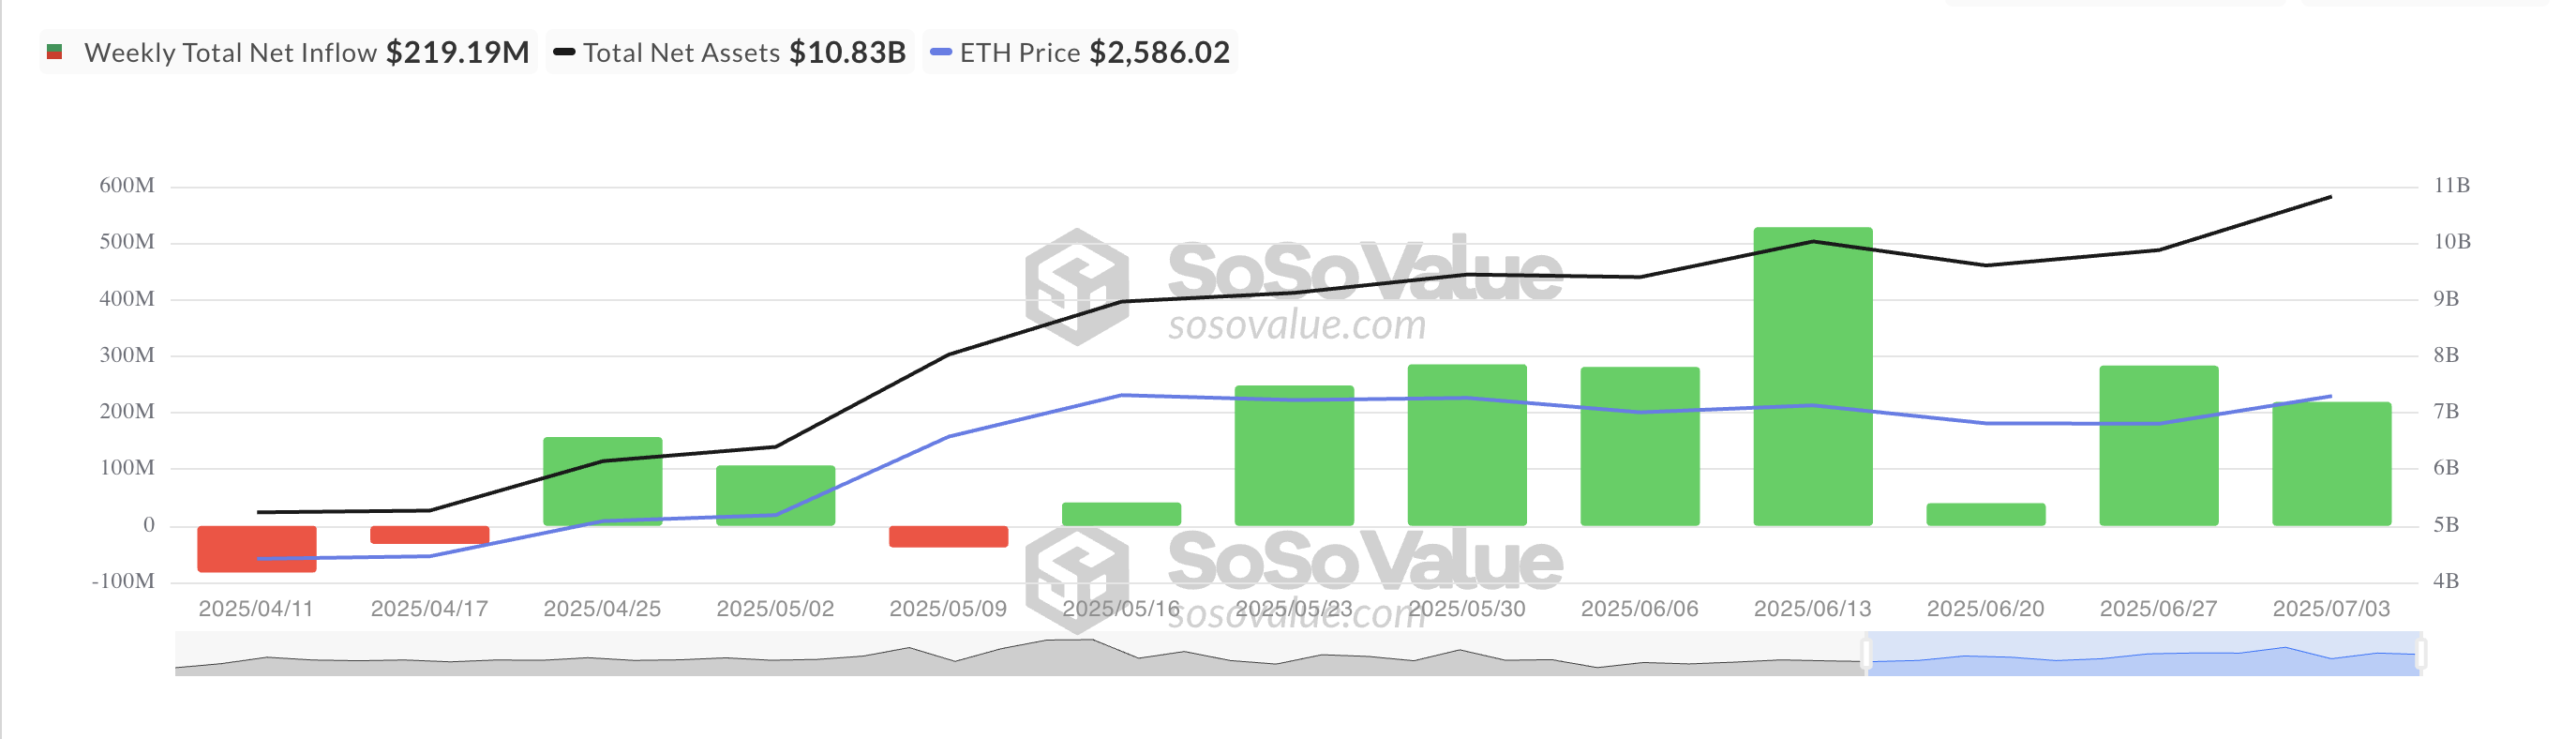
Moreover, the consistent weekly inflows into ETH-backed exchange-traded funds (ETFs) confirm the sustained interest from key investors. Per SosoValue, these funds have recorded consistent weekly net inflows since May 9.
Total Ethereum Spot ETF Net Inflow. Source: SosoValue
This reflects a sustained appetite among institutional investors for exposure to ETH, even as its price action remains relatively muted.
ETH Trapped in Tight Range
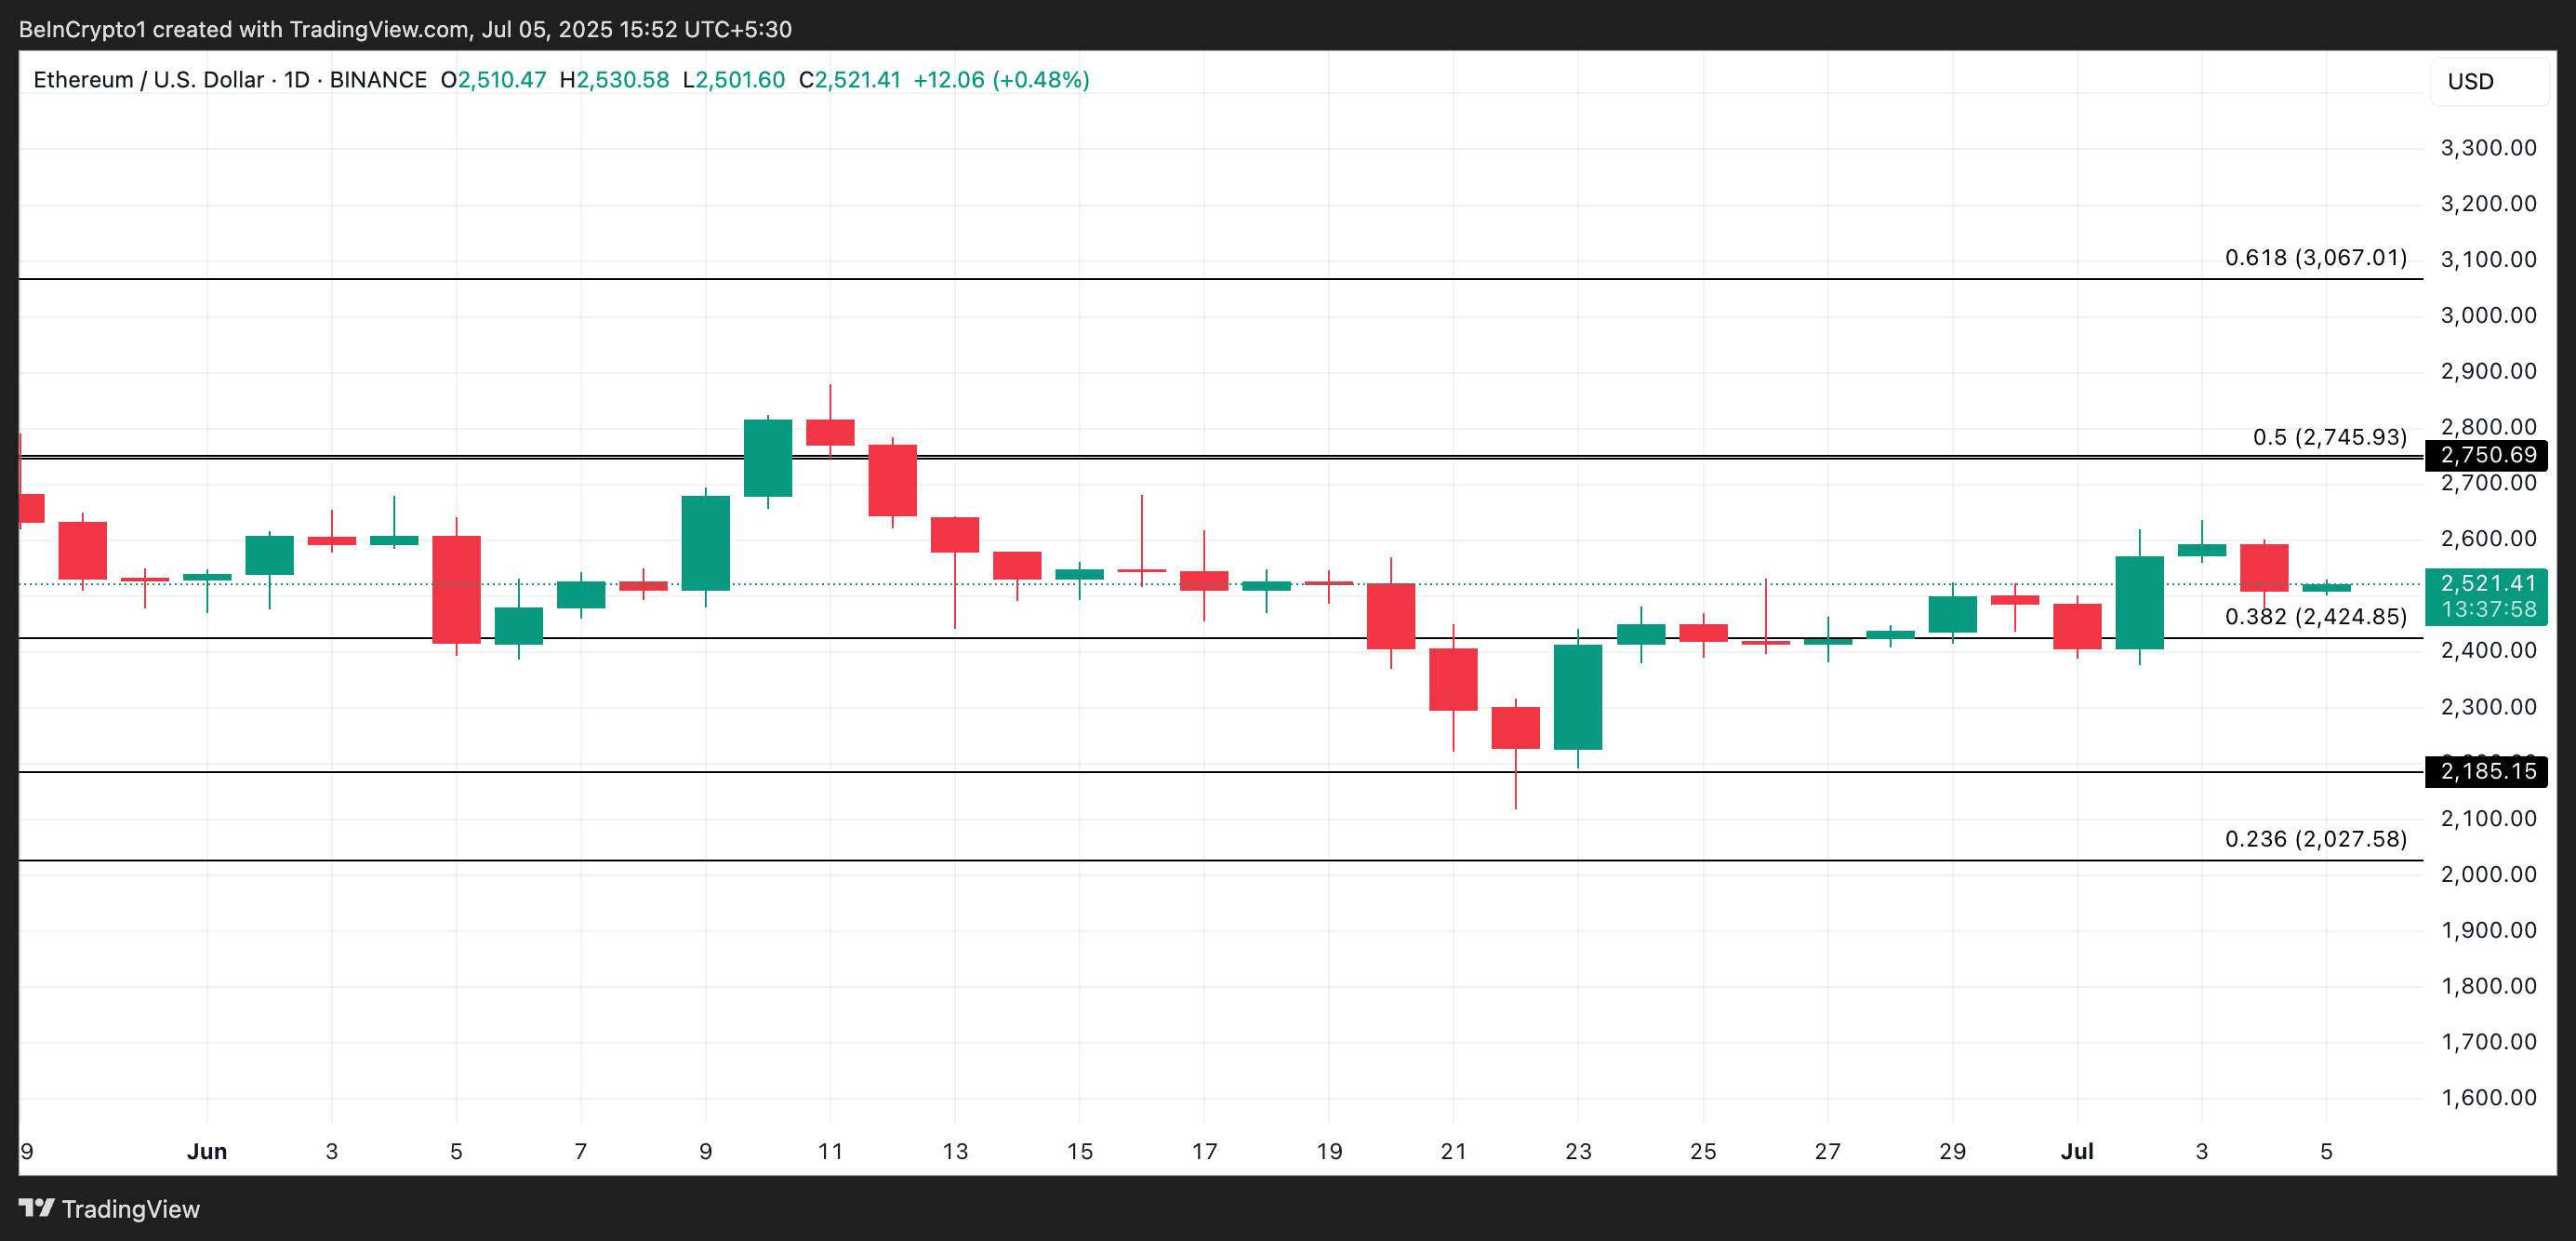
Readings from the ETH/USD one-day chart confirm that ETH has been consolidating within the $2,750 to $2,424 price range since early May. If institutional investors increase their buying pressure and broader market sentiment improves, the coin could rally toward the $2,750 resistance level and potentially attempt a breakout above it.
If successful, ETH’s price could climb further to around $3,067.
However, if investors’ participation weakens and bearish pressure builds, ETH may fall back toward $2,424. It could decline toward $2,185 if that support fails to hold.
PEPE has continued its downward trajectory, hitting a six-month low of $0.00000670. The meme coin’s sustained losses have significantly eroded investor confidence, leading even uncertain holders to pull back.
The extended drawdown has created a challenging environment, with sentiment remaining overwhelmingly bearish.
PEPE Investors Are Losing Hopes
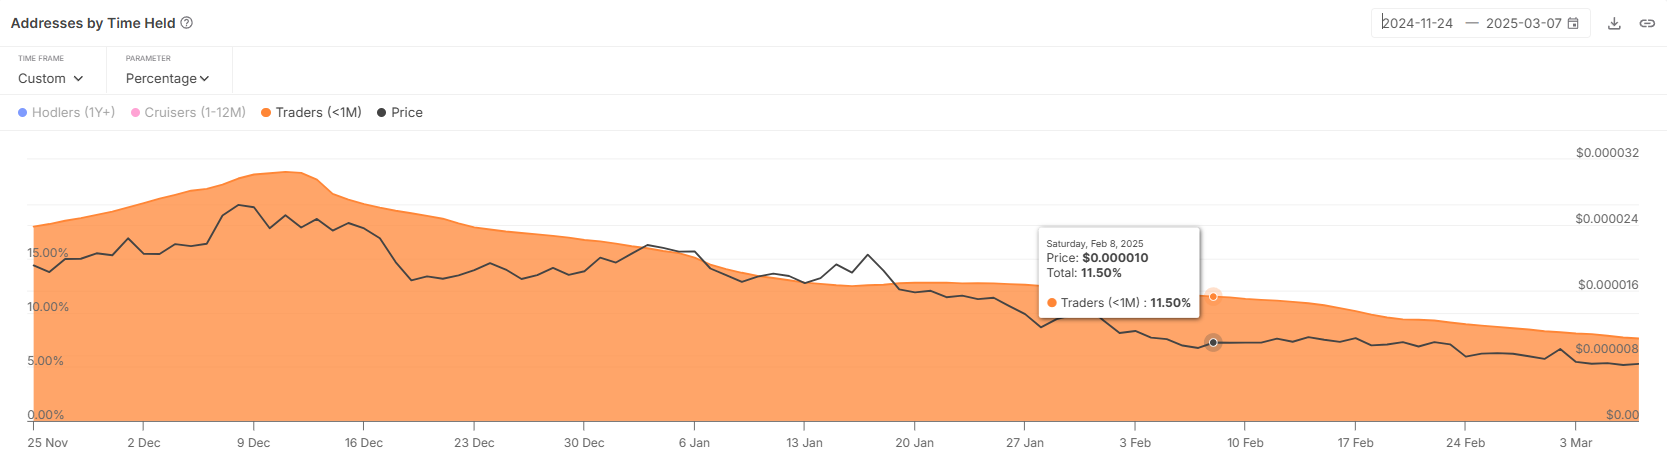
Short-term holders (STHs) have exited the market over the past month. Their participation has dropped from 11.5% to 7%, a 4.5% decline that reflects the growing reluctance to engage with PEPE at current price levels.
The prolonged downtrend has discouraged traders, as any recent investments have resulted in losses.
Typically, a low STH presence can be seen as a stabilizing factor, reducing volatility. However, this case highlights rising pessimism among PEPE investors.
The absence of new inflows and the reluctance of holders to re-enter suggest that sentiment remains fragile, further delaying any potential recovery.
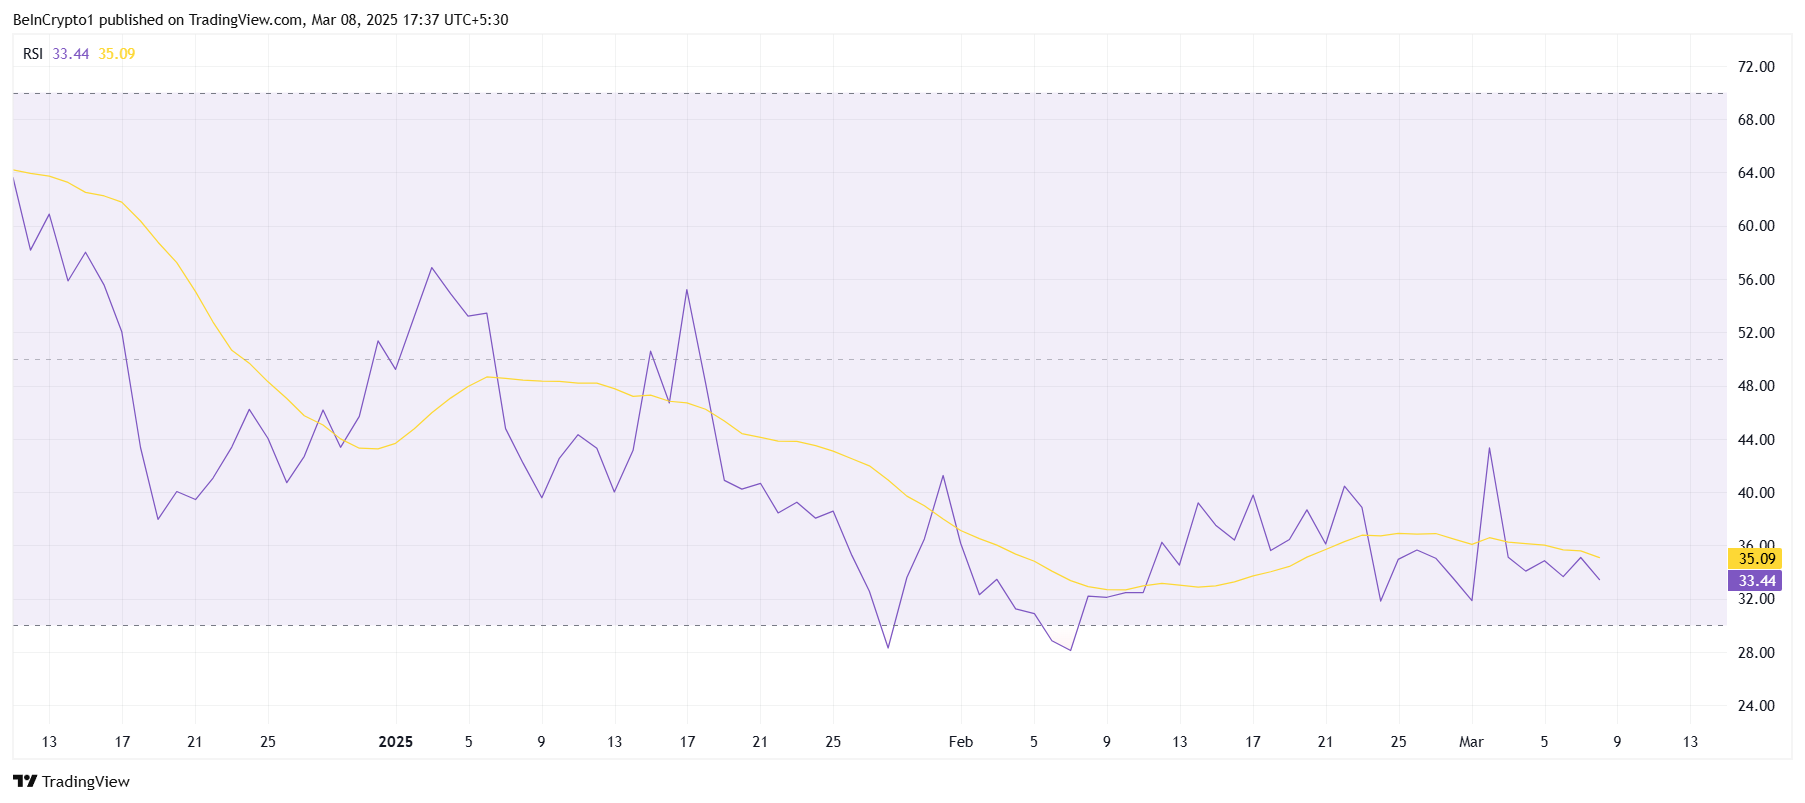
PEPE’s macro momentum remains weak, with technical indicators signaling persistent bearish conditions. The Relative Strength Index (RSI) has remained stuck in the bearish zone for over a month, indicating continued selling pressure.
The lack of upward momentum suggests that recovery remains unlikely in the near term.
Additionally, worsening broader market conditions have exacerbated PEPE’s decline. Without a shift in macroeconomic or crypto market trends, the meme coin could remain under pressure. Until key resistance levels are breached, bearish dominance is expected to persist.
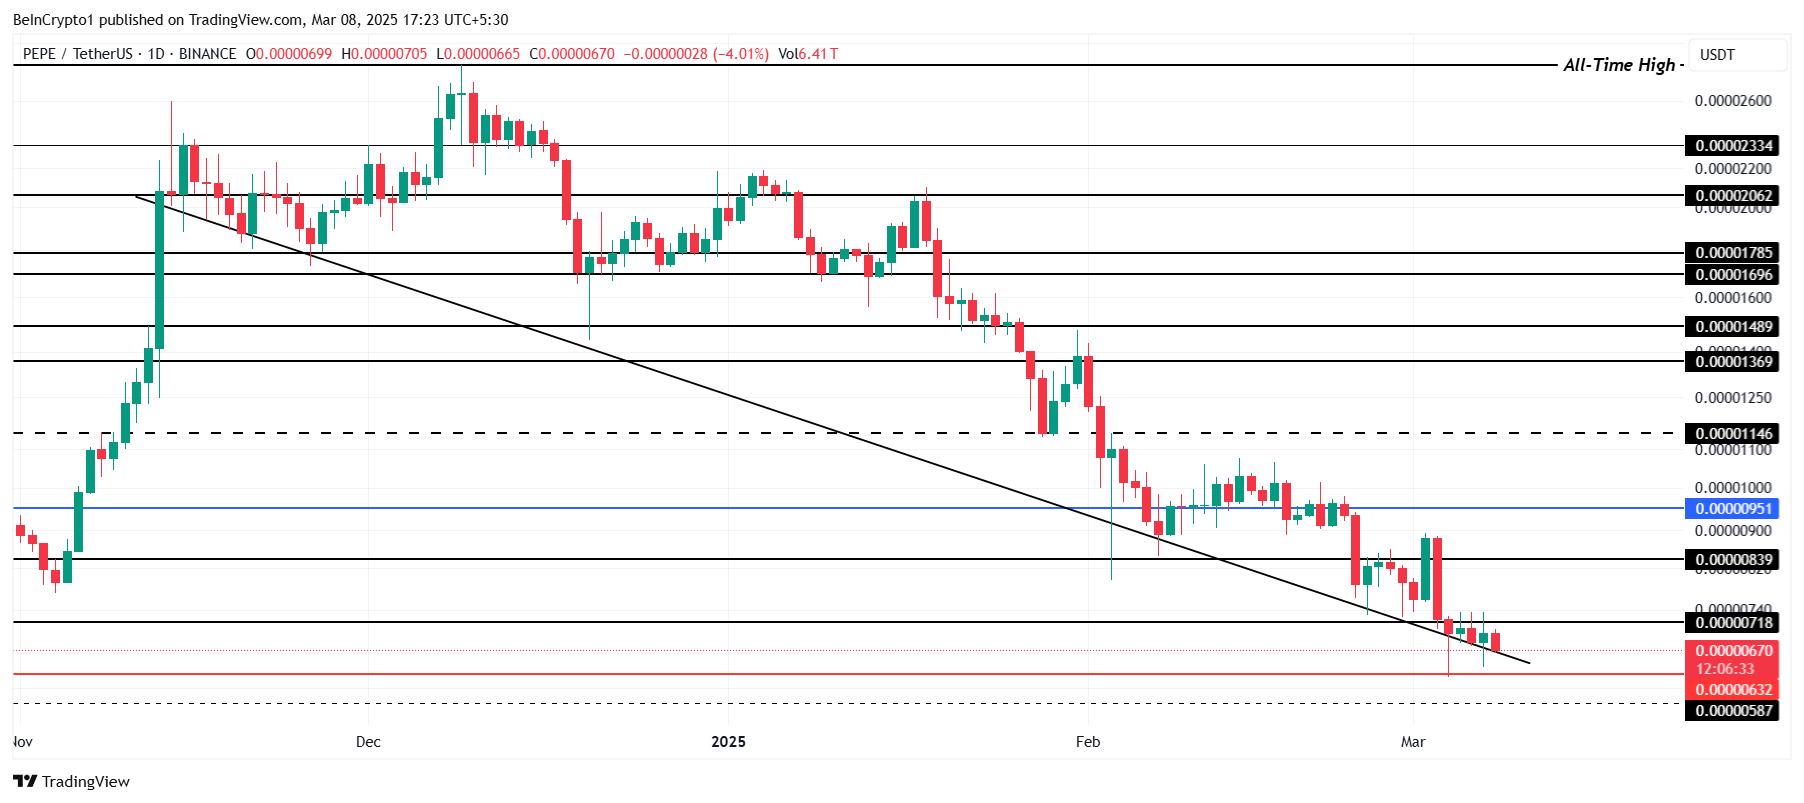
PEPE’s price has fallen to $0.00000670, holding above the critical support of $0.00000632. Sitting at a six-month low, the meme coin’s four-month-long downtrend shows no signs of reversal. If bearish pressure continues, PEPE could lose its support and sink further.
A breach of $0.00000632 would likely result in PEPE falling below $0.00000600. This could extend losses further, pushing the price toward the next support at $0.00000587. Without a strong reversal, PEPE may continue its downward trajectory, deepening investor losses.
The only way to invalidate this bearish outlook is if PEPE reclaims the crucial resistance of $0.00000951 as support. A successful breakout above this level would increase the chances of the meme coin returning to $0.00001000.
However, before this can happen, PEPE must first breach $0.00000718 and $0.00000839, both acting as key resistance levels on the way to recovery.