The much-anticipated March PCE inflation data has come out in line with expectations, leaving market participants wondering about the Federal Reserve’s next move. This inflation metric is the Fed’s most preferred inflation gauge and suggests that Chair Jerome Powell and the FOMC will likely keep rates unchanged at the May meeting.
US PCE Inflation Data Comes In At 2.3%
U.S. Bureau of Economic Analysis data show that the March U.S. inflation data came in at 2.3% year-over-year (YoY), in line with expectations, and 0% month-over-month.
Meanwhile, the core PCE data came in at 2.6% YoY, the lowest since June 2024. This development is significant as this data is what the Fed uses as its primary inflation gauge and could determine its decision at the May FOMC meeting.
With the PCE inflation data stalling, Powell and the FOMC look unlikely to cut interest rates at the May meeting holding between the 6th and 7th.
Ethereum price surged by 5% on Wednesday, reaching $2,050 for the first time in ten days. With mutiple news catalysts alligning with massive short liquidations, how high can ETH prices go?
Ethereum (ETH) retakes $2,000 after 10-days amid Fed rate pause and SEC news on Ripple
Ethereum’s price surged by 5% on Wednesday, reaching $2,050 for the first time in ten days. This uptick coincided with the U.S. Federal Reserve’s recent policy decision and the conclusion of Ripple’s legal battle with the Securities and Exchange Commission (SEC), events that have significantly impacted the cryptocurrency market.
The Federal Reserve announced a pause in interest rate hikes, maintaining the current rates amid stable economic indicators. This decision has been perceived positively by investors, leading to increased confidence in riskier assets, including cryptocurrencies like Ethereum.
Ethereum Price Action | CoinMarketCap
In a parallel development, Ripple’s CEO, Brad Garlinghouse, confirmed that the SEC has dropped its case against the company. The lawsuit, initiated in December 2020, alleged that Ripple’s XRP token was an unregistered security. The dismissal of this case has been viewed as a significant win for the broader cryptocurrency industry, alleviating regulatory uncertainties that have previously hindered market growth.
More Bullish Signals Appear as ETH Short Traders Emerge Biggest Losers
Aside from the latest Federal Reserve decision and Ripple’s SEC victory boosting altcoin market demand, Ethereum has formed internal bullish catalysts. Over the past week, the Ethereum network successfully implemented two key upgrades: the Pectra Upgrade and the Hoodi Update.
These technical improvements have strengthened investor confidence, helping ETH surpass the $2,000 resistance level on Wednesday.
Crypto market liquidation heatmap, March 19, 2025 | Source: Coinglass
According Coinglass’ latest derivatives crytpocurrency market data suggest further upside potential.
According to the liquidation heatmap, Ethereum saw $86.58 million in total liquidations over the past 24 hours, with short traders suffering the most at $72.62 million. This accounted for a significant 25% of total market-wide liquidations, indicating a short squeeze that fueled ETH’s breakout.
With ETH short traders emerging as the biggest losers, it signals that short sellers are closing their positions at a rapid pace. This has two key implications. First, it suggests that bears are conceding the $2,000 resistance level, reducing downward pressure on ETH.
Second, as ETH advances above $2,050 and stabilizes at $2,067 at press time, many traders who previously placed short positions around key resistance levels have exited. With weaker resistance ahead, ETH could rise rapidly if positive macro sentiment surrounding the Fed’s rate pause persists.
Ethereum Price Forecast: Bulls Need $2,100 Breakout to Confirm Next Move
ETH price surged past $2,036, gaining 5.43% as bullish momentum accelerated following positive macroeconomic swings and successful network updates. Ethereum price forecast indicators on the daily chart reveals that ETH is trading above the 20-day moving average, signaling a potential short-term bullish reversal. The recent price action also aligns with the VWAP level of $2,009, further validating the strength of this rebound. A decisive close above $2,100 could open the door for a continuation toward the next resistance level at $2,373, as indicated by the upper Keltner Channel boundary.
Ethereum Price Forecast
However, despite the bullish momentum, Ethereum remains under a looming “death cross” overhang, where the 50-day moving average trends below the 200-day moving average, signaling a long-term bearish risk. Additionally, while short-term resistance may have weakened due to the massive $72 million in ETH short liquidations recorded Wednesday, the broader trend remains uncertain. If ETH fails to break and hold above $2,100, a rejection could trigger a retest of lower support around $1,927, potentially extending losses toward $1,801.
For now, bulls need to establish control above $2,100 to confirm sustained upside potential. A breakout beyond this level could drive ETH into a new uptrend, while failure may see renewed selling pressure in the coming days.
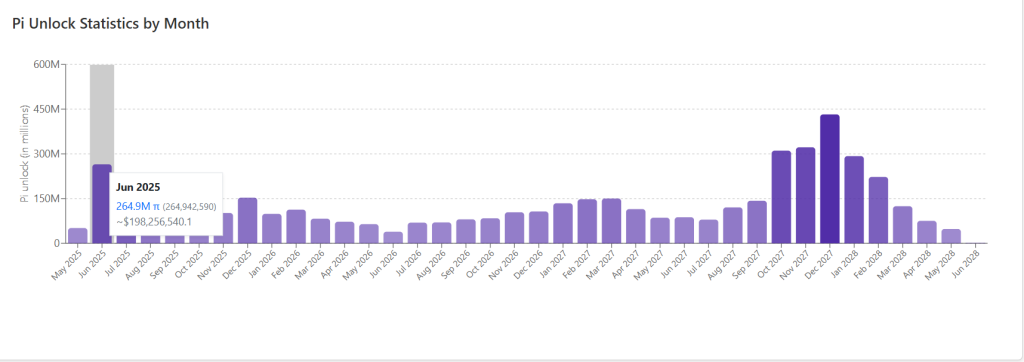
The Pi Network has been no stranger to controversy since its launch — and once again, it finds itself in the spotlight. With June approaching, the project is gearing up for one of its biggest challenges yet: a massive token unlock that could heavily impact the Pi Coin price.
As of now, Pi Coin is trading around $0.75, a drop from its recent high of over $1.50. Adding to concerns is the daily trading volume, which has shrunk to about $135 million — far lower than the impressive $1.7 billion volume it saw when Pi crossed the $1 mark.
Why Is Pi Coin’s Price Falling?
According to market experts, Pi’s price slide is driven by a simple market dynamic — there’s more selling than buying. As demand weakens and supply increases, prices naturally decline. And with a major unlock event on the horizon, investors are becoming even more skeptical.
What’s Happening in June?
In June 2025, 264 million Pi tokens are scheduled to be unlocked — the largest unlock event for the remainder of the year. This influx of tokens could flood the market, adding selling pressure and driving the price down further.
Interestingly, the official “.pi” domain is also set to expire on June 28, and some traders believe this could open doors for a short-term price rally, though opinions are divided.
Kraken Pro Adds Pi Futures Trading
In a positive development, Pi Network has made a strategic move by officially entering the U.S. market through Kraken Pro, one of the world’s top cryptocurrency exchanges. The platform recently launched perpetual futures contracts for Pi Coin, allowing traders to leverage positions up to 20x — a sign that institutional interest could be growing.
Despite the recent price slump, many still consider Pi Coin a project with long-term growth. The Pi Network team continues to work on expanding its ecosystem, developing new applications, investing millions into platform growth, easing user restrictions, and exploring more real-world utilities for its token. However, analysts believe that for Pi Coin to truly establish itself, it must secure listings on bigger exchanges like Binance and Coinbase.
The post Pi Coin Holders Alert: $264M Token Unlock and Domain Expiry in June, Will Price Crash? appeared first on Coinpedia Fintech News
The Pi Network has been no stranger to controversy since its launch — and once again, it finds itself in the spotlight. With June approaching, the project is gearing up for one of its biggest challenges yet: a massive token unlock that could heavily impact the Pi Coin price. As of now, Pi Coin is …
Two new crypto hacks announced today target Nervos Network’s Force Bridge and Taiwan’s BitoPro exchange.
Initial estimated losses from these two hacks amount to approximately $3.7 million and $11.5 million.
Force Bridge Hack: $3.7 Million in Losses
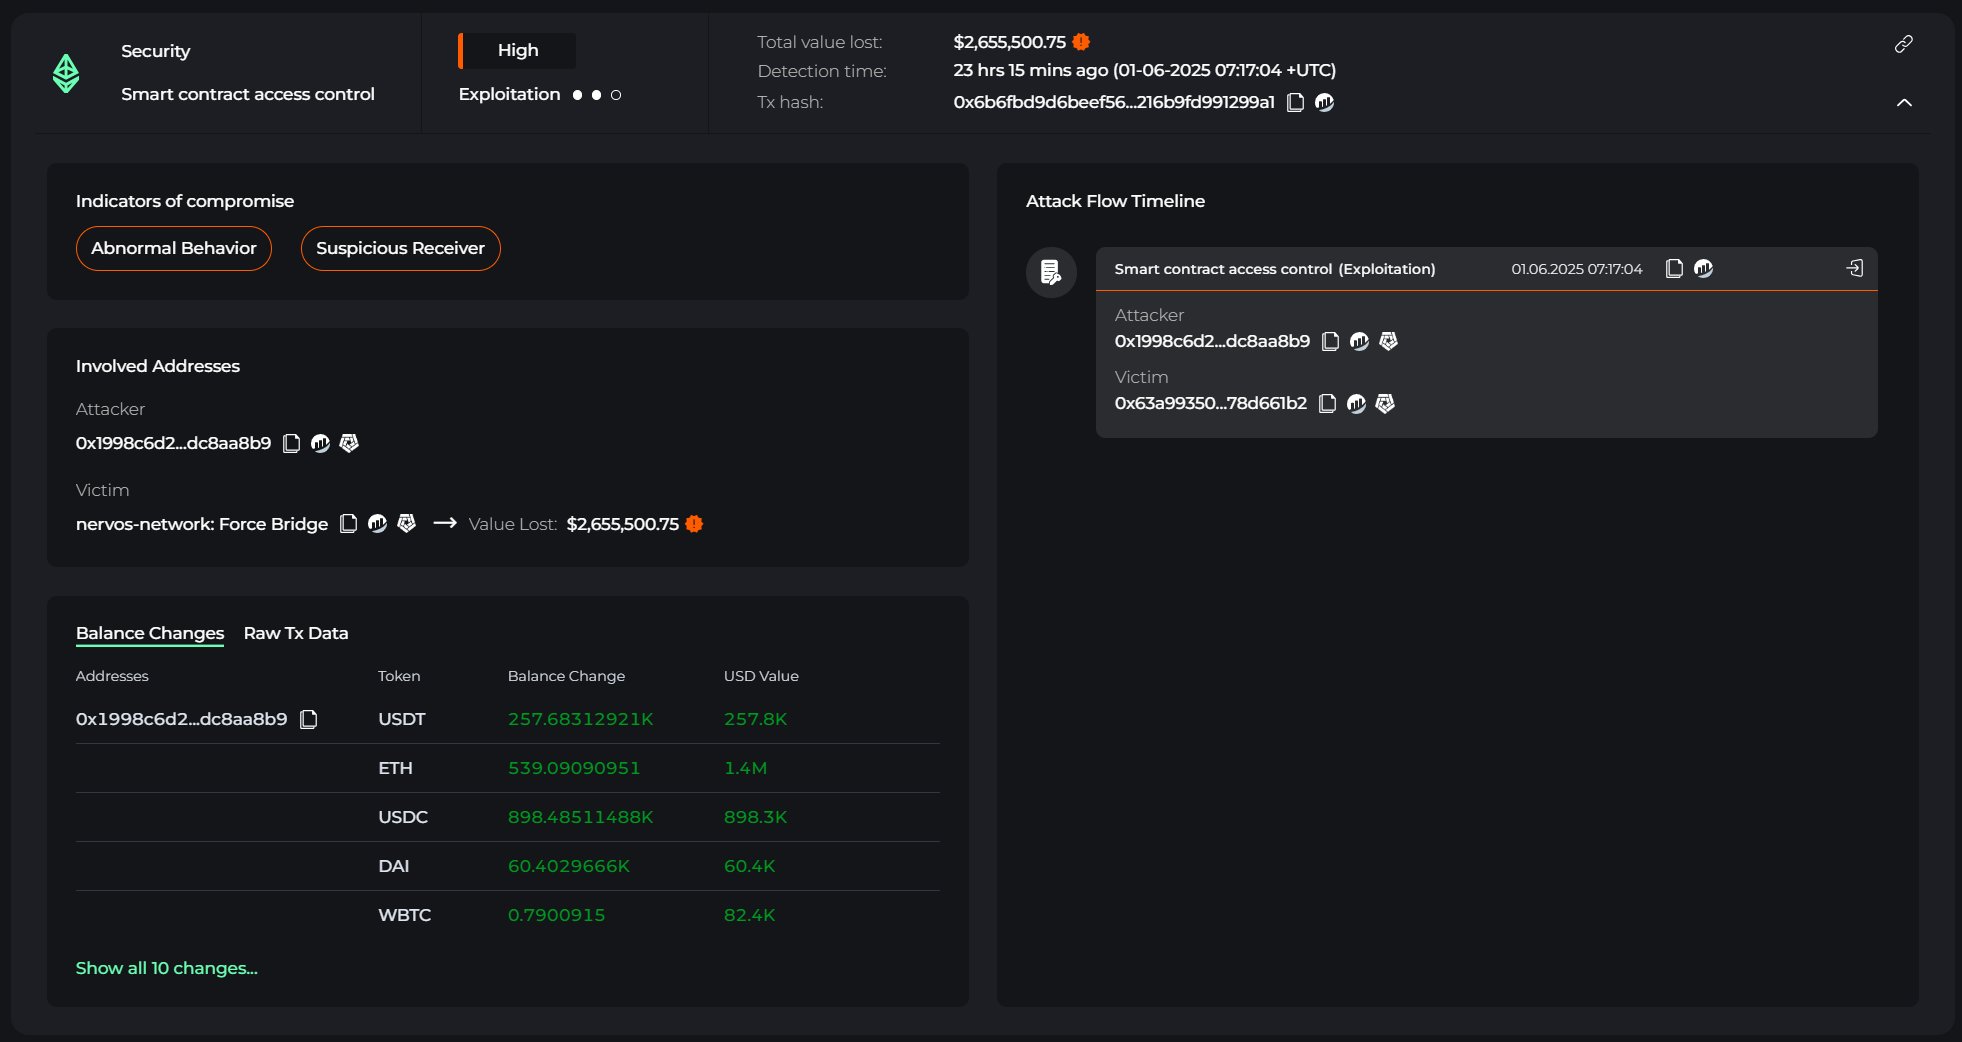
The first hack targeted Force Bridge, a cross-chain bridge of the Nervos Network. According to a report from Cyvers Alerts on X, a suspicious address gained control of the bridge.
After successfully executing the attack, the hacker stole approximately $3 million in assets, including 257,800 USDT, 539.09 ETH, 898,300 USDC, 60,400 DAI, and 0.79 WBTC.
Transaction related to Nervos Network’s Force Bridge. Source: Cyvers Alerts
These funds were subsequently converted to ETH and transferred to Tornado Cash—a transaction anonymization tool, complicating traceability efforts.
Cyvers Alerts’ analysis images show the flow of stolen assets, with confirmed losses totaling $2,655,500 as of the incident’s occurrence at 07:17:04 on June 1, 2025 (UTC).
Earlier, Magickbase—the operator of Force Bridge—detected abnormal activity at 03:12 on the same day and promptly suspended investigation services. This swift response, however, could not prevent the losses.
In a latest statement from Magickbase, the total amount of funds affected is approximately $3.7 million, of which roughly $3.1 million is on the Ethereum chain and approximately $600,000 is on the BNB Chain.
For safety reasons, Force Bridge (ETH/BSC to CKB bridge) has been temporarily disabled until further notice.
“Whenever a bridge exploit happens – no matter how big or small – it hurts everyone in the blockchain industry. There is a desperate need for open, vetted, industry-wide interoperability standards. As long as we, as an industry, continue to rely on proprietary products where shared, core infrastructure should exist, these kinds of tragedies will continue to happen,” Wanchain CEO, Temujin Louie, told BeInCrypto.
Suspected BitoPro Hack, $11.5 Million in Losses
On the same day, another hack was reported involving BitoPro, a Taiwan-based cryptocurrency exchange. According to a post from ZachXBT, BitoPro was likely attacked on May 8, 2025, with estimated losses of up to $11.5 million from its hot wallets.
Current status of BitoPro exchange. Source: CoinGecko
At the time of BeInCrypto’s reporting, BitoPro has not issued an official statement regarding the incident. Data from CoinGecko indicates that the Taiwan-based exchange recorded over $24 million in trading volume in the past 24 hours.
BitoPro has confirmed that the old hot wallet had been attacked during the funds allocation process during the wallet system upgrade and asset transfer operations.
BeInCrypto reported that malicious actors stole over $244 million from the cryptocurrency industry in May 2025.
Sui-based DeFi protocol Cetus accounted for most of the damage, with North Korean attackers resurfacing. BitMEX foiled a hack attempt by the North Korean hacker group Lazarus, revealing poor operational security.