In a shocking update today, US president Donald Trump posted that United States of America has bombde three Iranian nuclear facilities. The crypto market is crashing including large cap coin like Bitcoin and Ethereum both down by more than 5% in last on week. US Bombs Iranian Nuclear sites, Crypto Market Tumbles The ongoing conflict
Crypto giants Ripple and Circle are again in the spotlight, with rumors of a $20 billion deal surfacing after a $5 billion agreement failed to materialize. Experts are divided on whether Ripple will go all out to acquire the stablecoin issuer, with some considering the $20 billion deal too unrealistic.
This article examines the likelihood of Ripple’s $20 billion bid for Circle and its potential impact on the XRP ecosystem.
Will Ripple Buy Circle for $20B?
In the latest development within the XRP community, all eyes are on Ripple’s escalating efforts to acquire Circle, a move that could solidify its position in the stablecoin market. Ripple is said to be pushing forward with a new $20 billion proposal, following the collapse of its $5 billion Circle deal. While Ripple remains tight-lipped about its Circle acquisition plans, expert insights from Scott Melker (The Wolf Of All Streets) suggest CEO Brad Garlinghouse might be considering a substantial bid increase.
Community Questions the Alleged ‘Unrealistic’ Circle Bid
Despite increasing speculations of Ripple’s potential $20 billion Circle purchase, many question the viability of the deal. For instance, industry expert Dom Kwok suggested that the XRP platform’s final offer for Circle will likely fall within the range of $6 billion to $6.5 billion. His estimation is based on the typical acquisition premium, which is the amount a buyer pays above the target company’s valuation to incentivize the sale. This premium usually ranges from 20% to 30%.
Assuming that Circle’s valuation is around $5 billion, the expert asserted that a 20% premium would put the offer at $6 billion, while a 30% premium would put it at $6.5 billion. With this detailed analysis, the expert dismisses the rumors surrounding Ripple’s potential purchase of the USDT issuer for a whopping $20 billion.
Amidst these speculations, XRP lawyer John Deaton has brought up an interesting angle regarding the deal. The XRP attorney underscored the possibility of a “bidding war” between Ripple and Coinbase, a top crypto exchange, which already holds a minority stake in the stablecoin issuer.
However, if Ripple finally acquires Circle, one of the largest stablecoin issuers, it could be a game-changer for the former.
Many crypto investors dream about the day their favorite coin takes off — and for XRP fans, the big question is: how high can it go in the next 10-15 years? Different predictions have popped up online, and while some are overly bold, others seem within reach. Let’s break down what AI models are saying about XRP’s future price.
Where XRP Stands Right Now
At the moment, XRP is trading around $2.15. It’s come a long way from its earlier prices but is still far from the huge numbers some holders are hoping for. The coin has faced a tough battle with US regulators, but it’s still one of the major names in crypto, especially for international money transfers.
Some Say XRP Could Reach $22 by 2040
Analyst Cheeky Crypto made an analysis and one prediction puts XRP at $22 by the year 2040. The idea is that once the legal issues are sorted out, and if more banks and businesses start using XRP for faster, cheaper international payments, the price could climb steadily.
If this happens:
To have $500,000 by 2040, you’d need around 22,727 XRP today, which would cost about $53,000 at current prices.
If your goal is $1 million, you’d need 45,454 XRP, costing roughly $106,800 now.
Others Predict an Even Bigger Jump to $150
Some very bullish predictions by Goggle Gemini suggest that XRP could reach $150 by 2040. This would only happen if the coin became widely used for global money transfers and its demand skyrocketed.
In that case:
You’d only need 3,333 XRP to have $500,000
Or 6,667 XRP to hit $1 million
This would be a dream come true for early investors — but it’s a bold prediction, and no one can say for sure if it will happen.
The Truth Is Probably Somewhere in Between
While $22 seems more reasonable and possible if the market grows and XRP overcomes its challenges, $150 would require the perfect mix of massive adoption and strong market demand. The real price might land somewhere in between those two numbers.
The post XRP Price Prediction for 2040: Will It Be Enough to Quit Your 9-to-5? appeared first on Coinpedia Fintech News
Many crypto investors dream about the day their favorite coin takes off — and for XRP fans, the big question is: how high can it go in the next 10-15 years? Different predictions have popped up online, and while some are overly bold, others seem within reach. Let’s break down what AI models are saying …
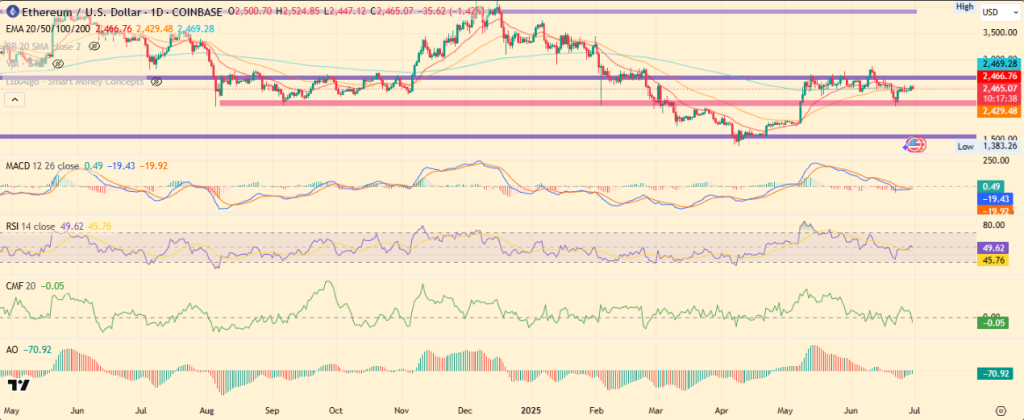
As the Ethereum price approaches Q3, it has shown a notable 3% increase, surpassing the crucial $2,500 mark before stabilizing at $2,470.
This upside coincides with an optimistic upgrade to Ethereum’s validator architecture. This is aimed at enhancing both security and decentralization, and to address ETH-staking problems by an “active-active” architecture.
A key player in this transformation is Obol Labs, the upgrade would allow Ethereum validators to function across multiple operators and machines.
That said, in the short term, as bullish sentiment grows, many analysts are making optimistic predictions for ETH more than ever. Notably, one of the prominent crypto analysts, Crypto Patel, recently suggested a breakout could propel Ethereum above $6,000.
However, amidst this renewed optimism, some whales are offloading their ETH on exchanges like HTX, ByBit, and OKX. Additionally, bears are increasing their positions against ETH, reaching all-time highs on the CME.
This current landscape presents a potential opportunity for a short squeeze, especially if these short positions face significant liquidation.
Why A Short Squeeze Could Pump Ethereum Price To $5K
According to Lookonchain data, a significant whale has been offloading ETH recently. Wallets 0x14e4 and 0x26Bb, likely belonging to the same entity, have unstaked and withdrawn a staggering 95,920 ETH, valued at approximately $237 million.
In the past 20 days, this whale has deposited 62,289 ETH (around $154 million) into exchanges like HTX, Bybit, and OKX, while still holding onto 33,631 ETH, worth about $83 million. This activity clearly indicates that bear do not want ETH price to pump.
However, amidst this bearish trend, the sentiment has shifted from pessimism to opportunistic. As an analyst has pointed out a potential short-squeeze situation, suggesting that the current market dynamics could favor a price rebound.
He noted that Ethereum shorts on the CME have reached an all-time high, with bears attempting to halt ETH’s upward momentum. It seems that the pressure on Ethereum is being artificially intensified.
Yet, the recent positive price action suggests that the market may be ready to turn the tables on these short positions.
Bears are stacking up positions AGAINST $ETH just now that it started holding up better.
The hate on Ethereum is just forced
As usual, the market likes to screw the majority over.
‘ETH to $5k in 2025’ is even more certain with this move now
The expert further mentioned that despite the bears stacking their positions to counter the ETH bullish wave, it is becoming increasingly clear that the Ethereum price could liquidate these shorts and reach $5,000 by 2025.
The Longer It Coils, the Longer The ETH Price WIll Breakout
The daily chart reveals that Ethereum’s price is hovering at a crucial juncture, near key EMA bands, including the 200-day, 50-day, and 20-day EMAs.
While the price action on the daily chart clearly indicates two months characterized by range-bound movement.
However, the longer this consolidation persists, the greater the potential of a significant breakout to come in ETH crypto. While technical metrics remain neutral, the MACD has recently turned bullish, forming a golden cross.
As a result, the chances are much higher that the price surge seen in Q2 will continue, supported by a continuation pattern in play.
[article_inside_subscriber_shortcode title=”Never Miss a Beat in the Crypto World!” description=”Stay ahead with breaking news, expert analysis, and real-time updates on the latest trends in Bitcoin, altcoins, DeFi, NFTs, and more.” category_name=”Price Analysis” category_id=”6″]
FAQs
How much will 1 ETH be worth by the end of 2025?
Some forecasts suggest ETH could reach a high of $5,925 by the end of 2025, with others predicting a range between $3,500 and $4,900, influenced by institutional adoption and scaling solutions.
What is the Ethereum price forecast for 2030?
Ethereum’s price forecast for 2030 ranges significantly. Some predictions suggest a high of $15,575, while others are even more optimistic, with figures around $22,000 or higher, driven by continued ecosystem development, increased adoption in DeFi/Web3, and scalability improvements.
How much is 1 Ethereum predicted to be worth in 2040?
Some analysts suggest ETH could soar to $50,000–$100,000, with some even indicating figures as high as $94,512 on average, assuming it becomes a crucial global financial infrastructure.
The post Ethereum Price Eyes $5K as Short Squeeze Looms: Analysts Predict Major Breakout appeared first on Coinpedia Fintech News
As the Ethereum price approaches Q3, it has shown a notable 3% increase, surpassing the crucial $2,500 mark before stabilizing at $2,470. This upside coincides with an optimistic upgrade to Ethereum’s validator architecture. This is aimed at enhancing both security and decentralization, and to address ETH-staking problems by an “active-active” architecture. A key player in …


 ALTSTEIN TRADE