The US government agreed to drop Coin Center’s appeal concerning Tornado Cash, guaranteeing future protection from sanctions. The platform’s TORN asset spiked after the announcement.
Still, it’s a little unclear what the platform’s next steps are. Several of its leaders face ongoing legal battles, even if the decentralized software remains operational.
This is the official end to our court battle over the statutory authority behind the TC sanctions. The government was not interested in moving forward and defending their dangerously overbroad interpretation of sanctions laws.
Thank you again to our co-plaintiffs:…
— Peter Van Valkenburgh (@valkenburgh) July 7, 2025
According to a report from Bloomberg Law, the crux of the issue regards a Texas District Court’s ruling against Tornado Cash sanctions. Essentially, Coin Center was set on legally ensuring that the US government couldn’t use the same pretext to sanction the firm again.
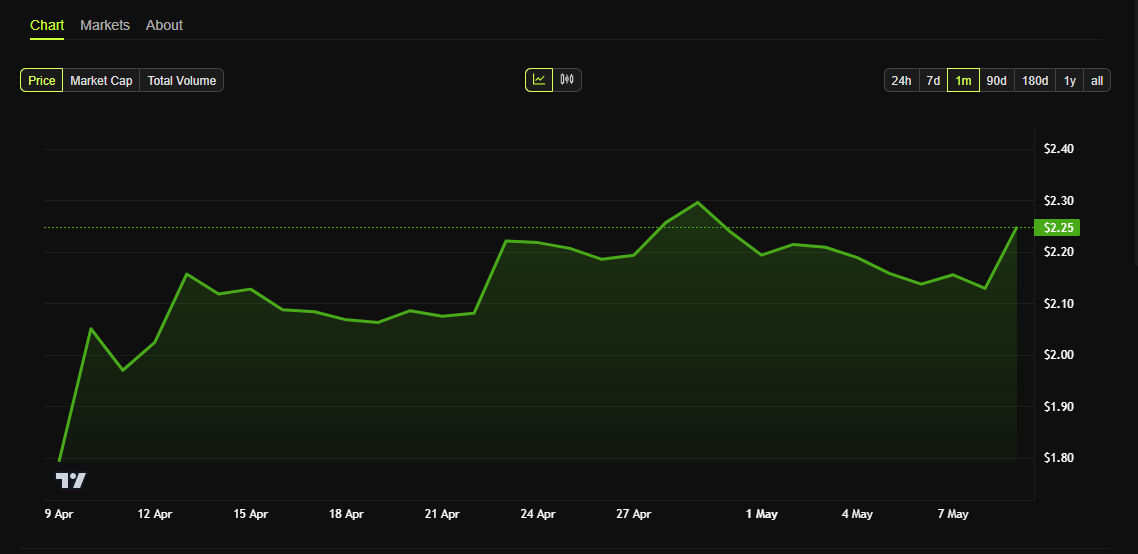
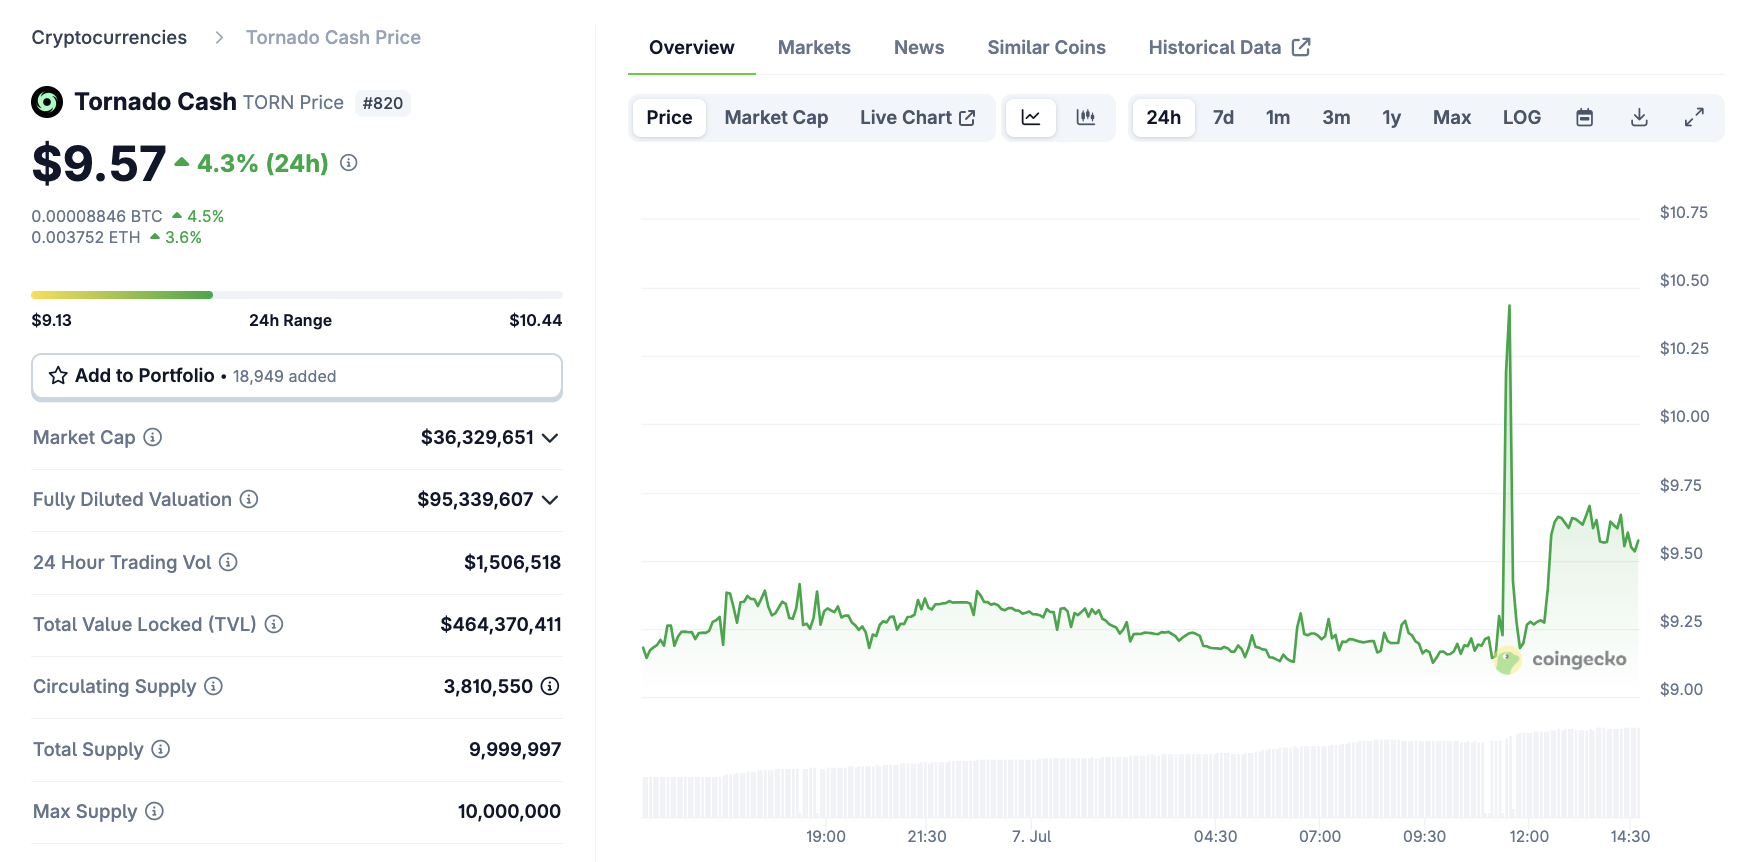
After all, crypto is enjoying a good moment, but fortune can be fickle. Watchdogs have already raised the alarm that the US could sanction Tornado Cash again, prompting Coin Center’s lawsuit. Its aim has been successful, causing the TORN asset to rise over 4% today on top of a brief spike:
Nonetheless, it’s a little unclear where Tornado Cash will go from here. Although the platform is still operational, several of its main leaders face continuing legal battles. It’s a very good sign that the US sanctions aren’t coming back for the foreseeable future, but the platform has a long way to go to restore its former position.
Pi Network (PI) is back in the spotlight after an 11% price surge triggered by the withdrawal of over 86 million tokens from OKX, sparking speculation of a coordinated supply squeeze. The move has intensified bullish sentiment, especially as technical indicators begin to align with the price action.
Momentum indicators like the DMI and EMA suggest growing strength, and a potential golden cross formation hints at the possibility of a continued breakout. However, not all signals are fully confirmed—volume-based metrics like the CMF show lingering indecision, making the next few days critical for confirming PI’s direction.
Technical Indicators Support PI Rally Amid Supply Shock Speculation
The sudden exodus of tokens sparked speculation of a coordinated supply squeeze, with some investors interpreting the move as a strategic effort by large holders to limit circulating supply and potentially drive the price higher.
Community voices on X described the event as a “power move,” pointing to growing confidence in the asset’s future trajectory.
While this triggered bullish momentum and boosted PI to the top of CoinGecko’s trending list, questions still linger regarding its long-term fundamentals, particularly its mainnet rollout, exchange listings, and broader use-case development.
From a technical perspective, PI’s Directional Movement Index (DMI) shows signs of growing strength. The ADX—a metric that measures the strength of a trend—has climbed from 12.46 to 16.6 in the past day, signaling that momentum is building. Typically, ADX values above 20 indicate a developing trend, with readings above 25 considered strong.
Meanwhile, the +DI line, which tracks bullish pressure, sits at 25.98—up from 20.14 yesterday, though slightly down from its peak earlier today at 29.15. The -DI, representing bearish pressure, has dropped significantly to 14.45 from 20.84 yesterday.
This divergence suggests that bulls are gaining control and sellers are stepping back, supporting the narrative that Pi Network may be entering a more decisive upward trend if this momentum continues.
PI CMF Drops After Brief Spike, Signaling Fading Buying Pressure
Despite the recent surge, PI CMF is now at -0.03.
Chaikin Money Flow (CMF), a volume-based oscillator that measures buying and selling pressure over a given period. CMF values range from -1 to +1, with readings above 0 suggesting accumulation (buying pressure) and below 0 indicating distribution (selling pressure).
Currently, PI’s CMF stands at -0.03—a notable improvement from -0.17 two days ago but a pullback from yesterday’s +0.09.
This shift shows that while the overall selling pressure has eased significantly, the recent dip back below the zero line suggests that buyers haven’t fully taken control. A CMF hovering around the neutral zone could imply indecision in the market or a pause after the recent rally.
For bulls to regain full momentum, the CMF would ideally need to push back into positive territory and hold, confirming sustained capital inflows and supporting the case for continued upside.
Golden Cross Setup Builds for PI, But Key Resistance Still in Play
Pi Network’s EMA lines are starting to align in a bullish setup, with a potential golden cross formation on the horizon. A golden cross occurs when a short-term EMA crosses above a long-term EMA, signaling the possibility of a sustained uptrend.
If this pattern confirms, PI price could gain enough momentum to challenge the resistance at $0.96.
A breakout above that level may open the door for further gains toward $1.30, and with strong follow-through, the price could even reach $1.67—levels not seen in recent trading activity.
However, the bullish scenario is not guaranteed. If the current uptrend loses steam and buying pressure weakens, Pi Network could retrace to test support at $0.66.
A breakdown below that level would likely shift sentiment more bearish, exposing the token to further downside toward $0.57.
While technical signals lean optimistic for now, traders will be closely watching whether the golden cross materializes and if resistance levels can be cleared convincingly.
Despite recent volatility, prominent analysts argue XRP’s technical setup is not bearish yet. They highlight specific price levels crucial for confirming the trend.
A technical evaluation of XRP’s recent 5-day chart adds context to these analyst views.
Analysts Remain Cautiously Optimistic About XRP Price
Veteran trader Peter Brandt highlighted a potential Head-and-Shoulders (H&S) pattern on XRP’s chart. This is traditionally a bearish indicator that signals a reversal from bullish to bearish if key support levels break.
However, Brandt emphasizes caution against premature bearish conclusions. He explicitly notes the importance of XRP maintaining support above $1.80.
Treat the Apr 7 overshoot as an out-of-line movement and we have a possible H&S top in $XRP For the sake of the uneducated trolls among you, this chart need NOT be interpreted as bearish Price is at support right now I will review if price closes below 1.8xxxx pic.twitter.com/YlsqLi2SzN
A decisive weekly close below that critical level would be needed to confirm a bearish scenario.
Meanwhile, analyst EGRAG CRYPTO provided a detailed bullish perspective using multiple technical indicators.
The Gaussian Channel is a volatility indicator used to identify trend strength and potential reversals. Closing within this channel boundary, around $1.75 currently, could signal weakening momentum and possible downward pressure.
Additionally, the 21-week EMA acts as a critical moving average that traders use to identify macro trends.
A close above the EMA level of $2.33 would signify strong bullish momentum.
Moreover, breaking above the resistance at $2.65 would confirm a robust long-term bullish trend.
EGRAG also applies Elliott Wave analysis, a technical approach that identifies repeating patterns (waves) in market prices to forecast potential targets.
Analyzing XRP Price with Elliott Wave Indicators. Source: X/EGRAG
Using Elliott Wave ratios, the analyst projects XRP could reach between $9 and $10 if the altcoin successfully completes its anticipated fifth wave, provided current support levels hold firm.
Short-Term Technical Analysis Supports Caution
XRP faced significant selling pressure as prices declined sharply towards $1.90, confirmed by the Accumulation/Distribution (A/D) line dropping notably.
The A/D line measures cumulative buying and selling pressure, and its decline indicates higher trading volume on price decreases, reflecting strong seller activity.
As XRP price reached support near $1.90, the A/D line stabilized and began a modest climb during the rebound, indicating renewed buyer activity.
XRP Accumulation/Distribution Chart Over the Past 5 Days. Source: TradingView
Nevertheless, the accumulation during this rebound has not yet fully neutralized the earlier distribution, suggesting caution remains warranted.
Consolidation and Critical Levels to Watch for XRP
These technical indicators suggest XRP is currently in cautious consolidation. While support near $1.90 proved strong, the limited improvement in CMF indicates ongoing market uncertainty.
Overall, this analysis aligns with analyst views that key support around $1.75 to $1.80 remains intact. Only a decisive weekly close below these supports would validate a bearish outlook.
Traders should closely monitor XRP’s interaction with critical support and resistance levels.
Specifically, a confirmed breakout above $2.33 and then $2.65 would signal bullish continuation, while a decisive breach of $1.75-$1.80 support would indicate increased bearish risk.
Ethereum (ETH) is up more than 10% over the last seven days as the market shows signs of renewed activity. However, key technical indicators reveal a mix of weakening trend strength and cautious optimism from buyers.
ETH is currently battling critical resistance zones that could define whether the rally continues or fades. With momentum still fragile, May could be a decisive month for Ethereum’s next major move.
Ethereum’s Trend Weakens Sharply as Bears Close In
Ethereum’s DMI chart shows its ADX is currently at 24.91, a sharp decline from 39 two days ago. The ADX, or Average Directional Index, measures the strength of a trend, whether up or down.
Generally, an ADX reading above 25 signals a strong trend, while values below 20 suggest the market is entering a period of weakness or range-bound trading.
The steep drop in ADX indicates that Ethereum’s recent momentum is quickly losing strength. Without renewed buying or selling pressure, ETH could remain stuck in a more volatile, sideways pattern over the short term.
Meanwhile, the directional indicators are showing a clear shift. The +DI, which tracks bullish pressure, has dropped to 22.71, falling from 31.71 three days ago and 27.3 yesterday.
In contrast, the -DI tracks bearish pressure has climbed to 17.68, up from just 7.16 three days ago and 15.64 yesterday. Yesterday, the gap between buyers and sellers nearly closed, with +DI at 20.91 and -DI at 20.1, suggesting sellers almost regained market control.
ETH RSI Climbs After Sharp Drop: Will the Recovery Hold?
Ethereum’s RSI is currently sitting at 56, up from 45.5 one day ago, after reaching 70.46 four days ago. The Relative Strength Index (RSI) is a momentum indicator that measures the speed and magnitude of price movements.
Typically, an RSI above 70 suggests an asset is overbought and may be due for a pullback, while an RSI below 30 indicates oversold conditions and the potential for a rebound.
Readings between 30 and 70 are considered neutral, with levels around 50 often signaling a market at a decision point. The sharp swing in Ethereum’s RSI over the past few days reflects the recent volatile sentiment around ETH.
With the RSI back up to 56, Ethereum has regained momentum after dipping into neutral-to-bearish territory. A reading above 50 leans slightly bullish, suggesting that buyers have started to reassert some control, though not with overwhelming strength.
However, if momentum stalls again and the RSI turns back down, it would suggest the recovery is losing steam and that Ethereum could fall back into a broader consolidation or even a correction phase.
Ethereum Battles Key Resistance as Breakout or Breakdown Looms
Ethereum price has made several attempts over the past few days to break above the resistance level at $1,828. If ETH manages to break and hold above this level decisively, it could open the door for a stronger move upward.
The next major target would be $1,954, and if bullish momentum remains strong, a further rally toward $2,104 could unfold. Ethereum could eventually test $2,320 in an even more aggressive uptrend, marking a significant bullish extension.
These levels will be key to watch as they could define the strength and sustainability of any breakout in the coming days.
On the downside, if Ethereum fails to hold its current levels and the trend reverses, the first critical support to watch lies at $1,749. A break below that could trigger a move lower toward $1,689.
Losing these levels would signal a much deeper correction, suggesting that the recent attempts at recovery were only temporary before a more prolonged bearish phase sets in.