The United States Securities and Exchange Commission (SEC) has delayed making a definitive decision on the Fidelity Solana Fund. The SEC announced a 21-day period for the public to submit their comments on whether the Fidelity Solana Fund should be approved or disapproved.
Additionally, the agency instituted 35 days for the members of the public who intend to submit a rebuttal comment. The agency followed a similar pattern with other spot Solana ETFs and other altcoins in the recent past.
When Will Solana ETF Happen in the U.S?
According to people familiar with the matter, the U.S. SEC requested prospective issuers of spot Solana ETFs to re-file amended S-1 documents before the end of July. The move follows a similar request made last month, which signaled the imminent approval of spot Solana ETFs soon.
“I think that the SEC has some pressure to approve these quicker than waiting all the way to October, especially with that Rex Shares product that got approved last week,” a person familiar with the matter noted.
According to James Seyffart, a senior ETFs analyst at Bloomberg, there is more than a 90 percent chance that the U.S. SEC will approve the various spot SOL ETFs by the end of 2025.
What’s Next for SOL Price?
As with the wider altcoin market, SOL price has been trapped in a choppy consolidation pattern in the past year. The large-cap altcoin, with a fully diluted valuation of about $89.5 billion and a 24-hour average traded volume of around $3.7 billion, has been attempting to regain macro bullish momentum after rebounding from a support level around $130.
Although the weekly Relative Strength Index (RSI) has been forming a midterm bearish sentiment, robust fundamentals will likely propel SOL price towards a new all-time high in the near term.
Bitcoin’s price recorded the highest weekly close in history, above $107,000, clearing the path towards a new ATH. Meanwhile, the bears have intensified their action, which has dragged the levels below the previous day’s open range, raising huge concerns over the upcoming price action. On the other hand, BTC’s liquidity range has entered a crucial phase wherein a strong conflict between the bulls and the bears could be seen as a means of gaining supremacy in the coming days.
Ever since the BTC price triggered a rebound from the local lows, the whales and the bulls seem to have become more optimistic. As a result, more long traders were being placed with massive leverage. This made the retail traders bullish on Bitcoin, offering a strong boost to the BTC price rally, which almost marked the highs. Frightfully, these whales have begun to extract profit, which seems to be a major reason behind the current downfall.
As suggested by the above data, a Hyperliquid whale who had placed a 40x long trade on Bitcoin has begun to take profits after earning $10 million in 24 hours. Interestingly, the whale still holds a massive $337 million long position on BTC, which shows a serious conviction. Now the question arises whether the Bitcoin bull run has more room or it’s time for the exit door.
The daily chart of Bitcoin continues to remain under bullish influence, despite the bearish interference. The price just faced a rejection before entering the final resistance zone below the ATH, which suggests a final correction before marking a new high. The On-Balance Volume has been plunging, which indicates a drop in the buying activity with an increase in the sell-offs. However, the MA levels keep up some hope as the BTC price could be heading towards a Golden Cross.
The 50/200-day MA is heading for a bullish crossover, which usually triggers a massive upswing. Hence, the upcoming monthly close could have a major impact on the upcoming rally, as a successful completion of a Golden Cross could propel the BTC price above $110,000. In case of a failure, the star crypto may begin with a strong pullback, extending the correction phase.
The post Bitcoin Juggling Between Pivotal Levels-Here’s What’s Next for the BTC Price Rally if it Plunges Below $102K appeared first on Coinpedia Fintech News
Bitcoin’s price recorded the highest weekly close in history, above $107,000, clearing the path towards a new ATH. Meanwhile, the bears have intensified their action, which has dragged the levels below the previous day’s open range, raising huge concerns over the upcoming price action. On the other hand, BTC’s liquidity range has entered a crucial …
Societe Generale-Forge, the crypto division of one of France’s top three banks, has launched a new USD-pegged stablecoin called USD CoinVertible (USDCV). The stablecoin will operate on both Ethereum and Solana blockchains, making it accessible across major decentralized ecosystems. BNY Mellon will act as the asset custodian, ensuring secure backing of the stablecoin. This move marks a major step in bridging traditional banking with the fast-growing world of digital finance.
The post France’s Societe Generale Launches USD-Backed Stablecoin on Ethereum & Solana appeared first on Coinpedia Fintech News
Societe Generale-Forge, the crypto division of one of France’s top three banks, has launched a new USD-pegged stablecoin called USD CoinVertible (USDCV). The stablecoin will operate on both Ethereum and Solana blockchains, making it accessible across major decentralized ecosystems. BNY Mellon will act as the asset custodian, ensuring secure backing of the stablecoin. This move …
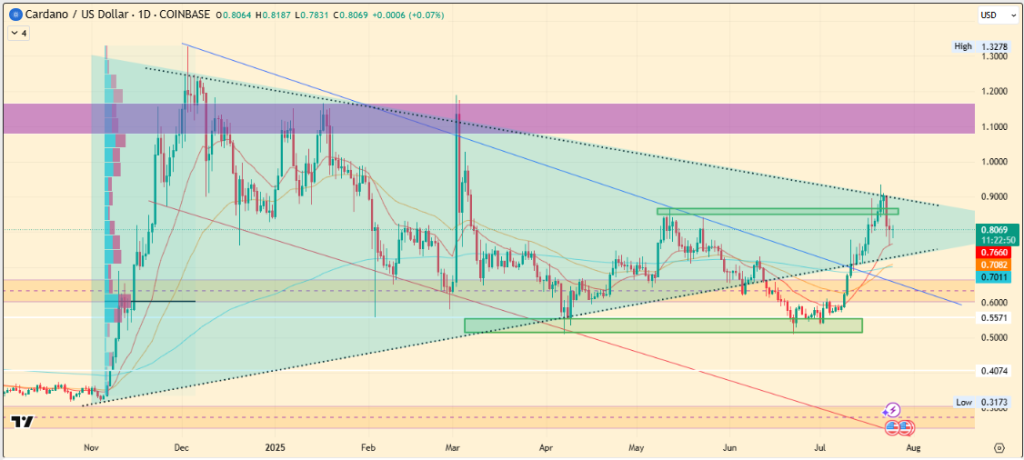
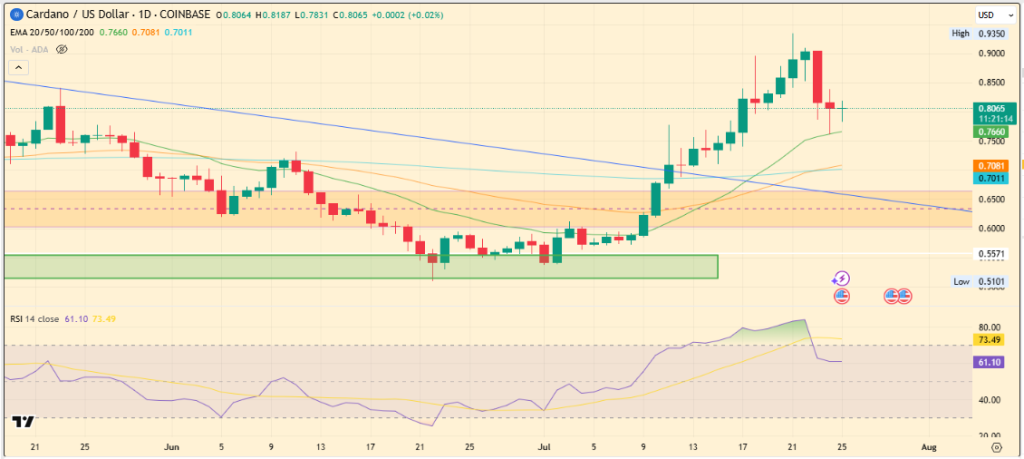
The Cardano price today is trading at $0.8118 after a recent correction of over 12% from the $0.92 level. Despite this recent drop, its long-term technical setups remain unaffected.
In fact, the fall has cooled off its exhaustion from the short-term rally. It suggests that another major bullish structure may be forming, besides the falling wedge.
If this breaks out, then a much larger rally could be on the horizon in the coming weeks. Even experts continue to mention their thoughts on the ongoing falling wedge’s rally, and they are optimistic that soon $1 mark will be flipped.
Cardano Price Today Faces Short-Term Pressure but Holds Long-Term Structure
The Cardano price today showed that it is sustaining after this week’s sell-off, which mirrored broader crypto market weakness, where several major altcoins lost momentum amid fading sentiment.
As a result, the ADA price slipped more than 12% from $0.92 to $0.81, retreating from its previous support near the June highs.
Yet, it has managed to stabilize on the 20-day Exponential Moving Average (EMA), which now acts as its short-term dynamic support.
Adding to this, the 24-hour trading volume has dropped 26% to $1.79 billion. This is signaling reduced participation from both buyers and sellers. While falling volume usually confirms a lack of conviction, but it can also precede a sharp move once direction is confirmed.
Long-Term Patterns Hint at a Potential Reversal
What’s encouraging from a technical standpoint is that despite the recent dip, the Cardano price today is maintaining a broader bullish structure on the daily chart.
A falling wedge formation built after months of bleeding price action from $1.32 high has displayed an breakout in July, which is still intact and ongoing.
Even an analyst, Javon Marks, highlights that this pattern mirrors setups from previous bullish cycles. Where each of those historical patterns was followed by a rally, making this current structure worth watching.
Importantly, the recent sell-off appears to be a sign of a pullback for a much larger momentum ahead. That said, the price decline this week has not invalidated the pattern; instead, it has strengthened it, and the overall structure remains intact.
Symmetrical Triangle Converging with Breakout Path
Apart from the falling wedge, the daily chart showcases another pattern, where the Cardano price today seems to be at the center of the pattern.
This pattern is the multi-month symmetrical triangle. This triangle showed a breakdown in June, but the price re-entered the range, invalidating last month’s breakdown.
Most recently, the sell-off in ADA was also seen from this pattern’s upper boundary, showing its importance in the Cardano price chart.
Even though the symmetrical triangle hasn’t confirmed a breakout yet, it complements the falling wedge pattern, which is already in play.
The convergence of both formations, combined with strong historical context, increases the odds of an upward move.
If ADA breaks out of this triangle in the coming weeks, the $1 mark could be the first significant level to test, potentially setting the stage for a broader uptrend.
Additionally, July has already been marked by structural resilience, and the upcoming August could bring additional positive triggers for ADA price action.
The post Cardano Price Today Holds Steady at $0.81: Is a $1 Breakout Next? appeared first on Coinpedia Fintech News
The Cardano price today is trading at $0.8118 after a recent correction of over 12% from the $0.92 level. Despite this recent drop, its long-term technical setups remain unaffected. In fact, the fall has cooled off its exhaustion from the short-term rally. It suggests that another major bullish structure may be forming, besides the falling …


 …
… MARKS (@JavonTM1)