Amidst the ongoing market uncertainty, TRX, the native token of Tron, is standing out from other assets due to its impressive performance over the past 24 hours. As of today, March 19, 2025, the asset has recorded an 8% gain, outperforming major cryptocurrencies like Bitcoin (BTC) and Ethereum, along with several others.
TRX Defies Bearish Trend and Outperforms BTC and ETH
The upside rally and price surge in TRX occurred after billionaire and Tron founder Justin Sun made a major announcement. Today, in a post on X (formerly Twitter), Sun stated, “TRX will be soon on Solana. Ready to buy and collaborate.”
It appears that this collaboration with Solana aims to enhance cross-chain transactions with SOL and other meme coins while leveraging Solana’s fast and low-cost network to improve overall efficiency.
TRX will be soon on solana. Ready to buy and collaborate
Sun’s announcement, amid the current market sentiment, helped TRX recover its losses, turn bullish, and sustain its upside momentum. The asset is currently trading near $0.238, recording a price surge of over 8.50% in the past 24 hours.
Additionally, following this announcement, trader and investor participation skyrocketed, leading to a 25% surge in trading volume.
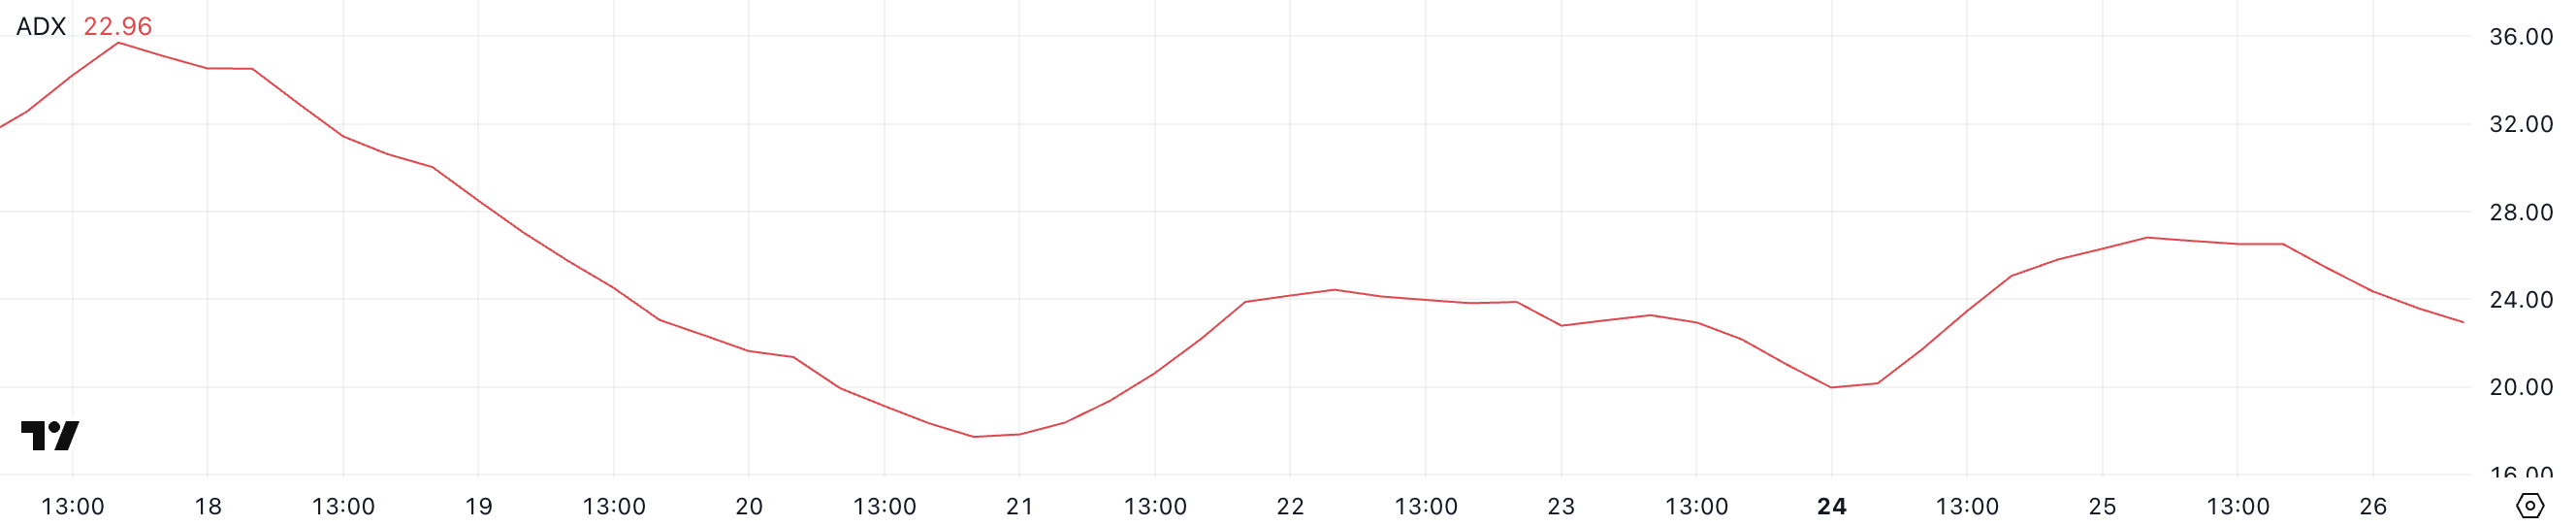
Tron (TRX) Technical Analysis and Upcoming Levels
According to CoinPedia’s technical analysis, TRX appears bullish, and with the ongoing rally, it has regained one of its crucial support levels at $0.22 while moving toward the resistance level of $0.25.
The TRX daily chart shows that the asset was previously trading within a tight range between $0.2185 and $0.25. However, given the recent price rally and Sun’s announcement, it appears that the bulls are back, and the asset is poised to continue its upside momentum until it reaches the $0.25 level.
Source: Trading View
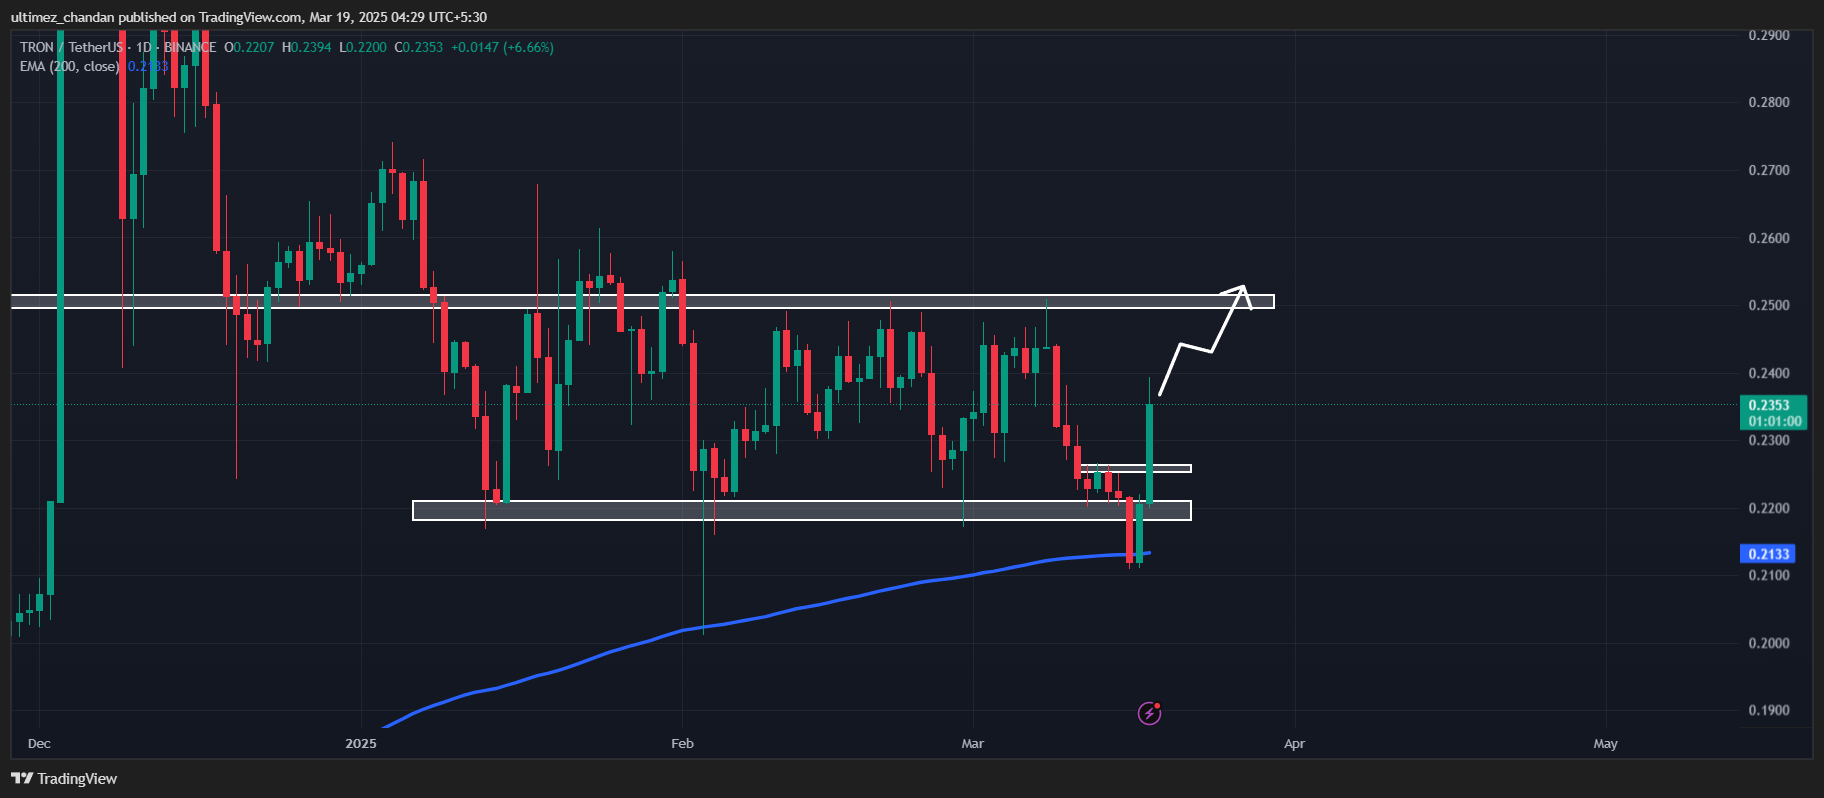
Additionally, during the recent price drop, the asset successfully retested the 200 Exponential Moving Average (EMA) on the daily timeframe, indicating that it remains in an uptrend.
Citi Group’s April 2025 report “Digital Dollars” noted that the stablecoin market could grow to be a $1.6 trillion sector. If Ripple’s RLUSD captures even a meagre 10% of the $1.6 trillion stablecoin market, how will it impact XRP price?
Despite Ripple being a new entrant to the stablecoin sector, RLUSD market capitalization has grown to a staggering $300 million since its launch in December 2024. XRP token is a bridge currency that helps transfer value from RLUSD to another currency like the US dollar, Yen, Euro, etc. Hence, if RLUSD manages to capture 10% of $1.6 trillion, aka, $160 billion, it could most definitely have a positive impact on XRP price.
Ripple price today trades around $2.16, dropping 5.2% in the past 24 hours.
XRP Price Reaction if Ripple’s RLUSD Captures 10% of $1.6 Trillion Stablecoin Market?
Citigroup, a top American bank, published a report on how the stablecoin market could grow to be a $1.6 trillion sector by 2030. This estimate is a 556% surge from the current level of $244 billion. The current stablecoin market is dominated by the likes of Tether (USDT) and USD Coin (USDC), which are likely to maintain their dominance. However, newer stablecoins like Ripple USD (RLUSD) could gain ground after Trump’s endorsement of USA cryptocurrencies. Although RLUSD was launched in December, it has already hit $300 million in market cap.
Unlike USDT, USDC and other stablecoins, the connection between XRP & RLUSD is something interesting. XRP is used as a bridge currency when a user wants to send RLUSD across borders, which will include conversion of RLUSD to XRP and XRP to the required currency, like EUR, GBP, YEN, and so on.
To be precise, if RLUSD market cap hits $160 billion, a 53,000% increase from the current level of $300 million, its daily volume would also spike from $50 million to roughly $26 billion. Let’s assume three scenarios to determine the price impact on XRP.
If 10% of the daily RLUSD volume is bridged via XRP: The token’s volume would triple to $4.5 billion from an average of $1.5 billion. The impact of this could push XRP price up between 50% to 200%, i.e., XRP price could hit $3.24 to $6.48.
If 25% of RLUSD volume is bridged via XRP: The token’s volume would hit $8 billion per day and XRP price could shoot up to a range of $6.48 to $10.80.
If 50% of RLUSD volume is bridged via XRP: XRP’s daily volume could reach a staggering $15 billion. In such a case, the FOMO and frenzy could cause XRP price to hit $10.80 to $21.60.
To conclude, if Ripple’s RLUSD captures 10% of the $1.6 trillion stablecoin market, it could push the XRP price to reach $6 to $12. The token could reach the $12 to $20 range in a highly bullish case.
Such an increase would impact the Ripple price in various ways. First, it would help Ripple to achieve its goal of taking market share from the SWIFT network. Second, it would also boost the network activity and fees of the XRP Ledger network. Further, the RLUSD growth would help to boost the XRP price and the burn rate, and boost its deflationary goals since part of the fees are incinerated
The long-term XRP price forecast is bullish, with some analysts predicting that it will rise as high as $15. The growth of its ecosystem, especially RLUSD, will help to supercharge this growth.
The weekly chart paints a long-term bullish outlook for Ripple. It formed a cup-and-handle-like chart pattern with the upper side at $1.9822. It has retested the upper side of this pattern, pointing to a continuation ahead.
XRP has remained above the 50-week moving average, which has provided crucial support in the past few months. Therefore, although it’s too early to predict, there is a likelihood that the coin will continue to soar in the near term. Further gains will be confirmed if the coin rises above its year-to-date high of $3.40. Such a move will boost the XRP price forecast to $5.
XRP Price Chart
A drop below the key support at $1.6075 will invalidate the bullish view of Ripple price. This invalidation point is the lowest level this week and also along the 50-week moving average. A drop below that level will point to more downside, potentially to $1.
Cardano’s price has surged 10% over the past 24 hours, riding the wave of a broader crypto market rally to reach a two-month high.
The sharp move upward has pushed ADA to levels last seen in early March and has reignited bullish sentiment among spot and derivatives traders.
Cardano’s 10% Pump Sparks Surge in Profitable Supply
On-chain data from Santiment reveals that Cardano’s double-digit rally has boosted the percentage of its supply in profit. As of this writing, approximately 74.14% of ADA’s circulating supply—equivalent to 26.91 billion tokens—is now held at a profit.
Cardano Percent of Total Supply in Profit. Source: Santiment
When an asset’s profit supply spikes, it means that a significant portion of its circulating supply is now worth more than when it was acquired. Historically, a rise in profit supply correlates with renewed accumulation and often hints at further upward momentum as market sentiment improves.
Moreover, in the ADA derivatives market, the coin’s funding rate remains firmly positive, indicating that traders are increasingly taking long positions in anticipation of continued gains. This is currently at 0.0099%.
The funding rate is a recurring payment between traders in perpetual futures contracts, designed to keep the contract price aligned with the spot market.
When positive like this, traders holding long positions are paying those with shorts, indicating bullish sentiment and expectations of further price increases.
ADA Rally Gains Steam, but Profit-Taking Could Threaten $0.76 Support
With technical indicators flashing bullish and sentiment strengthening, ADA buyers have regained control, at least for now. If buying pressure strengthens and bull dominance remains, ADA could maintain its upward trend and rally to $0.84.
However, once buyers’ exhaustion sets in and traders begin to lock in their soaring profits, ADA could break below the support at $0.76 and fall toward $0.66.