The U.S. may soon see clear rules for crypto. A crypto market structure bill is now expected to be ready by September. Sacks Aim for Completion of Crypto Market Structure Bill by September David Sacks, the AI and crypto czar for President Trump, thanked Senators Tim Scott and Cynthia Lummis for laying out a clear
Michael Saylor, co-founder of Strategy (formerly MicroStrategy), has once again dropped a cryptic hint suggesting that his firm may soon add more Bitcoin to its already massive holdings.
In a June 22 post on X, Saylor shared a chart of Bitcoin’s performance, paired with the phrase, “Nothing Stops This Orange.”
Saylor Predicts Bitcoin Could Hit $21 Million in Two Decades
This has resulted in the firm holding around 592,100 BTC, valued at over $60 billion. Strategy’s BTC reserve represents approximately 2.8% of Bitcoin’s total supply and makes it the world’s largest corporate holder of the asset.
Meanwhile, Saylor’s confidence in Bitcoin shows no signs of fading despite his firm’s substantial holding. The Bitcoin bull recently predicted that the top crypto could hit $21 million in price within the next 21 years.
Prominent investor Jim Chanos, best known for his bearish calls on companies like Enron, has publicly challenged Saylor’s claims regarding the firm’s use of debt.
In a video clip shared online, Saylor defended his strategy by saying that the company’s debt is “convertible,” “unsecured,” and “no recourse.” The Bitcoin bull also suggested that the top crypto’s value could fall 90% without impacting his firm’s repayment obligations.
Michael Saylor says, “It’s not debt, it’s convertible debt. Bitcoin could go from $100K to $1K, the debt is not going to get called, there is no recourse.” pic.twitter.com/Qc6L0vV6Hf
However, Chanos disagreed strongly with this view, saying Strategy remains liable if the debt hasn’t converted to equity by maturity.
“There is of course recourse to Strategy if the convertible debt has not converted to equity, when due. How does he not know this?,” the investor questioned.
His criticism implies that Saylor may be overstating the safety of the firm’s debt position.
This dual position highlights a growing view among some investors that while Bitcoin may thrive, Saylor’s aggressive corporate strategy could carry hidden risks.
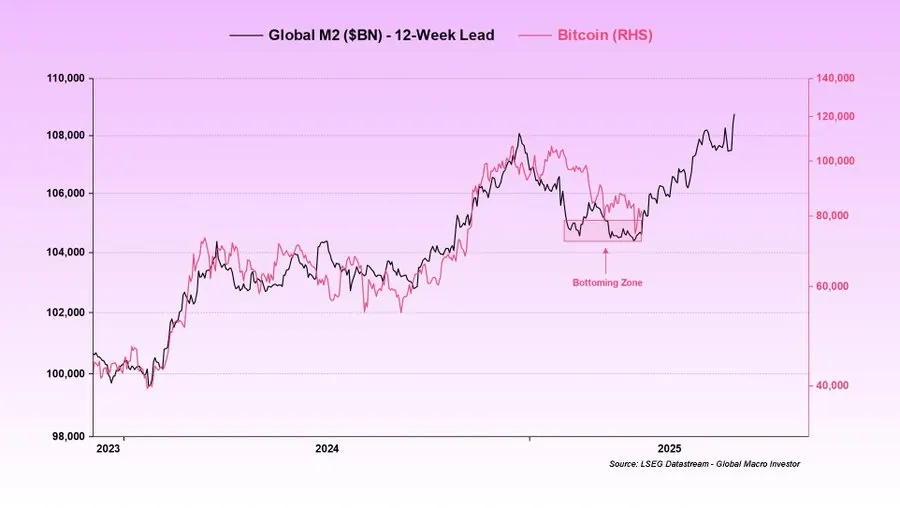
A macroeconomic chart reveals that the M2 Money Supply is starting to rise again. Historical market patterns suggest that there is a correlation between the M2 Money Supply index and the Bitcoin price index. Crypto market watchers are now eyeing a potential all-time high for Bitcoin within this quarter, if historical correlations between M2 and crypto prices hold true. Here is what you should know.
M2 Money Supply on the Rise: What It Means
Analysing M2 is a way economists use to track all the money that is easily available in an economy. M1 is the most basic form of money, which includes cash and checking accounts. M2 is a broader measure, which includes everything in M1 plus savings accounts, money market accounts and certificates of deposit.
A macroeconomic chart, shared on X by renowned crypto analyst Michael van de Poppe, shows that the M2 money supply is starting to rise again.
A sharp rise in the M2 money supply implies that there is a significant increase in the amount of easily accessible money in the economy.
Historical Correlation Between M2 and Bitcoin Prices
Historical market patterns indicate that there is a correlation between the M2 money supply index and the BTC price index.
Last time, while Bitcoin was inching towards an all-time high, the US was preparing to witness a political shift.
It was on January 20, hours before Trump’s inauguration, that the BTC market crossed the crucial $109K mark. Since January 21, the BTC market has declined by over 19.28%.
This crypto analyst also warns that if BTC rises with M2 supply, the global economy could see several unusual developments: decreasing bond yields, falling gold prices, declining dollar index, increasing CNH/USD, and rising altcoins.
The US 5-year Bond Yield sits at 4.021%, 10-year at 4.384%, 20-year at 4.862%, and 30-year at 4.821%. Since the start of this month, especially after the announcement of Trump’s tariffs, all these bond markets have seen steady growth.
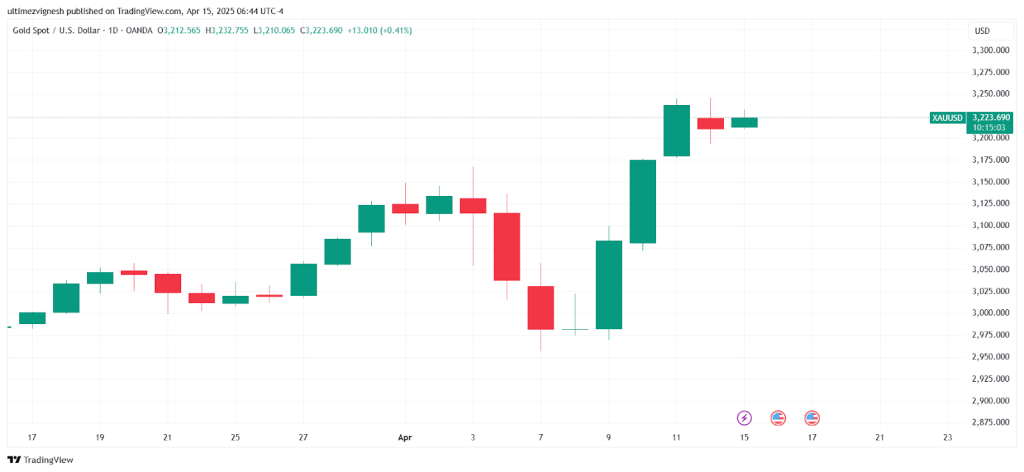
Similarly, the Gold Spot market, which is currently priced at $3,222.885, has grown significantly during the period. On April 11, the market even touched an ATH of $3,244.
In conclusion, while a rising M2 supply brings renewed optimism for Bitcoin and the broader crypto market, investors must remain cautious. Correlations can shift and macroeconomic events may change course quickly. As analysts warn of ripple effects across asset classes, it is crucial to monitor the evolving data closely, Whether this is the start of a new rally or a temporary spike, the coming weeks will be decisive for BTC’s direction.
Never Miss a Beat in the Crypto World!
Stay ahead with breaking news, expert analysis, and real-time updates on the latest trends in Bitcoin, altcoins, DeFi, NFTs, and more.
The post How High Can Bitcoin Price Go? Exploring the Correlation Between M2 and Bitcoin appeared first on Coinpedia Fintech News
A macroeconomic chart reveals that the M2 Money Supply is starting to rise again. Historical market patterns suggest that there is a correlation between the M2 Money Supply index and the Bitcoin price index. Crypto market watchers are now eyeing a potential all-time high for Bitcoin within this quarter, if historical correlations between M2 and …