The Trump Meme project announced an exclusive TRUMP NFT collection for everyone who signed up for the leaderboard.
$TRUMP price has recorded a significant increase in daily average traded volume amid anticipated further price uproar.
The Trump meme project announced the result and details of the $TRUMP competition launched last month. According to the announcement, all the top 220 $TRUMP token holders on the leaderboard were sent an email with further details of the dinner with the U.S. President Donald Trump on May 22, 2025.
In addition to the invitation, the Trump meme project also announced a unique NFT collection for the top 220 holders. As for the rest of the participants, an exclusive TRUMP NFT was created.
In a bid to incentivize more whale holders, the Trump meme project announced that a special TRUMP DIAMOND HAND limited Solana NFT will be reserved for the top 220 invitees that hold the same amount of TRUMP tokens as the time of the final leaderboard announcement.
“The next era of $TRUMP will be announced at the dinner! See you there! Black Tie preferred, but optional,” the announcement noted.
What Next for $TRUMP Price Action
Following a successful bullish breakout from a macro-falling logarithmic trend, the TRUMP token experienced the first major resistance around $15. The mid-cap memecoin, with a fully diluted valuation of about $14.21 billion, recorded an 84 percent surge in daily average traded volume to about $2.86 billion on Monday, May 12, during the mid-North American trading session.
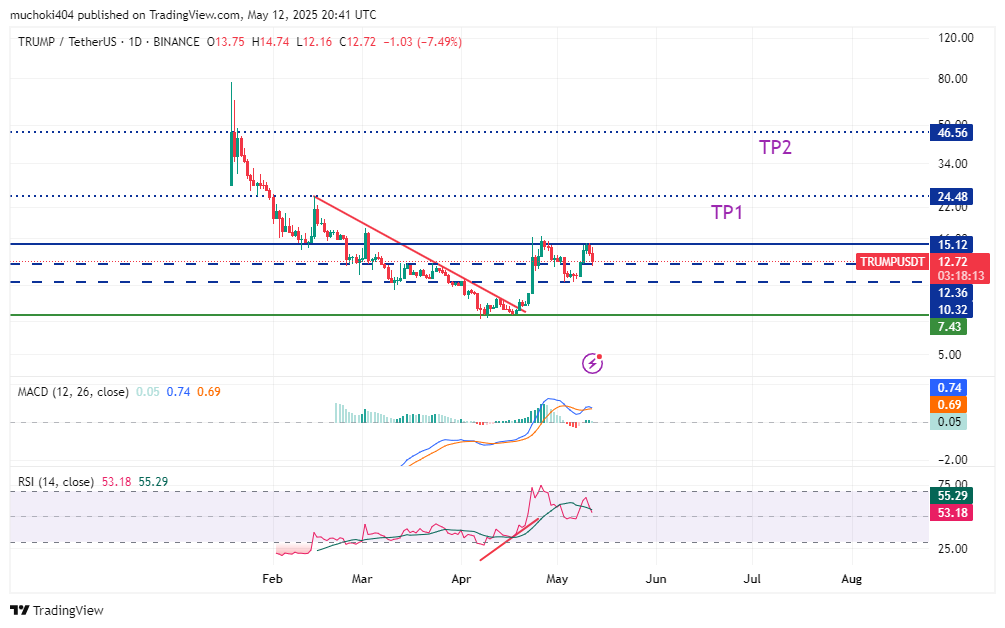
From a technical analysis standpoint, TRUMP’s price, in the daily timeframe, is well positioned to rally towards $24, if it rebounds from the support range between $10.32 and $12.36. Furthermore, the daily MACD line has already crossed above the zero line amid the highly anticipated altseason for 2025.
Over the past few months, Ethereum has experienced a significant decline in user activity on its blockchain. This slowdown has reduced the network’s burn rate—a mechanism that helps decrease ETH supply over time.
With fewer tokens being burned, ETH’s circulating supply has risen, putting inflationary pressure on the asset. As a result, the coin has struggled to maintain a stable price above the $2,000 level in recent months.
Low Burn Rate Equals More Coins in Circulation
According to Ultrasoundmoney, 72,927 ETH, valued at $134 million at current market prices, have been added to ETH’s circulating supply in the past month alone.
At press time, this sits at 120,730,199 ETH, significantly above pre-merge levels.
This increase in ETH’s supply is driven by a decline in user activity on the Ethereum network, reducing its burn rate. Ethereum’s burn mechanism, introduced through EIP-1559, destroys a portion of transaction fees to reduce the circulating supply of ETH.
However, this mechanism is directly tied to network usage. So, when fewer transactions occur like this, less ETH is burned, resulting in ETH’s supply spiking.
According to Etherscan, the daily amount of ETH burnt has dropped by 95% year-to-date. In fact, the network recently recorded its lowest amount of coins burnt in a single day on April 20.
Many users and developers are migrating from Ethereum to Layer-2 (L2) solutions like Optimism and Arbitrum. These networks offer significantly lower transaction fees and faster execution, reducing user activity on Ethereum’s mainnet.
For example, as of April 30, the average transaction fee on Optimism’s mainnet was just $0.024. By contrast, completing a transaction directly on Ethereum cost users an average of $0.18 on the same day, which is over seven times more expensive.
Optimism Average Transaction Fee. Source: Dune Analytics
Moreover, thanks to the recent meme coin mania, “Ethereum killers,” such as Solana, have gained significant traction over the past few months, drawing users away from the L1.
Together, these trends have led to a decline in Ethereum’s transaction count, hence the network’s low burn rate.
How Do Ethereum’s Fundamentals Stack Up?
The drop in Ethereum’s user demand and the subsequent rise in ETH’s supply have raised important questions about the strength of its fundamentals.
When asked how Ethereum currently compares to other Layer-1 (L1) networks amid broader market weakness, Vincent Liu, Chief Investment Officer at Kronos Research, offered his perspective.
“Ethereum’s fundamentals remain strong relative to other Layer 1s, particularly when you consider its total value locked (TVL) of $368.921 billion, which positions it at the top of the leaderboard,” Liu said.
Although Liu acknowledged that Ethereum ranks fifth in 24-hour fees, behind Tron, Solana, HyperLiquid, Bitcoin, and BNB Chain. He emphasized that the network still “demonstrates significant demand and usage.”
Temujin Louie, CEO of Wanchain, shares a similar perspective. While speaking with BeInCrypto, Louie noted:
“Compared to other Layer 1s, fundamentals remain Ethereum’s strength. Unlike many Layer 1s with aggressive inflation as part of their design, Ethereum’s post-merge architecture makes it potentially deflationary. However, the benefits of EIP-1559 depend on on-chain activity. Nevertheless, this is a structural advantage over most competing Layer 1s.”
While increased activity across Layer-2 (L2) solutions and “Ethereum killers” like Solana may have contributed to a decline in user demand on Ethereum itself, Louie believes that the L1 network “remains a leader in decentralization and has a near-unmatched track record that continues to secure its place in the market.”
What About ETH Price?
Even with strong fundamentals, declining activity on Ethereum poses challenges for ETH in the short- to mid-term. Commenting on this, Liu explained that lower network activity generally signals weaker demand for ETH.
At the same time, increased coin issuance on the network undermines Ethereum’s deflationary model, which was designed to support price appreciation.
“This combination could result in bearish price movements,” Liu warned, “especially as investors look to alternative Layer 1s offering better scalability and lower fees.”
Kadan Stadelmann, CTO of Komodo Platform, also highlighted the role of macroeconomic factors:
“If Ethereum experiences an extended decrease in usage, the price could fall considerably depending on how much use drops, especially if the Fed continues its policy of quantitative tightening compared to quantitative easing. Short-term, this could mean price drops down to the $2,000 range. If the trend continues, however, then Ethereum could find itself in a prolonged consolidation period or outright downtrend.”
ETH Eyes $2,000 Breakout Amid Strengthening RSI
ETH currently trades at $1,834, noting a 1% price dip over the past day. Despite the brief pullback, the bullish pressure in the coin’s spot markets continues to strengthen, reflected by the coin’s climbing Relative Strength Index (RSI).
At press time, this momentum indicator is at 57.68. ETH’s RSI readings signal growing bullish conditions. This indicates that the altcoin has room for upward movement if buying pressure increases.
In this scenario, its price could break above $2,027.
Layer-1 (L1) coin Cardano has recorded a 10% gain over the past week, positioning itself for an extended rally.
The altcoin is now trading close to its 20-day Exponential Moving Average (EMA), a key technical level that, if breached, could validate the ongoing rally and open the door to fresh highs.
ADA Approaches Key Breakout Zone Amid Surge in Buying Pressure
ADA currently trades near its 20-day EMA and is poised to climb above it. This key moving average measures an asset’s average price over the past 20 trading days, giving more weight to recent prices.
When an asset is about to rally above its 20-day EMA, it signals a shift in short-term momentum from bearish to bullish. This crossover signals that ADA buying pressure is increasing and confirms that the asset has entered an upward trend.
ADA’s successful break above the 20-day EMA would signal renewed momentum and act as a dynamic support level for the coin’s price, giving buyers more control.
On-chain metrics further support the bullish outlook. According to Santiment, ADA’s Network Realized Profit/Loss (NPL) has turned negative, indicating that most holders are currently at a loss.
Historically, this discourages selling pressure as traders are less willing to part with their assets at a loss. This behavior encourages longer holding periods, which in turn tightens supply and can drive up ADA’s price in the short term.
Cardano Bulls in Control
On the ADA/USD one-day chart, the coin’s positive Chaikin Money Flow (CMF) reinforces this bullish outlook. At press time, this indicator, which measures how money flows into and out of an asset, is at 0.04.
A positive CMF reading like this indicates that buying pressure outweighs selling pressure. It reflects strong capital inflows into ADA, suggesting that its investors are accumulating rather than offloading their positions. ADA could extend its rally and climb to $0.70 if this trend persists.