Trading does grant excitement to earning money but functioning into a universe where errors could be costly. The learning curve might get steep, irrespective of choosing between trading stocks and futures or diving headfirst into the heads and tails fast-lane world of day trading. In reality, without proper guidance, you end up making crippling mistakes that will set you back in finances. Here comes the entry of a trading mentorship. A mentor will assist you in staying away from such errors and instruct you in the currently relevant methods and skills that will give you the upper hand. The process is all about knowing trading psychology and managing risk as much as it is about examining charts and making quick choices. Good mentoring can help you develop these abilities and steer clear of the pitfalls that usually surprise novice traders. How to Find the Right Mentor Trading mainly appeals because… Read More at Coingape.com
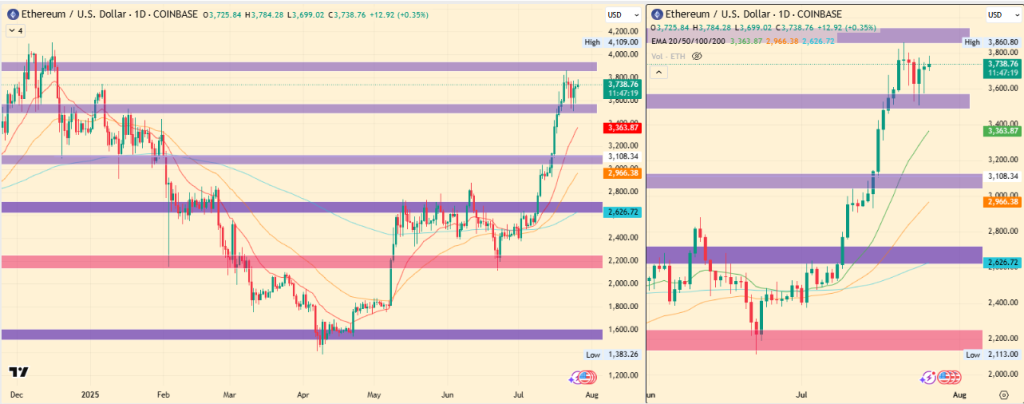
The Ethereum price is exchanging hands at $3740 with 24-hour volume of $32.74 billion, it has displayed wonderful gains since June’ last week to till now gaining nearly 75% gains.
This happened as institutional interest in Ethereum crypto has hit a significant milestone this July. The major push is received with rapidly gaining ETF inflows and whale accumulation, this is fueling optimism for a broader breakout in the Ethereum price ahead.
ETF Inflows Trigger Surge in Ethereum Price Sentiment
The Ethereum price saw renewed upward momentum on July 25th, and gained 6%. This gains are closely tied to a record-breaking surge in spot ETF inflows over the month and on 25th too.
According to on-chain analyst Ted Pillows, Ethereum ETFs registered a net inflow of $452.8 million on a single day, out of which BlackRock’s ETHA accounted for $440.1 million, with the remainder attributed to Fidelity’s FETH.
These figures are displaying a very extraordinary difference from the early July numbers, where daily inflows remained under $100 million. However, since July 9th, this trend reversed dramatically, revealing a multifold jump in institutional buys.
Whale Activity Spikes as Institutional Momentum Builds
Supporting this ongoing ETH bullish wave, the analyst Ali Martinez also highlighted a rise in large Ethereum holders, based on Glassnode’s data tracking “mega whale addresses” holding more than 10,000 ETH.
170 new whales holding over 10,000 Ethereum $ETH have joined the network in the past month. This is a strong sign of growing institutional interest! pic.twitter.com/q06HrHx9iE
He mentioned on X that, since July 9th, over 170 new whale addresses have been added to the network. This is firmly suggesting that much of the ETF inflow is translating directly into long-term accumulation and large entities are positioning themselves for a long-term move.
Moreover, Ted Pillows further remarked that on-chain volume has surged by 288% over the past three weeks, reaching a staggering $10.38 billion. According to him, the Ethereum price rally has only just begun, he bets that the real breakout still lies ahead and will be visibly louder once it manifests.
Ethereum Price Chart Faces Multi-Year Trendline Test
Zooming out to the Ethereum price chart on a weekly timeframe, a critical technical development is underway.
As noted by another analyst, he revealed that the Ethereum price is attempting to break a 3.7-year long descending trendline. If Ethereum manages to give a weekly close, it would likely shoot a sustained upward trajectory.
This optimism aligns with the broader Ethereum price analysis today, where market optimism is backed not just by inflows, but also by strong technical setups and a supportive macro environment.
Therefore, with the Ethereum price currently holding near the key breakout areas, several traders are starting to make bold forecasts. Among them, analyst Rekt Fencer anticipates a parabolic rally where he targets toward $10,000 by the end of 2025.
The post Ethereum Price Gains 75%: What’s Fueling the Rally? appeared first on Coinpedia Fintech News
The Ethereum price is exchanging hands at $3740 with 24-hour volume of $32.74 billion, it has displayed wonderful gains since June’ last week to till now gaining nearly 75% gains. This happened as institutional interest in Ethereum crypto has hit a significant milestone this July. The major push is received with rapidly gaining ETF inflows …
Bonk (BONK), the popular Solana-based meme coin, is on the verge of a massive price crash. This bearish outlook emerges during a period when major cryptocurrencies are experiencing massive sell-offs and price crashes.
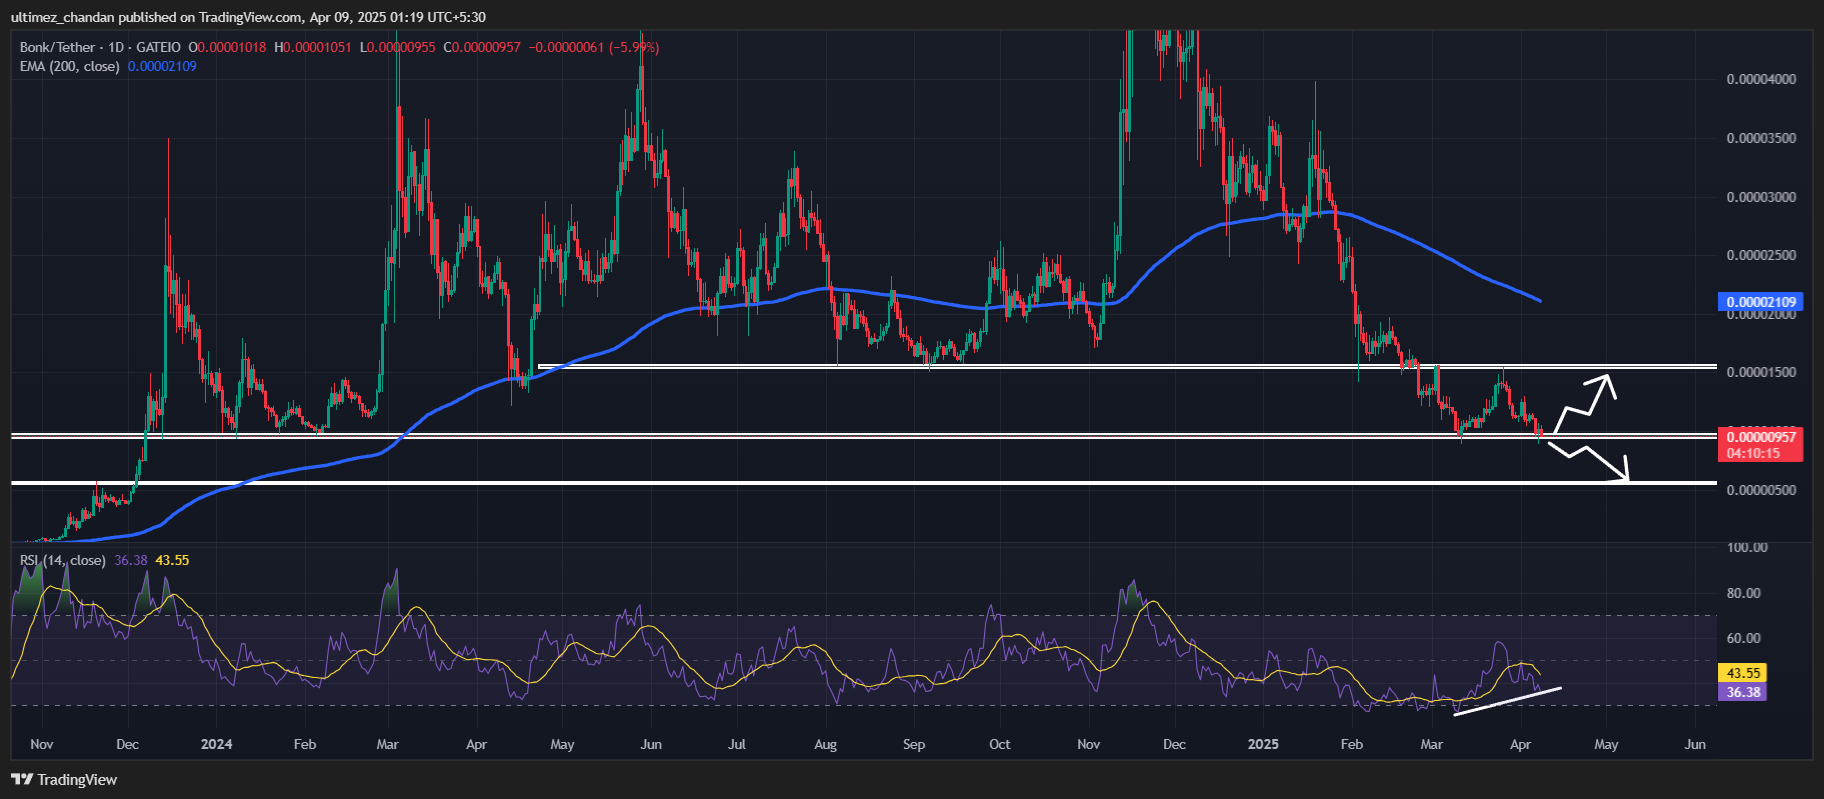
BONK Technical Analysis and Upcoming Level
According to expert technical analysis, BONK appears bullish but is currently at a make-or-break level of $0.0000095. The daily chart shows multiple bullish signals, such as bullish divergence and the formation of a bullish double-bottom price action pattern.
Source: Trading View
However, the ongoing market sentiment and downward momentum in major assets like Bitcoin (BTC) and Ethereum (ETH) seem to be influencing other cryptocurrencies, especially those with a small market cap like BONK.
Based on recent price action and historical momentum, this key level has consistently acted as strong support. Since December 2023, BONK has experienced multiple upward moves after bouncing from this level. Meanwhile, experts and traders are also expecting a similar move in the meme coin.
However, given the current unfavorable market sentiment, BONK’s bullish outlook appears to be challenging.
The daily chart reveals that if BONK fails to hold this level and closes a daily candle below $0.0000088, it could drop by 38% to reach the next support at $0.0000055 in the future. However, if the meme coin holds this level, there is also a possibility that history will repeat and BONK will once again see an upside rally.
BONK Price and Volume Drop
At press time, BONK is trading near $0.000009677 and has recorded a price decline of over 5.50% in the past 24 hours. Meanwhile, during the same period, its trading volume dropped by 55%, indicating lower participation from traders and investors, potentially due to the current market sentiment.
Traders Lean Bearish on BONK
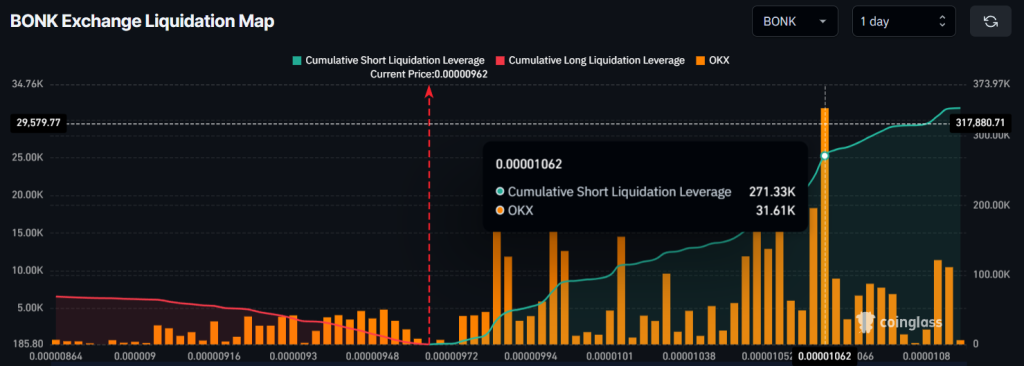
Given the strong bearish market and downward momentum in BONK, traders seem to be dominating the asset by heavily betting on the bearish side, as reported by the on-chain analytics firm Coinglass.
Data reveals that traders are over-leveraged at $0.0000095 on the lower side (support), where only $11.30K worth of long positions have been built. In contrast, $0.00001062 is another over-leveraged level on the upper side (resistance), where traders have built $271.30K worth of short positions.
Source: Coinglass
Examining this on-chain metric, it appears that short sellers are currently dominating, with minimal interest in going long on BONK. This could easily push the meme coin lower and lead to a breach of its support level.
The post BONK Could Face 40% Decline, Despite Bullish Divergence Signal appeared first on Coinpedia Fintech News
Bonk (BONK), the popular Solana-based meme coin, is on the verge of a massive price crash. This bearish outlook emerges during a period when major cryptocurrencies are experiencing massive sell-offs and price crashes. BONK Technical Analysis and Upcoming Level According to expert technical analysis, BONK appears bullish but is currently at a make-or-break level of …
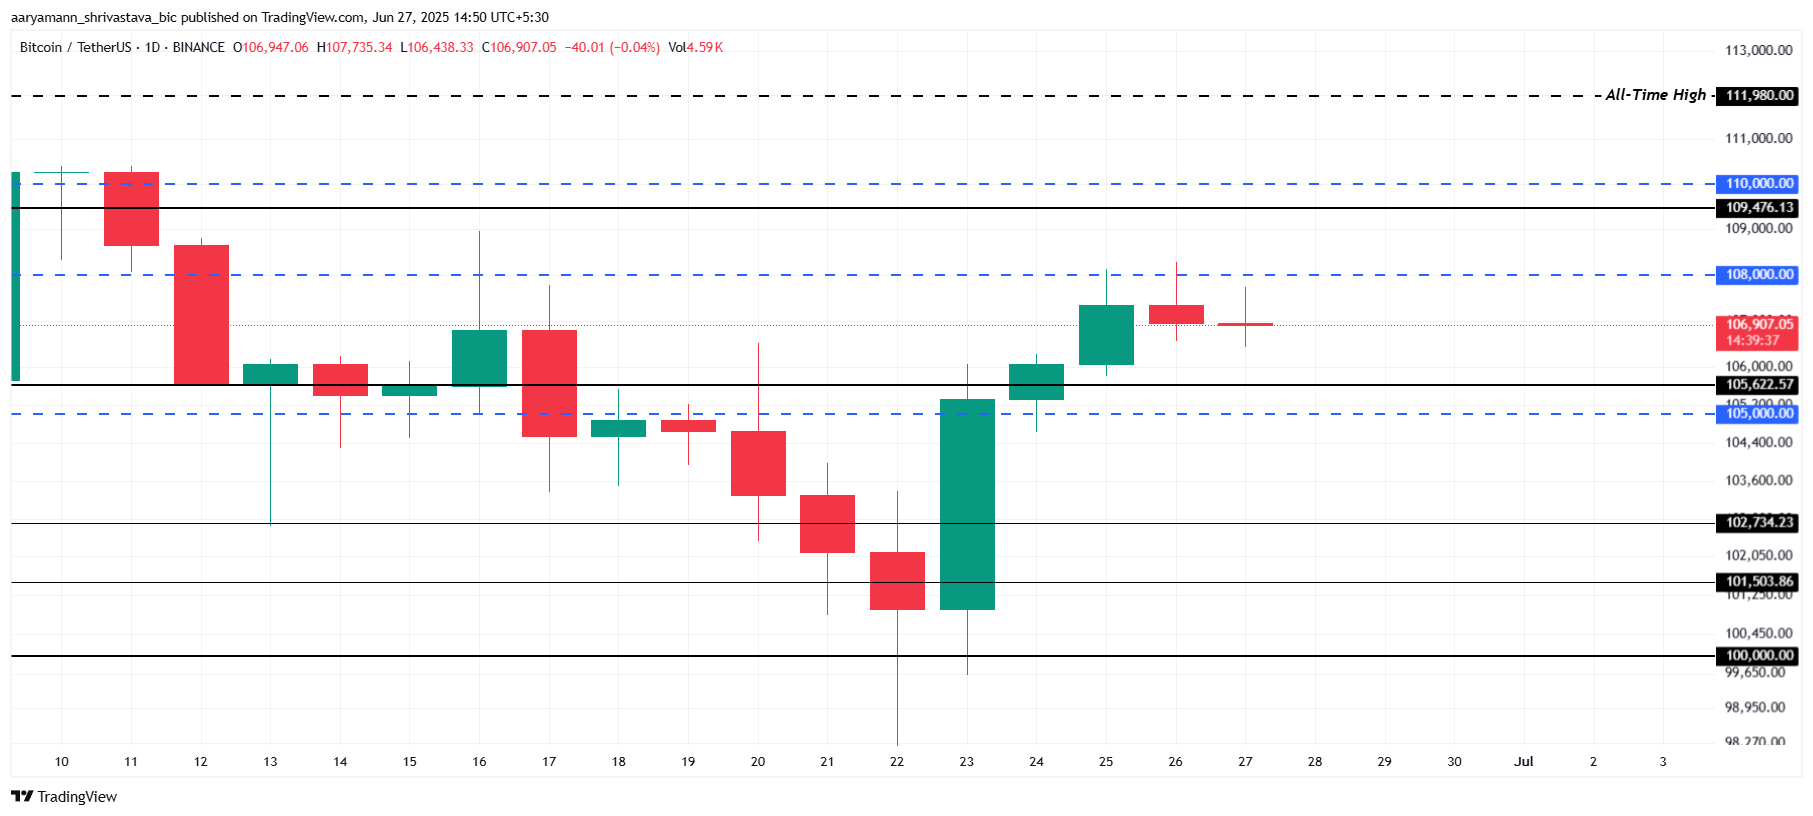
Bitcoin’s price has recently rebounded, bringing it close to the critical $108,000 level. While this recovery offers hope, the key resistance remains unclaimed as support.
Adding to concerns is a noticeable shift in investor behavior, signaling market fatigue, which could be setting the stage for a price decline below $100,000.
Bitcoin Profit Taking Slows Down
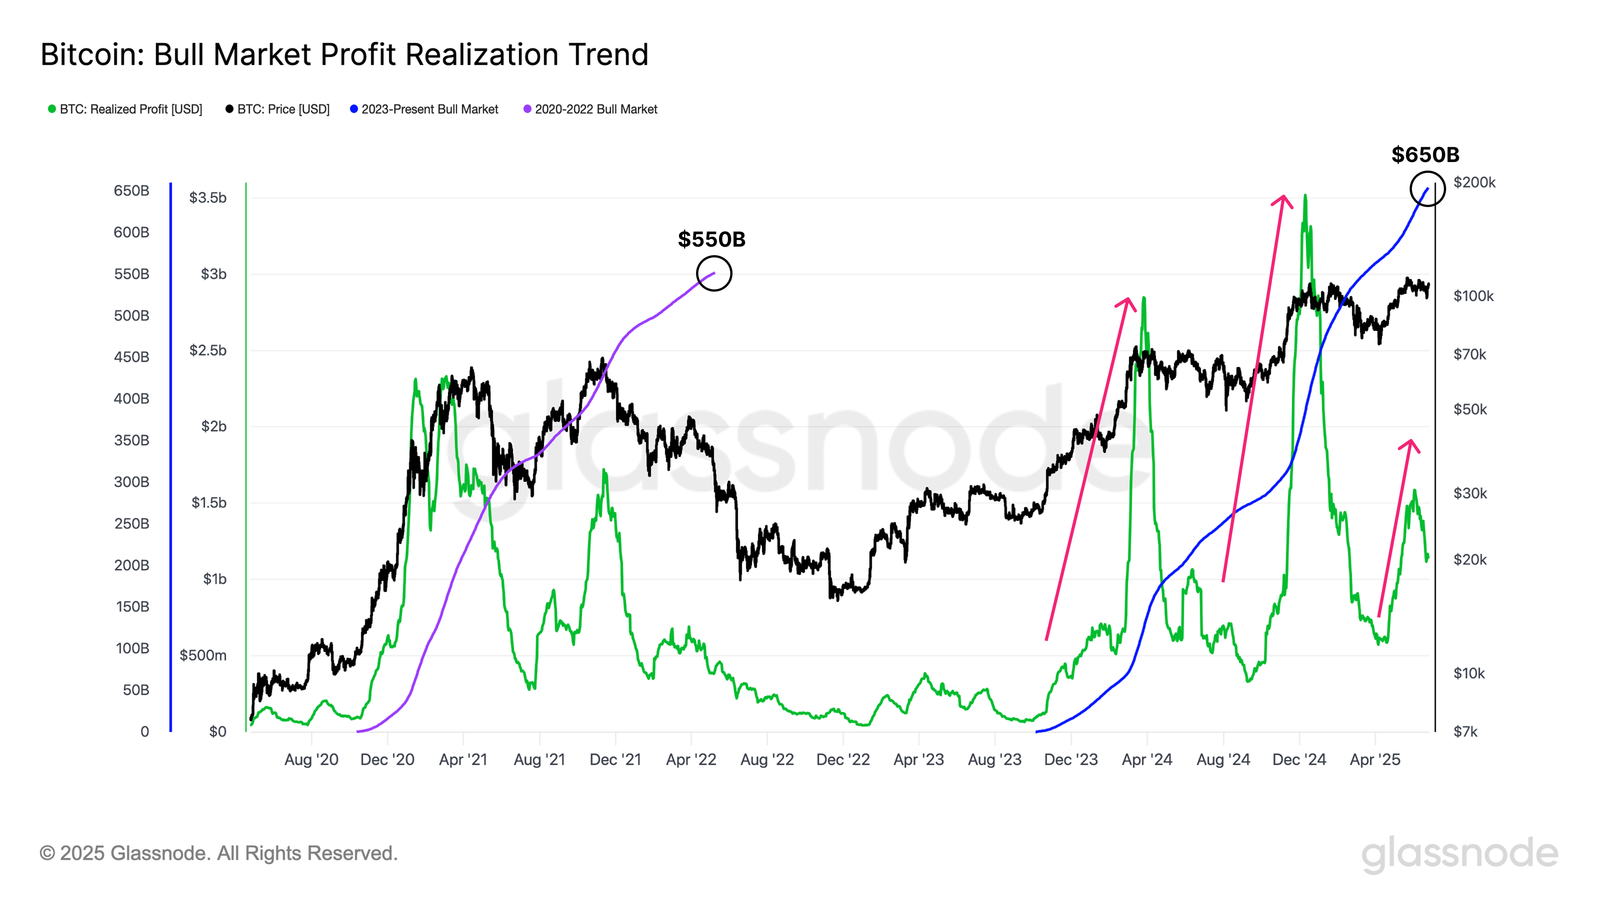
In the previous market cycle (2020–2022), Bitcoin investors realized a total of approximately $550 billion in profit during multiple rallies, including two major waves. Fast forward to the current cycle, and realized profits have already exceeded $650 billion, surpassing the previous cycle’s total. This indicates that, while large gains have been made, the market may be entering a cooling phase.
The latest data suggests that profit-taking has peaked, with the market now in a cool-down period after the third major wave of profit realization. Although gains have been secured, the momentum driving Bitcoin’s upward movement appears to be waning. As realized profitability tapers off, investor sentiment shifts, leading to reduced buying pressure.
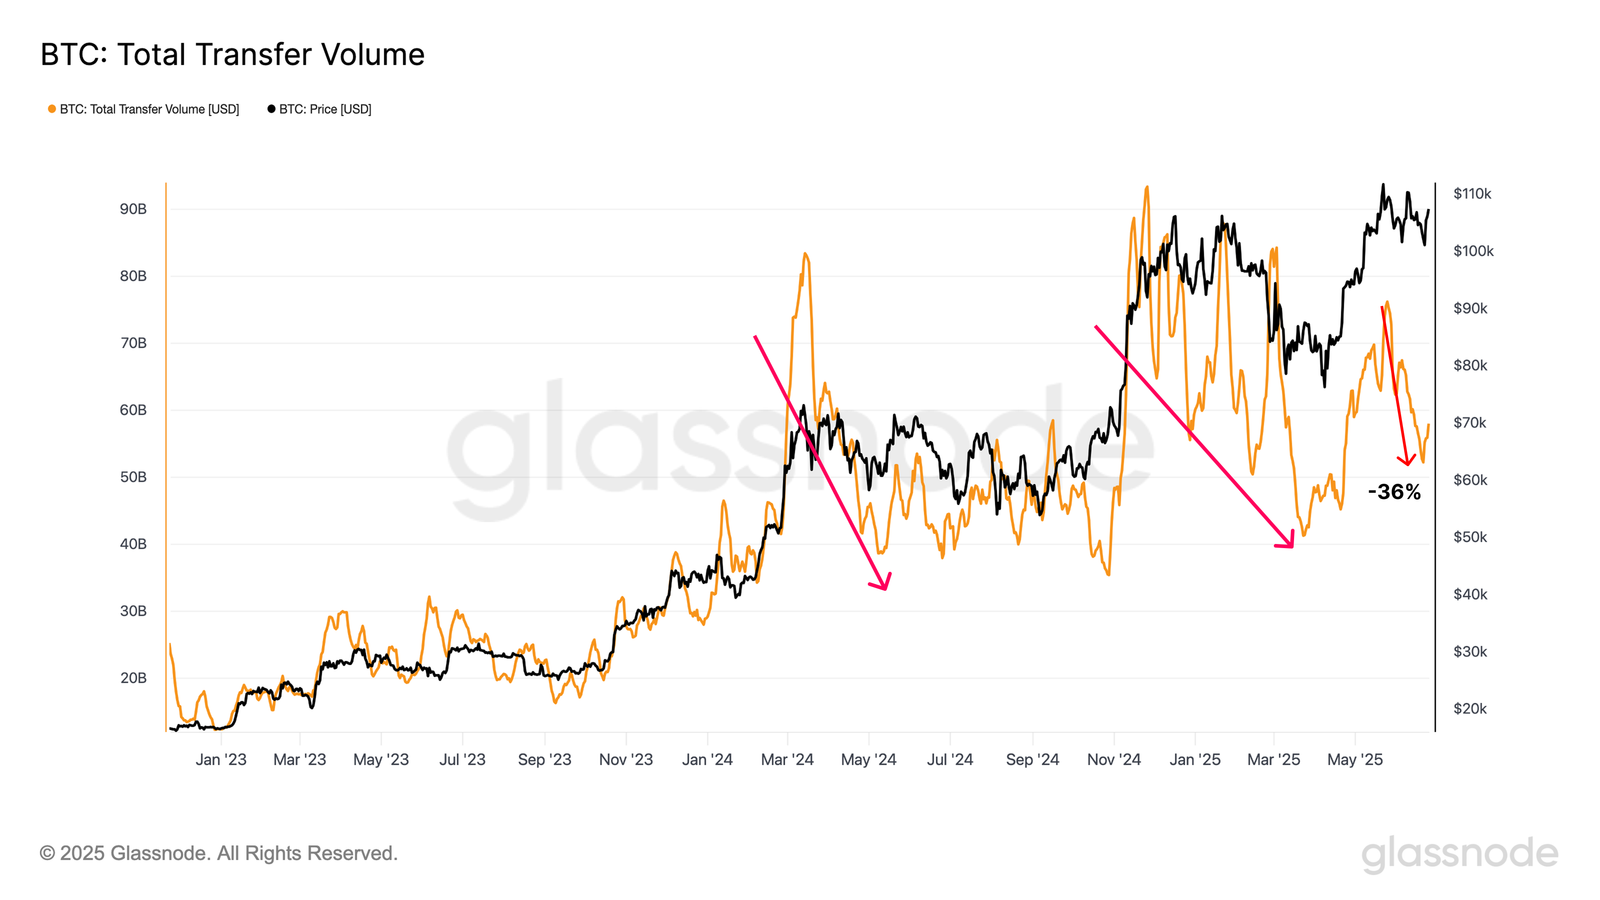
Bitcoin’s total transfer volume has also shown signs of cooling. The 7-day moving average of on-chain transfer volume has dropped by approximately 32%, falling from a peak of $76 billion in late May to $52 billion over the past weekend. This decline is consistent with the broader pattern of market cooling, signaling that Bitcoin’s bullish momentum may be losing steam.
The slowdown in transfer volume reflects a general loss of activity across key Bitcoin metrics, reinforcing the notion that market participants are taking a cautious approach. As the market eases, Bitcoin’s price could face downward pressure.
Bitcoin’s price is currently at $106,907, just below the $108,000 resistance. For BTC to continue its upward trend, it must flip $108,000 into support. This would set the stage for further gains, pushing Bitcoin towards the $110,000 mark and potentially beyond. However, the current market sentiment remains fragile.
Given the rising signs of market fatigue and the cooling of key activity metrics, a decline is more likely in the near term. If demand does not revive, Bitcoin’s price could fall below $105,000 and test the critical $100,000 support level. Any further loss in momentum may trigger a deeper decline.
Alternatively, if Bitcoin’s price manages to hold above key support levels, the bullish trend remains intact. Successfully reclaiming $108,000 as support would clear the path for Bitcoin to rise to $110,000. A break above this level could lead to a move towards the all-time high of $111,980, maintaining the upward momentum and investor optimism.