SUI-VARA:- In the second and most recent instance, the leading blockchain Sui has signed a partnership with Dubai’s regulatory body Virtual Assets Regulatory Authority (VARA). As part of the partnership, the web3 accelerator of Sui, the SuiHub will work in collaboration with VARA to accelerate the growth of virtual assets in the region. Interestingly, this
Ethereum (ETH) shows signs of strength and caution after a sharp 49% rally in the past week. While its market cap has returned above $300 billion and EMA indicators remain bullish, momentum indicators are starting to cool.
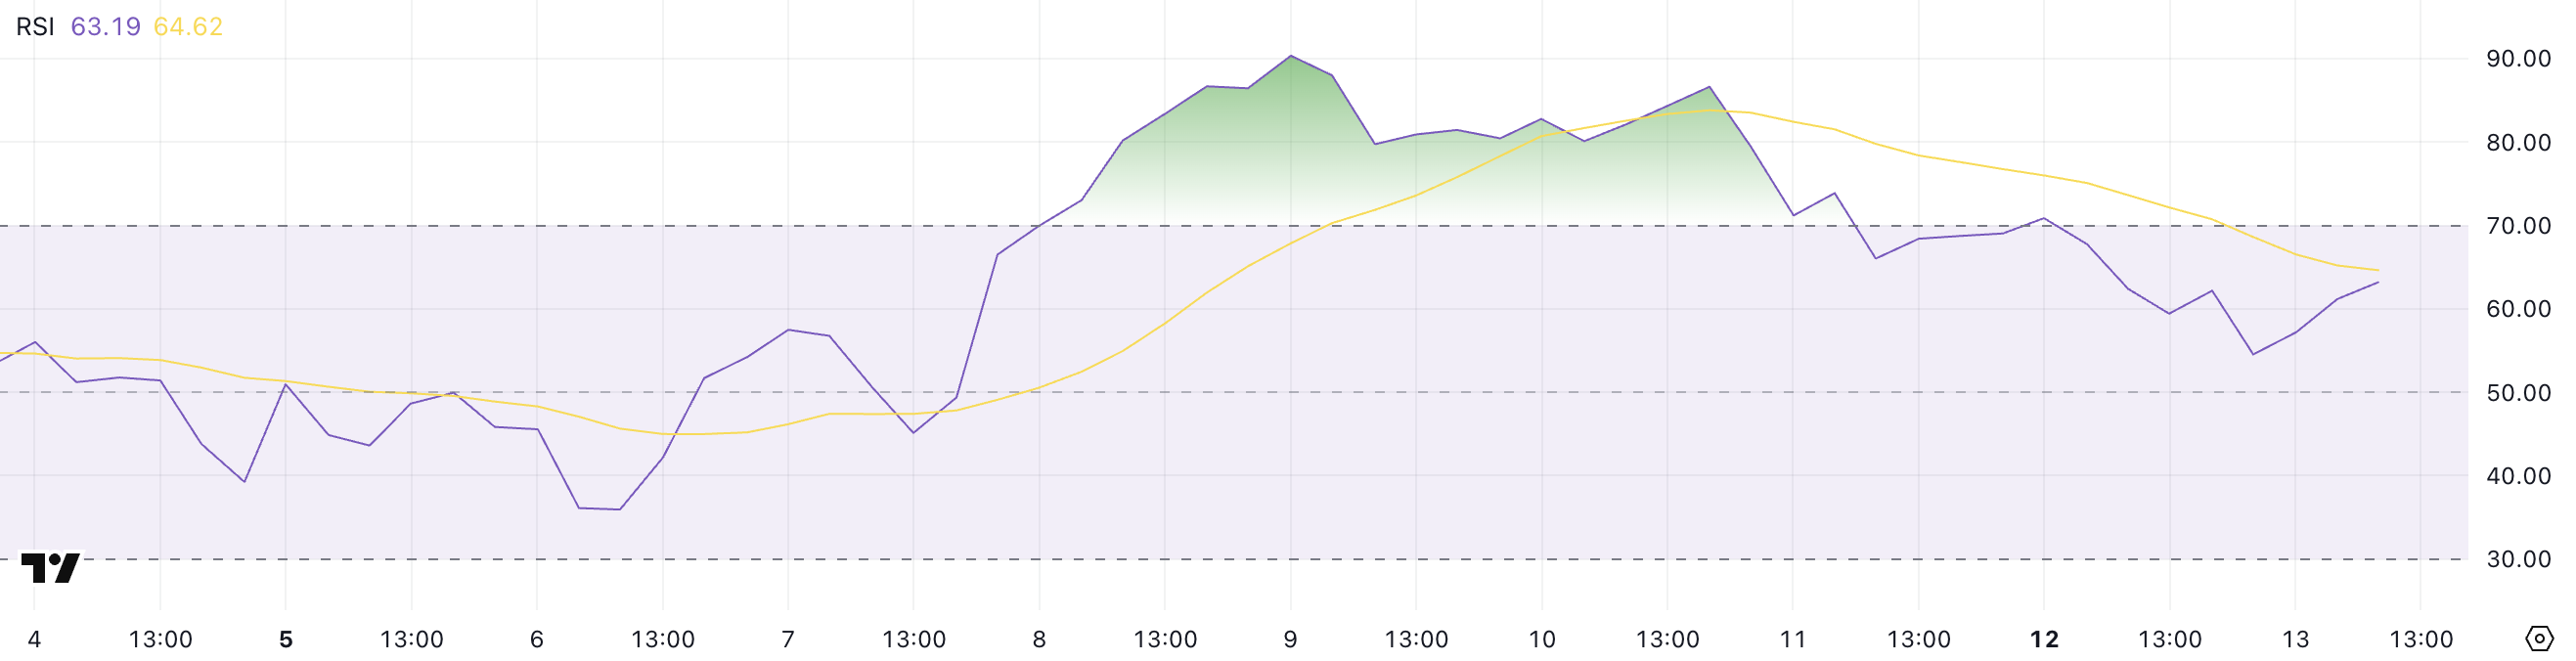
The ADX has dropped from 61 to 47.99, and RSI has fallen from 86 to 63, suggesting the uptrend may be losing steam. However, buyers are still active, and if ETH breaks above key resistance, the next leg higher could take it past $3,000.
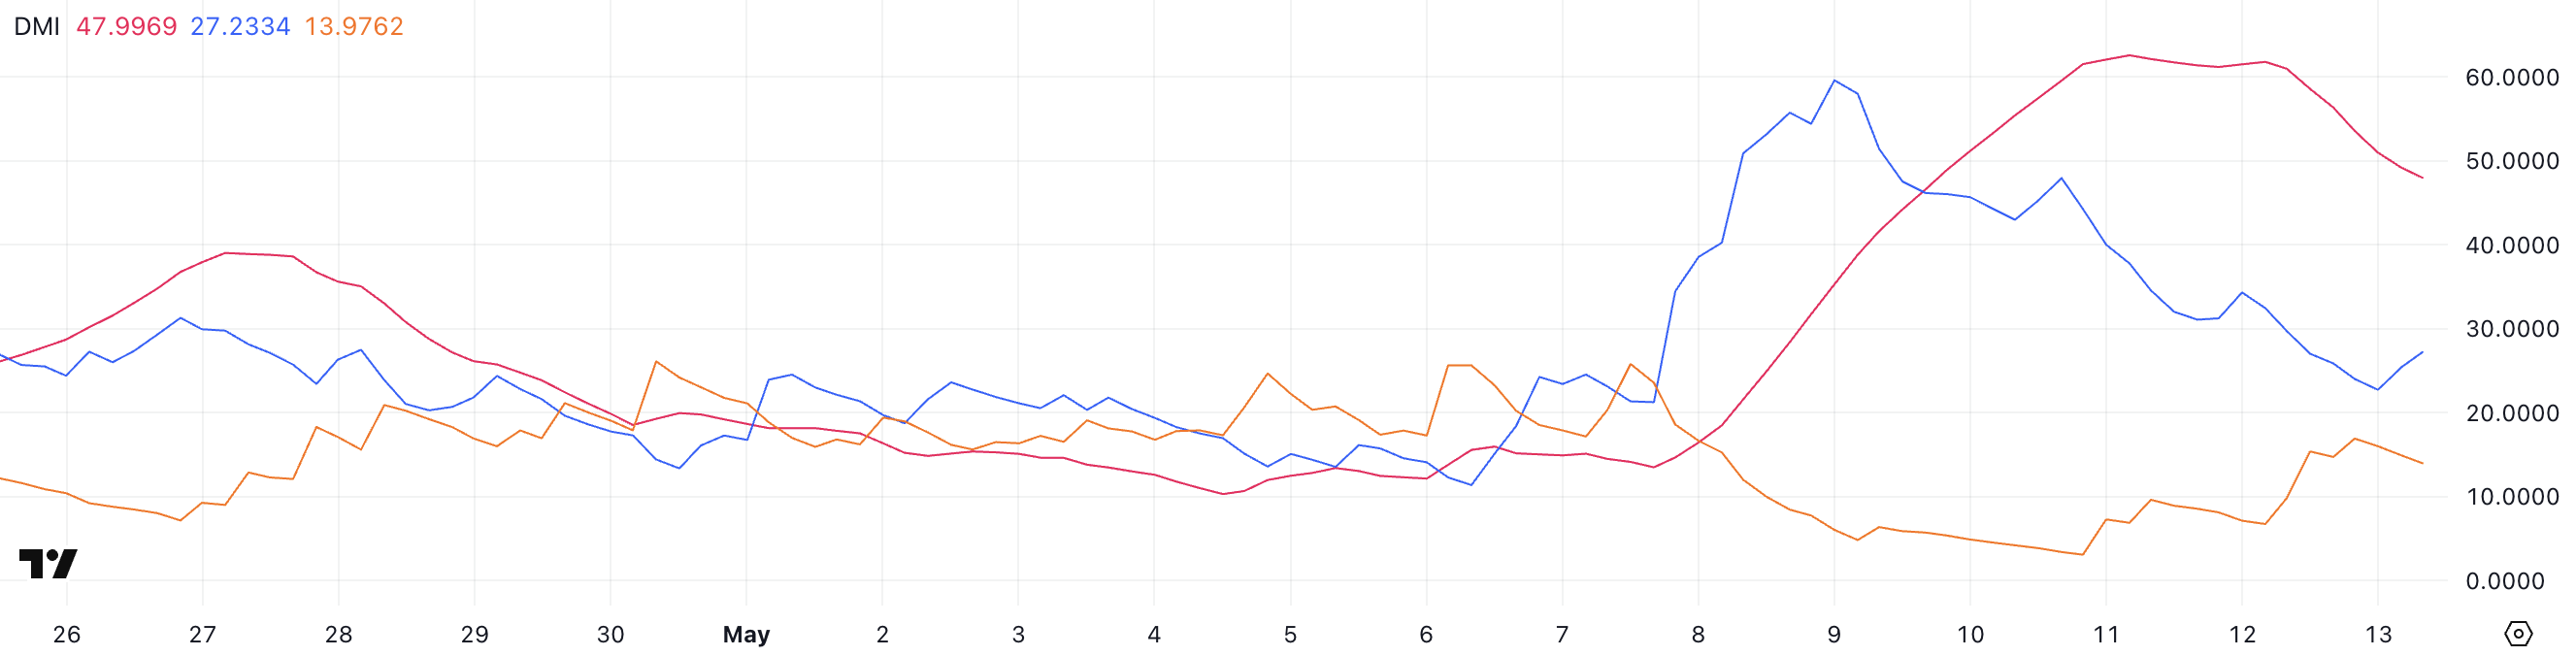
ETH DMI Signals Cooling Rally and Rising Bearish Pressure
Ethereum’s DMI indicator shows that its ADX has dropped from 61 to 47.99, signaling a weakening trend strength.
The ADX (Average Directional Index) measures the intensity of a trend, with values above 25 indicating a strong trend and above 40 suggesting very strong momentum.
The +DI line has fallen sharply from 47.96 to 27.2, showing that bullish momentum has cooled significantly.
Meanwhile, the -DI line has climbed from 3.39 to 13.97, suggesting that bearish pressure is starting to rise.
While the trend still favors the bulls, the gap between +DI and -DI is narrowing, and if this continues, Ethereum could face a short-term pullback or enter a consolidation phase. However, in the last hours +DI went up and -DI went down, suggesting ETH buyers are trying to maintain their control.
Ethereum RSI Cools From Overbought Zone but Remains Bullish
Ethereum’s RSI has dropped to 63 from a high of 86 three days ago, after holding above the overbought threshold of 70 for three straight days.
Interestingly, despite the recent dip, RSI has bounced from 54 just a few hours ago, suggesting some renewed buying interest in the short term.
RSI (Relative Strength Index) is a momentum indicator that ranges from 0 to 100. Readings above 70 typically indicate overbought conditions and potential for a pullback, while readings below 30 suggest oversold conditions and a possible bounce. Values between 50 and 70 generally point to moderate bullish momentum.
At 63, Ethereum’s RSI shows that the asset has cooled off from recent overbought levels but still maintains underlying bullish strength. This could mean the market is resetting after a strong rally, allowing room for another leg up if buying continues.
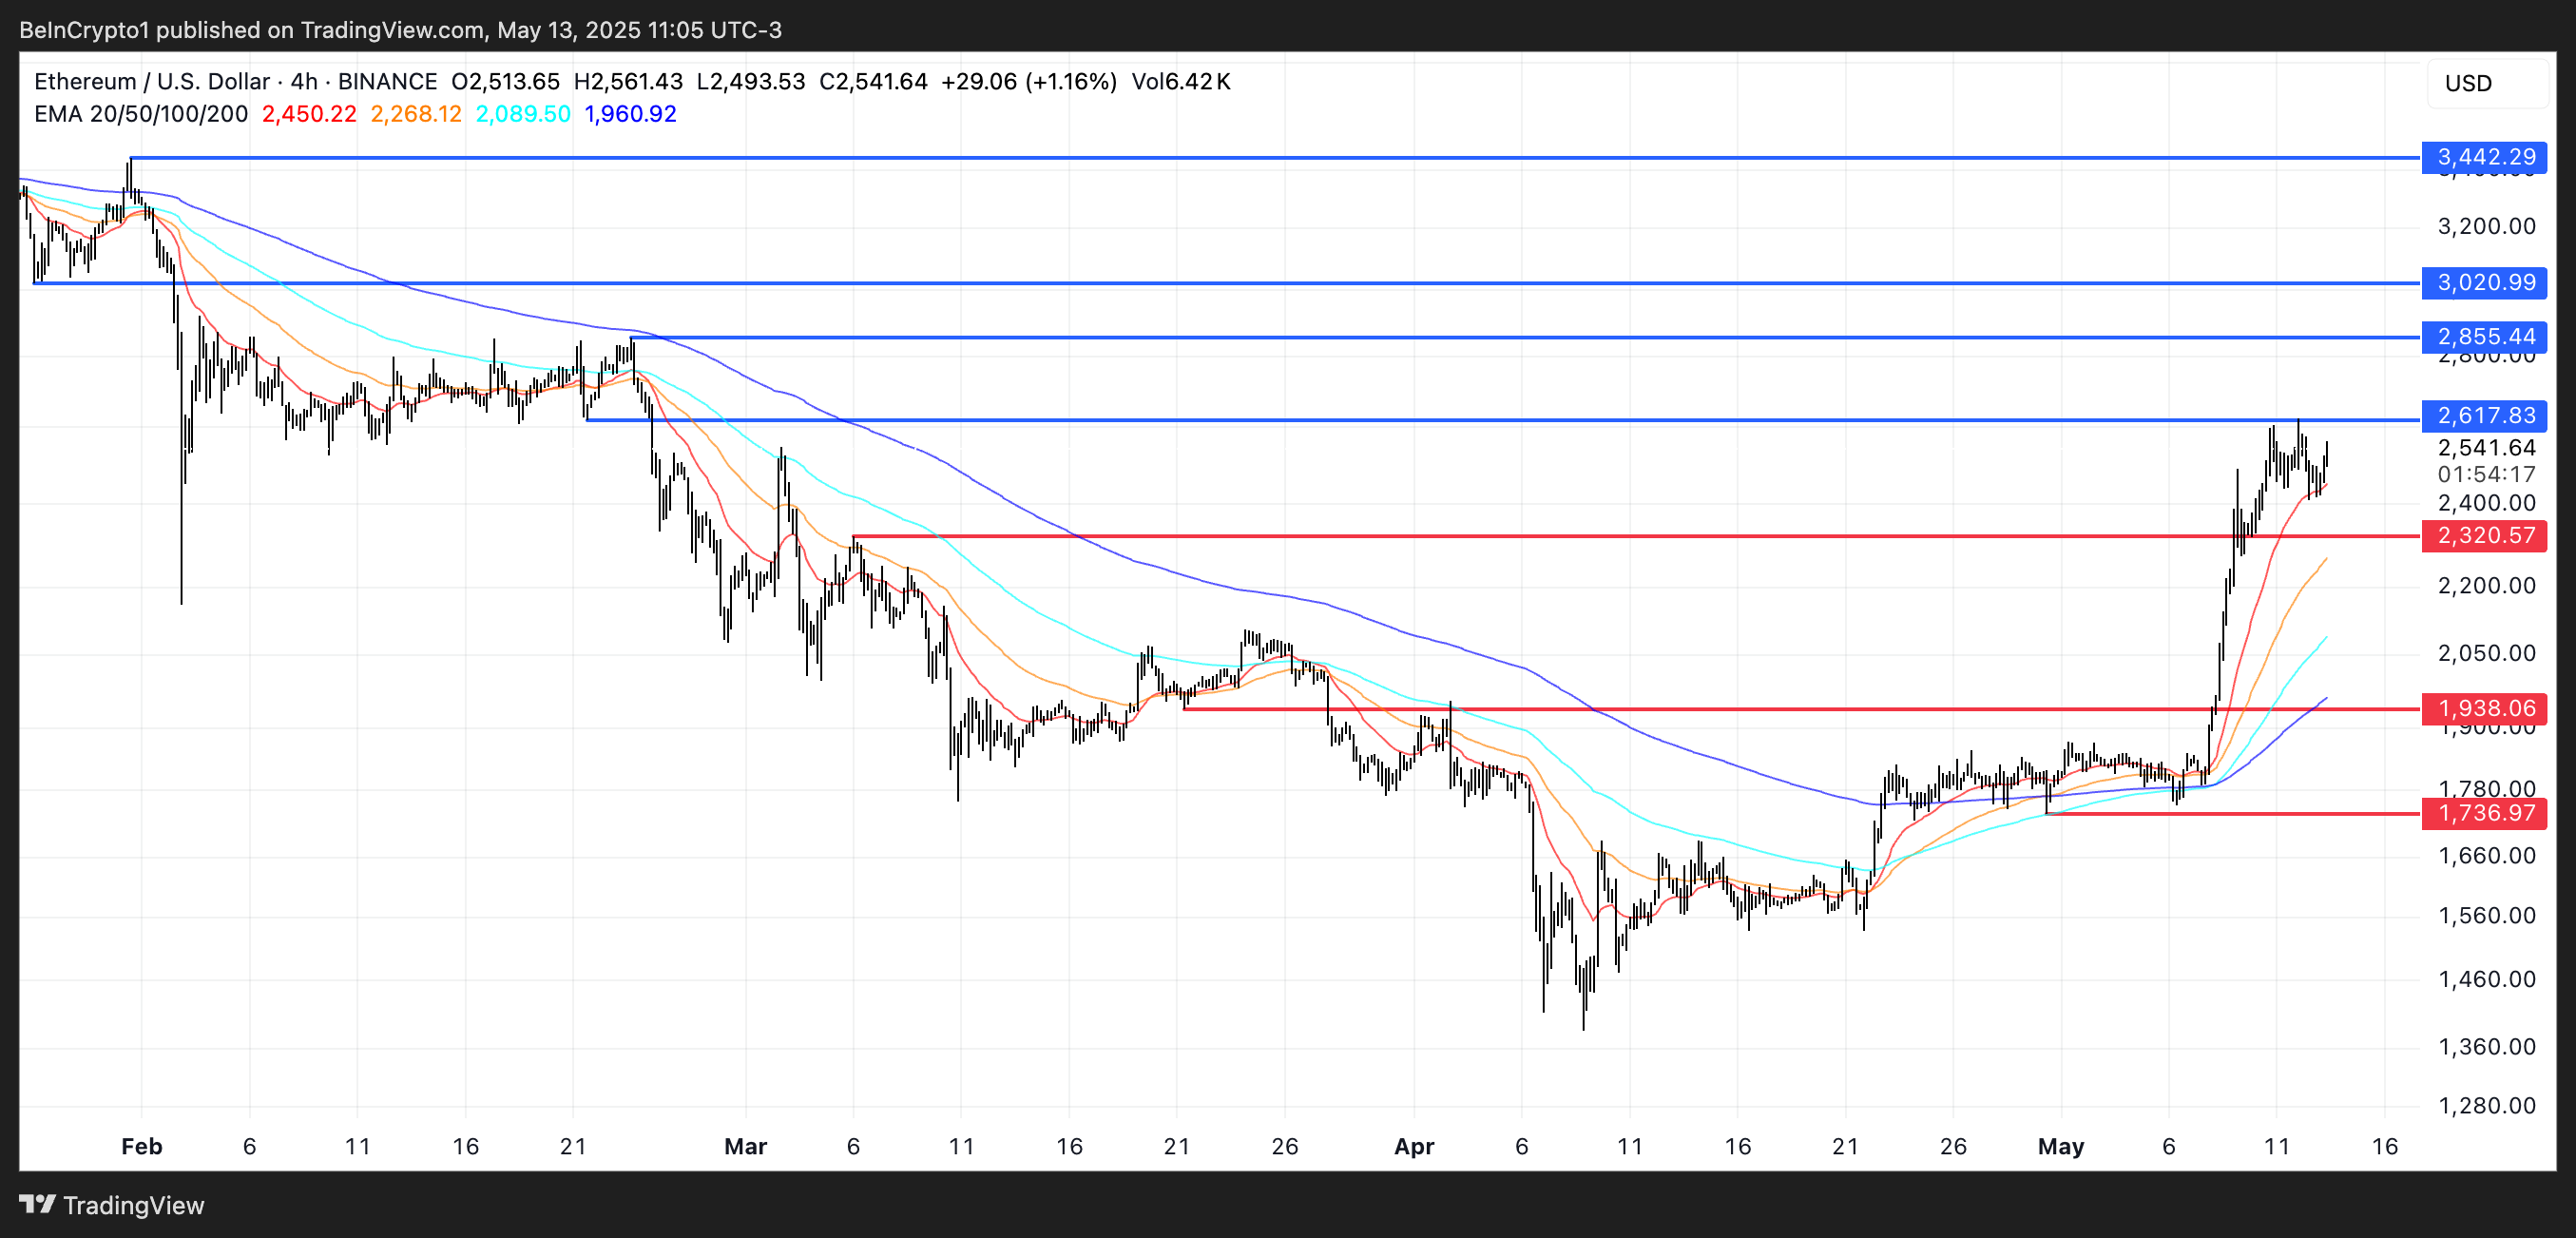
Ethereum Eyes $3,000 After 43% Weekly Surge, But Key Resistance Holds
Ethereum price is up 43.5% over the past seven days, with its market cap climbing back above $300 billion. Its EMA lines continue to show a strong bullish structure, reinforcing the current uptrend.
However, ETH recently tested the $2,617 resistance and failed to break through.
A successful breakout above that level could open the path toward $2,855 and even $3,000 for the first time since early February, with a possible extension to $3,442 if momentum accelerates.
On the downside, the $2,320 support is key. If ETH tests and loses that level, the price could slide to $1,938. A stronger bearish move might push it further down to $1,736.
BitMEX co-founder and former CEO Arthur Hayes provided a bold price forecast for Hyperliquid’s HYPE token, revealing it could flip Solana’s price performance. He outlined his prediction on X, where he claimed his ‘degen’ target this bull season was for HYPE to flip SOL and become among the top ten largest cryptocurrencies by market capitalization. Solana Price Performance Faces Headwinds as Expert Eyes HYPE as Emerging Leader Solana (SOL) price performance could be flipped by Hyperliquid’s HYPE token if the SOL token fails to breach the $180 level, a critical resistance level that has been blocking it for the second consecutive week. Should this scenario unfold, Solana could drop to $140 – $150 level. A scenario that could make way for the HYPE token to outshine Solana by price performance. Particularly if the Hyperliquid token achieves Arthur Hayes’ projected target of $100. Hayes made two bold predictions regarding HYPE, the… Read More at Coingape.com
The new trading week is off to a bullish start, and some altcoins are already standing out with impressive momentum.
While the broader market cooled off last week, a few assets weathered the pullback and have continued to post notable gains. This has positioned them for potential continuation rallies in the days ahead.
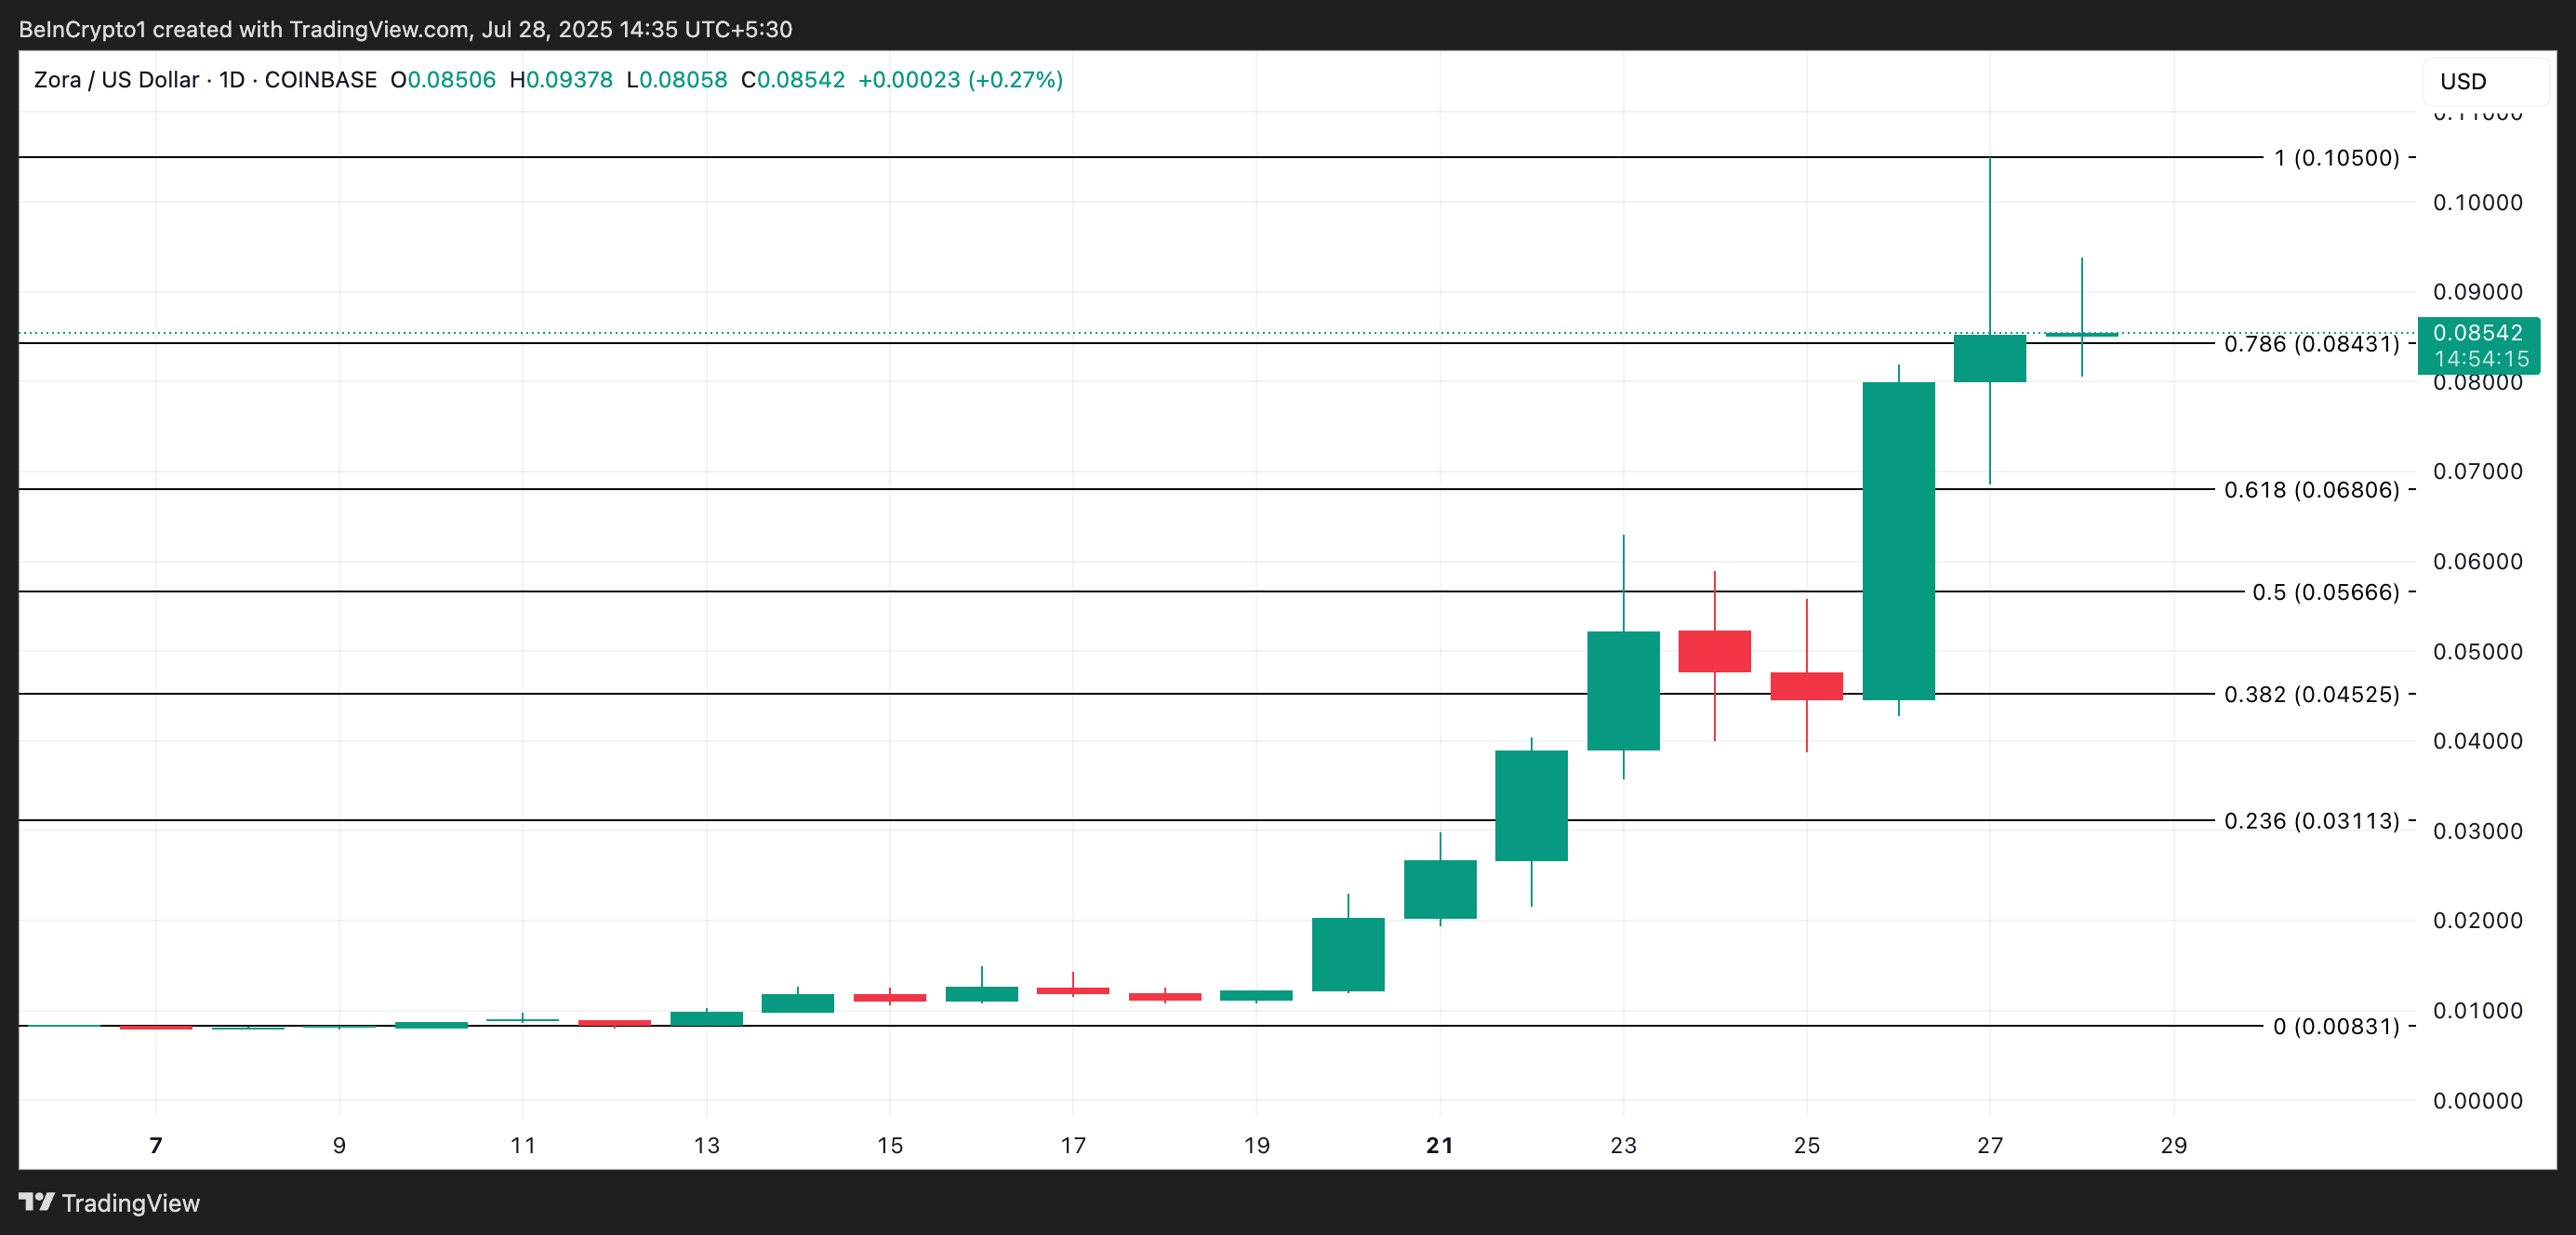
ZORA
ZORA, the native token of the Zora Protocol, is one of the altcoins to watch this week. Per Coingecko, its value has rocketed by 325% to trade at $0.085 at press time.
Moreso, the altcoin briefly traded at an all-time high of $0.105 during yesterday’s intraday trading session. While it has since witnessed a 20% correction from this price high, ZORA is still up 8% over the past day.
During this period, its trading volume has surged to $500 million, marking a 12% increase. This uptick confirms that the rally is supported by growing investor demand and active participation in the market.
When both price and trading volume rise together, it is seen as a sign of a healthy, demand-driven rally. It means buyers are stepping in with conviction.
This combination validates ZORA’s uptrend and hints at a likely revisit of the all-time high at $0.105.
However, a push back from the bears could trigger a break below $0.084 and a fall to $0.068.
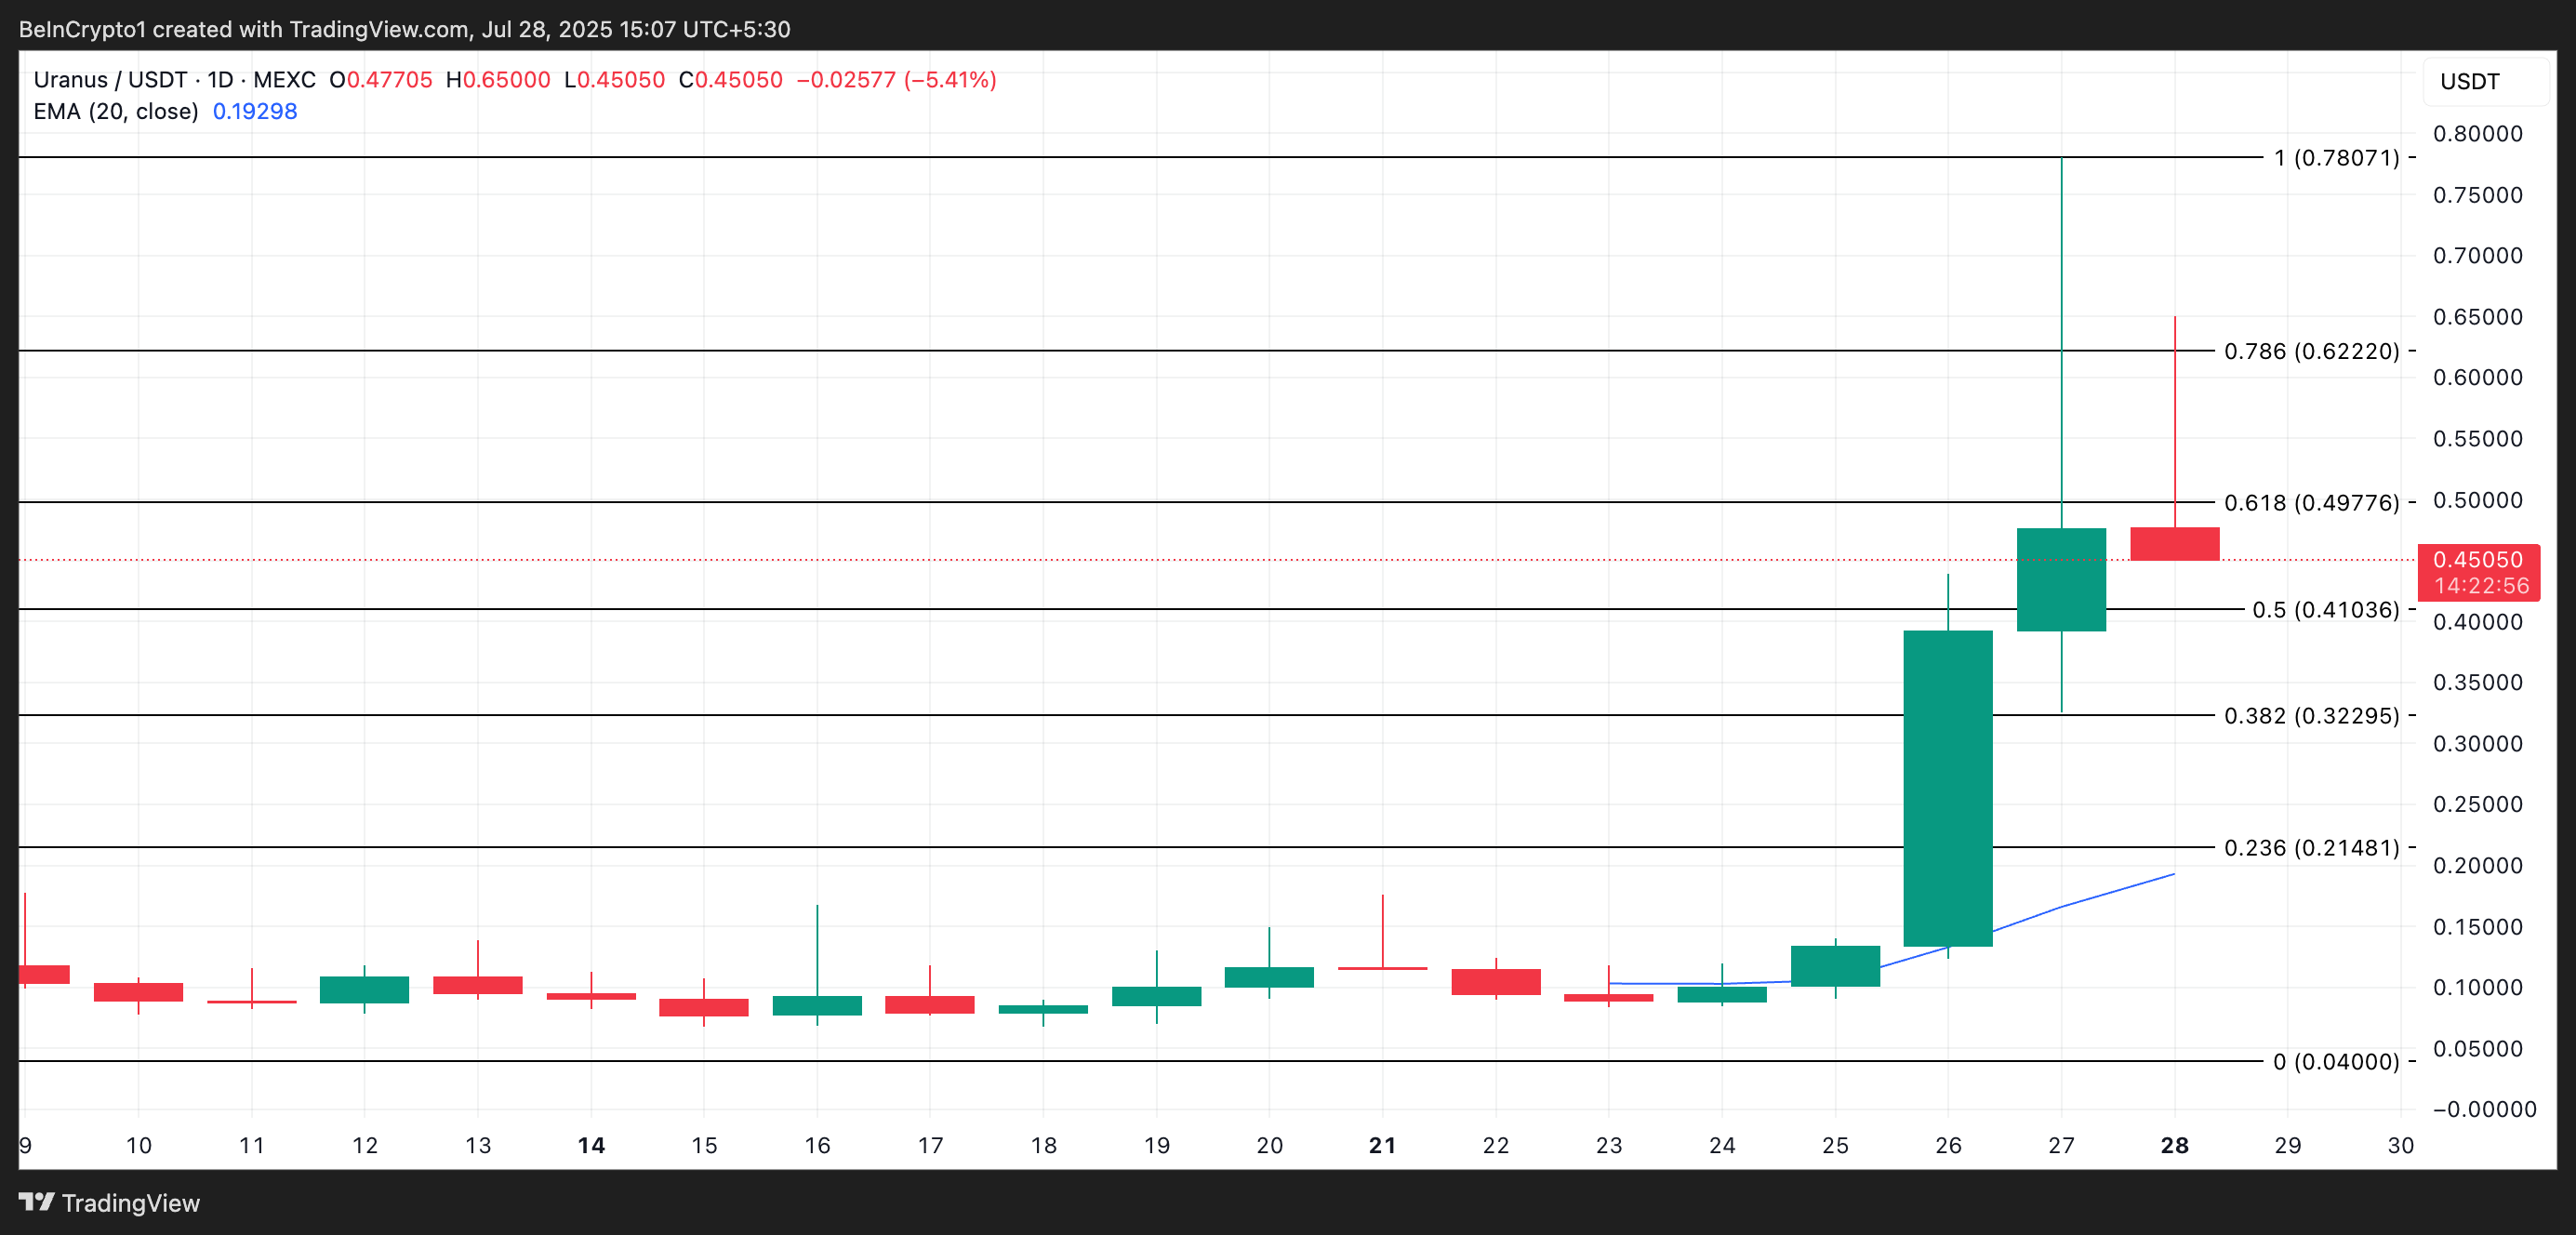
URANUS
Solana-based meme coin URANUS is another top gainer on Coingecko to watch this week. Trading at $0.47 at press time, the altcoin has seen its value rise 235% in the past seven days.
Readings from the URANUS/USD one-day chart show the token’s price resting significantly above its 20-day exponential moving average (EMA), reflecting the buy-side pressure. As of this writing, URANUS’ 20-day EMA forms dynamic support below its price at $0.192.
This key moving average measures the asset’s average price over the past 20 trading days, giving more weight to recent price changes.
When an asset’s price trades above its 20-day EMA, it signals short-term bullish momentum. This trend suggests URANUS’ recent price action is strong and that its buyers are currently in control.
If they retain control, the token could extend its gains and climb above $0.497.
Conversely, if selloffs commence, the token could fall to $0.410.
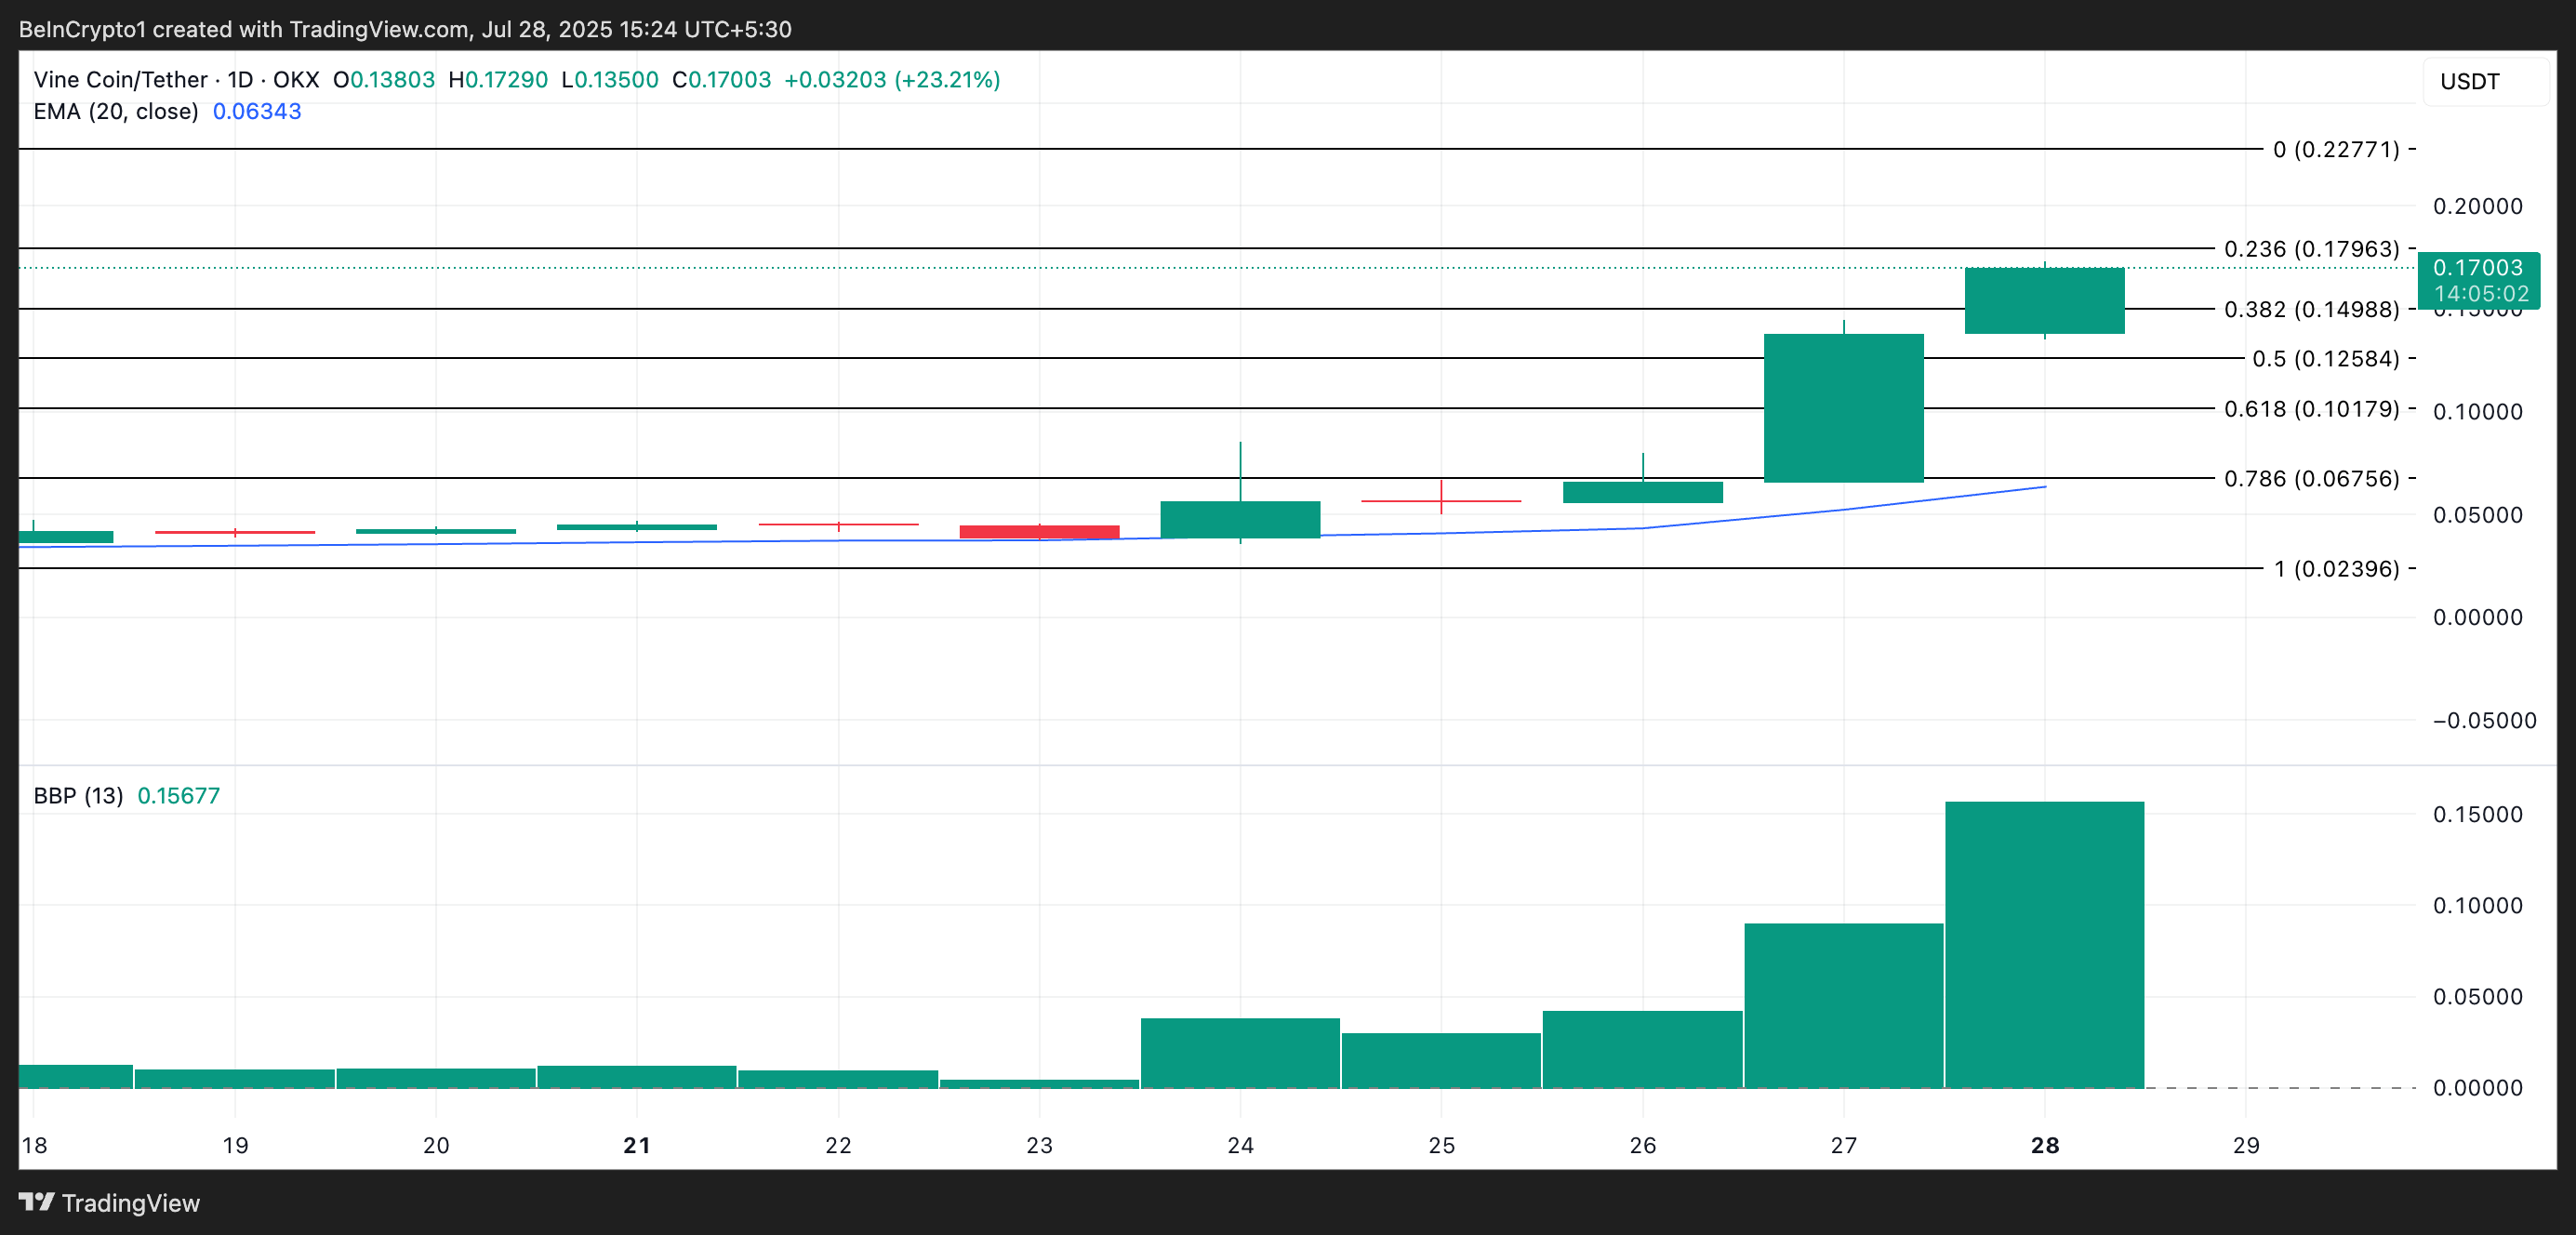
VINE
VINE, a meme coin inspired by the defunct Vine video app, is up 267% over the past week, making it one of Coingecko’s top gainers to watch this week.
An assessment of the token’s Elder-Ray Index highlights the climbing buy-side pressure in the VINE spot markets. Over the past five days, this momentum indicator—which measures buying and selling pressures—has returned only green histogram bars, whose sizes have grown with each trading session.
This consistent uptick in buy-side strength suggests that bullish momentum around VINE is increasing. The expanding green bars indicate that buyers are steadily overpowering sellers, strengthening the recent rally and hinting at continued upside if demand holds.