Layer-1 (L1) coin IP has emerged as the market’s top gainer today, defying the broader crypto downturn to post a 4% increase in the last 24 hours.
However, despite the price surge, warning signs are flashing under the surface. On-chain activity remains muted, suggesting the rally may not be backed by strong fundamentals.
Traders Bet Against PI Despite Price Rise
While most cryptocurrencies traded lower on the day, PI has bucked the trend to record gains. However, the rally may not last long, with on-chain metrics signaling growing skepticism among traders.
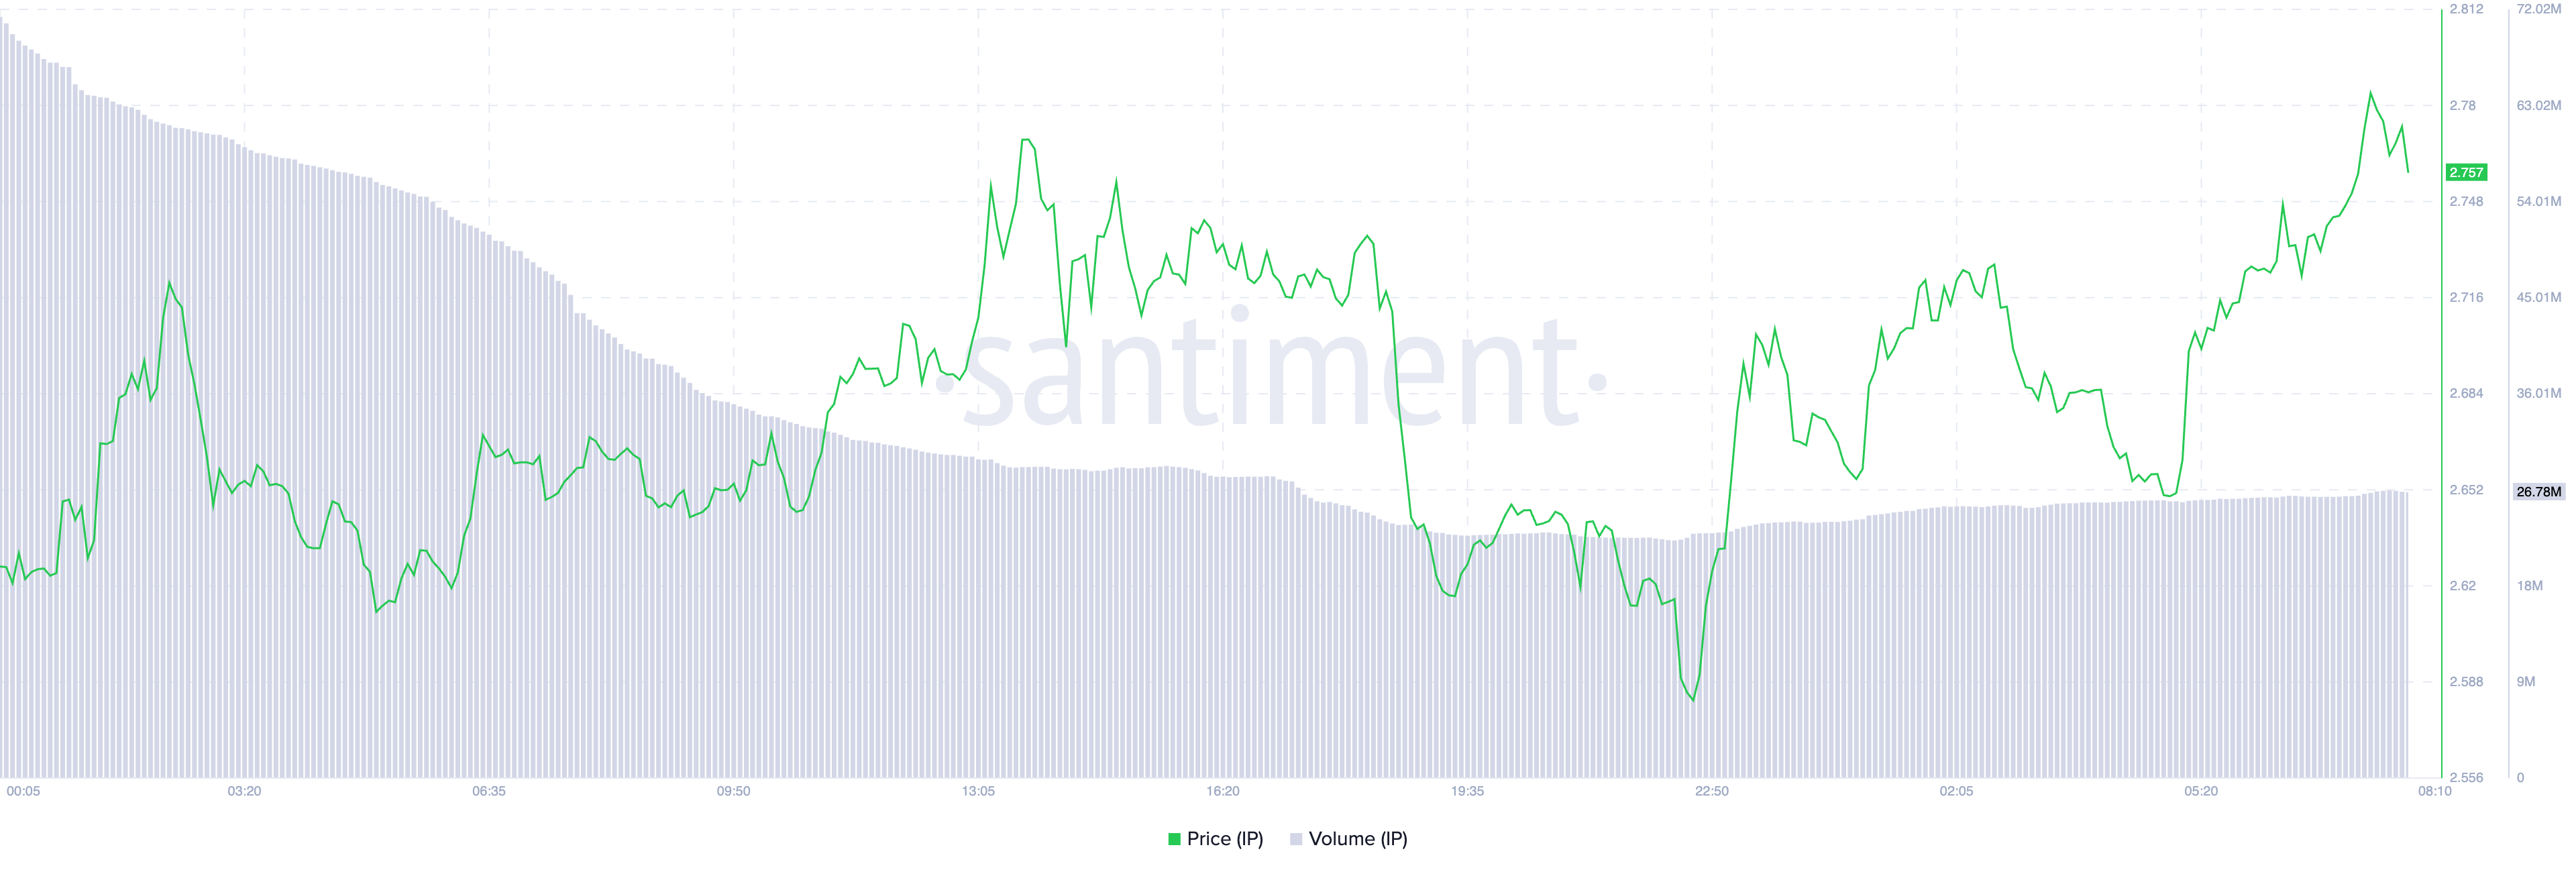
For example, amid its 4% rally over the past day, IP’s daily trading volume has dipped 38%, indicating that fewer participants support the upward price move.
When an asset’s price rises while its trading volume falls, it suggests that fewer participants are driving the price movement. This indicates weak buying momentum or a lack of broad market support behind the IP price rally.
Such conditions make the coin’s rally unsustainable, increasing the risk of a reversal or pullback.
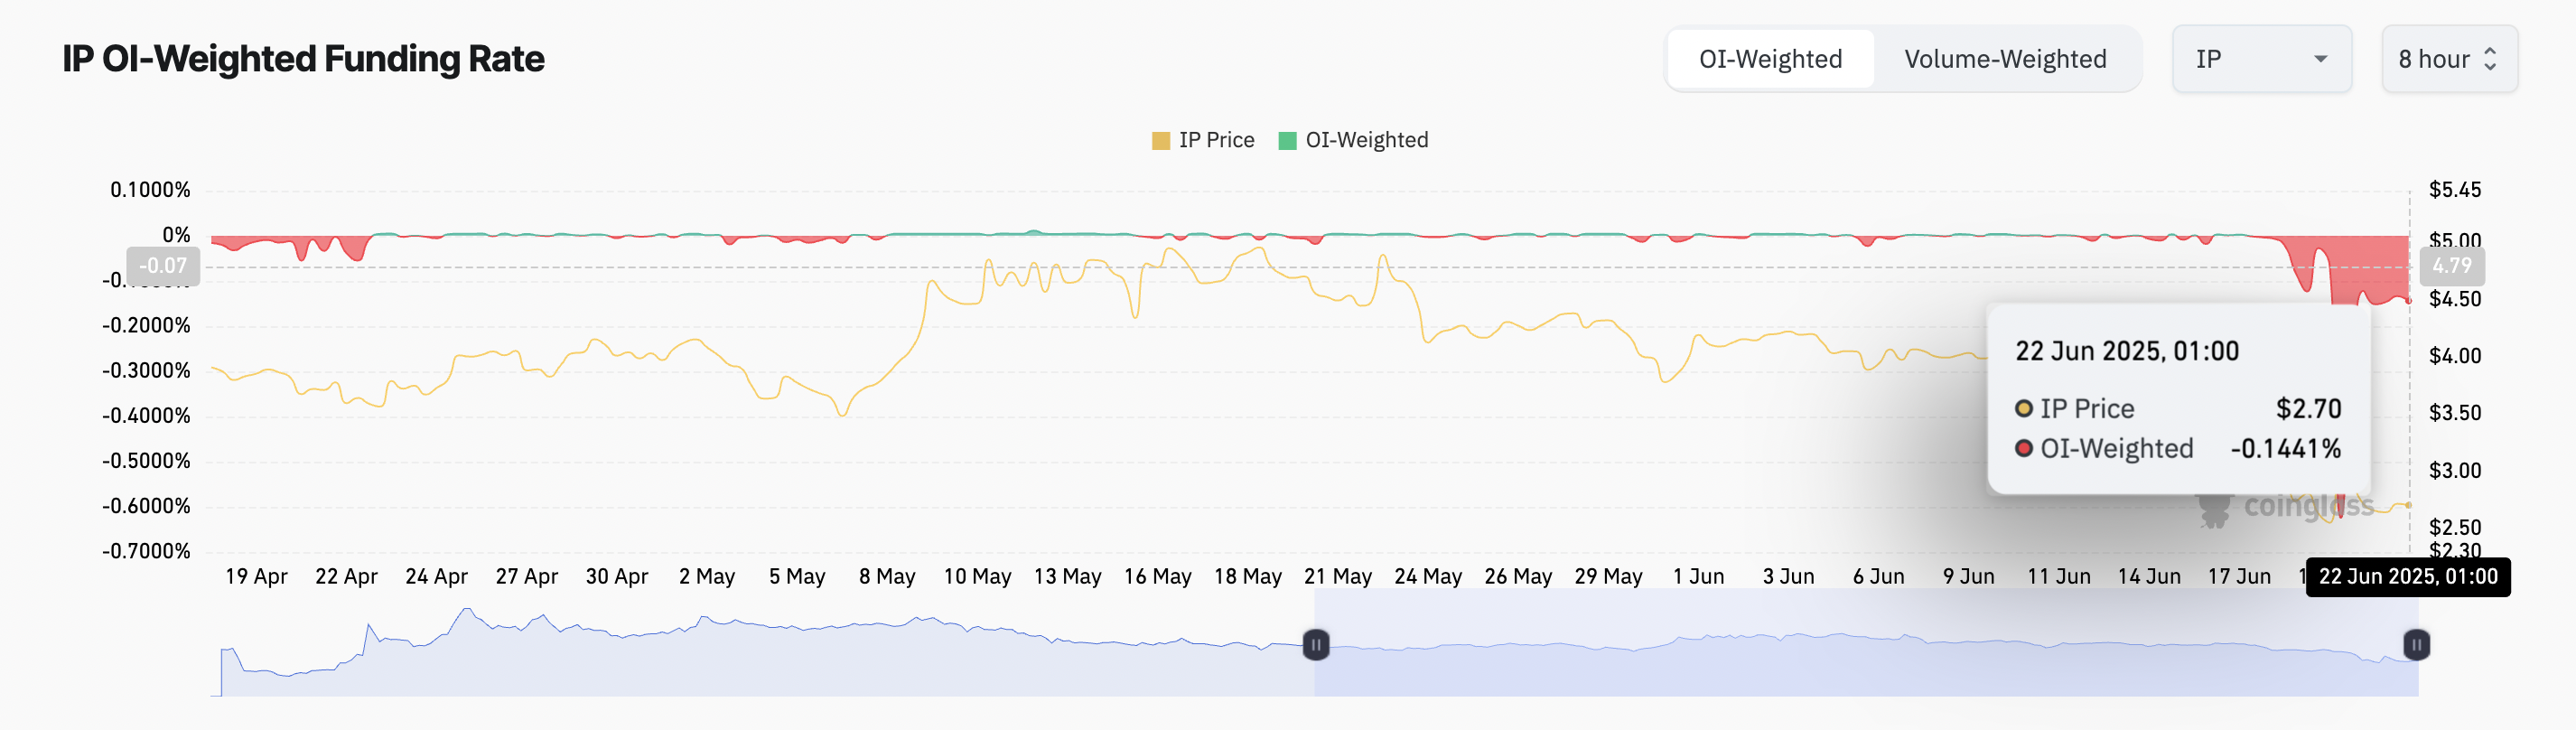
Furthermore, IP’s funding rate remains negative, reflecting that many traders in the futures market are taking short positions—betting that the price will fall. As of this writing, this stands at -0.14%.
The funding rate is a periodic fee paid between traders in perpetual futures markets to keep contract prices aligned with the spot price. When the funding rate is negative, short traders are paying long traders, indicating that the majority of the market is betting on a price decline.
In IP’s case, the negative funding rate indicates that many traders anticipate a reversal of its recent price rally. This reflects the persistent bearish pressure that has kept the coin’s performance subdued over the past several weeks.
Can IP Rebound? Token Eyes $3.17 If Demand Returns
As of this writing, IP trades at $2.75, hovering above a key support level at $1.59. If demand weakens, IP risks plunge below this floor and potentially fall under the $1 mark.
However, a resurgence in new demand for the altcoin could invalidate this bearish outlook. In that scenario, IP’s price may rebound toward $3.17. A successful break above that resistance could propel the IP token price toward the $4.41 level.
Real-World Assets (RWA) are becoming one of the most closely watched narratives in crypto as the sector evolves under increased institutional and regulatory scrutiny. The collapse of MANTRA served as a wake-up call, exposing operational vulnerabilities and sparking demands for higher standards across tokenization platforms.
While skepticism grows around decentralized RWA projects, the broader investment case for asset-backed tokens remains intact—especially as stablecoins and tokenized treasuries lead adoption efforts. Against this backdrop, several RWA altcoins are standing out in May 2025, showing both technical momentum and renewed investor interest.
Stablecoins and Treasuries Lead RWA Adoption Wave
The collapse of Mantra has triggered a wave of reflection and caution across the Real World Asset (RWA) sector. As Andrei Grachev, Managing Partner of DWF Labs, puts it:
“The Mantra collapse is really a pivotal moment for the RWA sector. It has exposed some serious vulnerabilities in how these permissionless tokenisation platforms operate. I think we’re going to see investors getting much more cautious and selective about where they put their money now. Institutional players will probably start demanding much higher standards of due diligence, and regulators might step in with more scrutiny too.”
This event has clearly shaken confidence in the structure of some decentralized RWA models, pushing institutional and retail participants toward more regulated, vetted alternatives.
At the same time, the debate around RWA tokens’ potential to decouple from broader crypto market volatility is gaining momentum.
In response to Binance Research’s observation that RWA tokens have shown more stability than Bitcoin during tariff events, Edwin Mata, Co-founder & CEO of Brickken, said:
“True RWA tokens are backed by real-world value and governed by legal frameworks that enforce rights, obligations, and cash flows. In that sense, they behave more like traditional securities and can, over time, become more resilient to macro-level crypto volatility, especially during periods of market stress, regulatory shifts, or geopolitical shocks like tariffs.”
Shahaf bar Geffen, CEO and Founder of COTI, reinforced this emerging divergence by stating:
“We‘re already witnessing the early stages of that decoupling. RWA tokens are anchored to tangible assets—real estate, commodities, invoices—which inherently provide a stability layer absent in purely speculative cryptocurrencies. The potential for RWAs to hedge against macroeconomic volatility, such as tariffs or inflationary pressures, is significant.”
The macroeconomic case is strengthening, but the technological and institutional backing behind RWAs is also evolving quickly. Kadan Stadelmann, Chief Technology Officer at Komodo Platform, believes institutional adoption will be a decisive factor:
“The adoption by mainstream financial institutions will separate RWAs from the rest of the crypto index. No other crypto product will be as extensively adopted by mainstream finance as RWAs other than stablecoins, which I would argue are a type of RWA.”
Here are the top 3 RWA coins to watch in May.
Ondo (ONDO)
ONDO has climbed nearly 14% over the past 30 days, recently breaking above the $1 mark for the first time since March 6. This move has brought renewed attention to the token, as its market cap approaches the $3 billion threshold again.
However, this upward price action comes amid a broader contraction in the space. According to data from rwa.xyz, total RWA on-chain value currently sits at $16.6 billion, representing a 16.92% decline over the past 30 days.
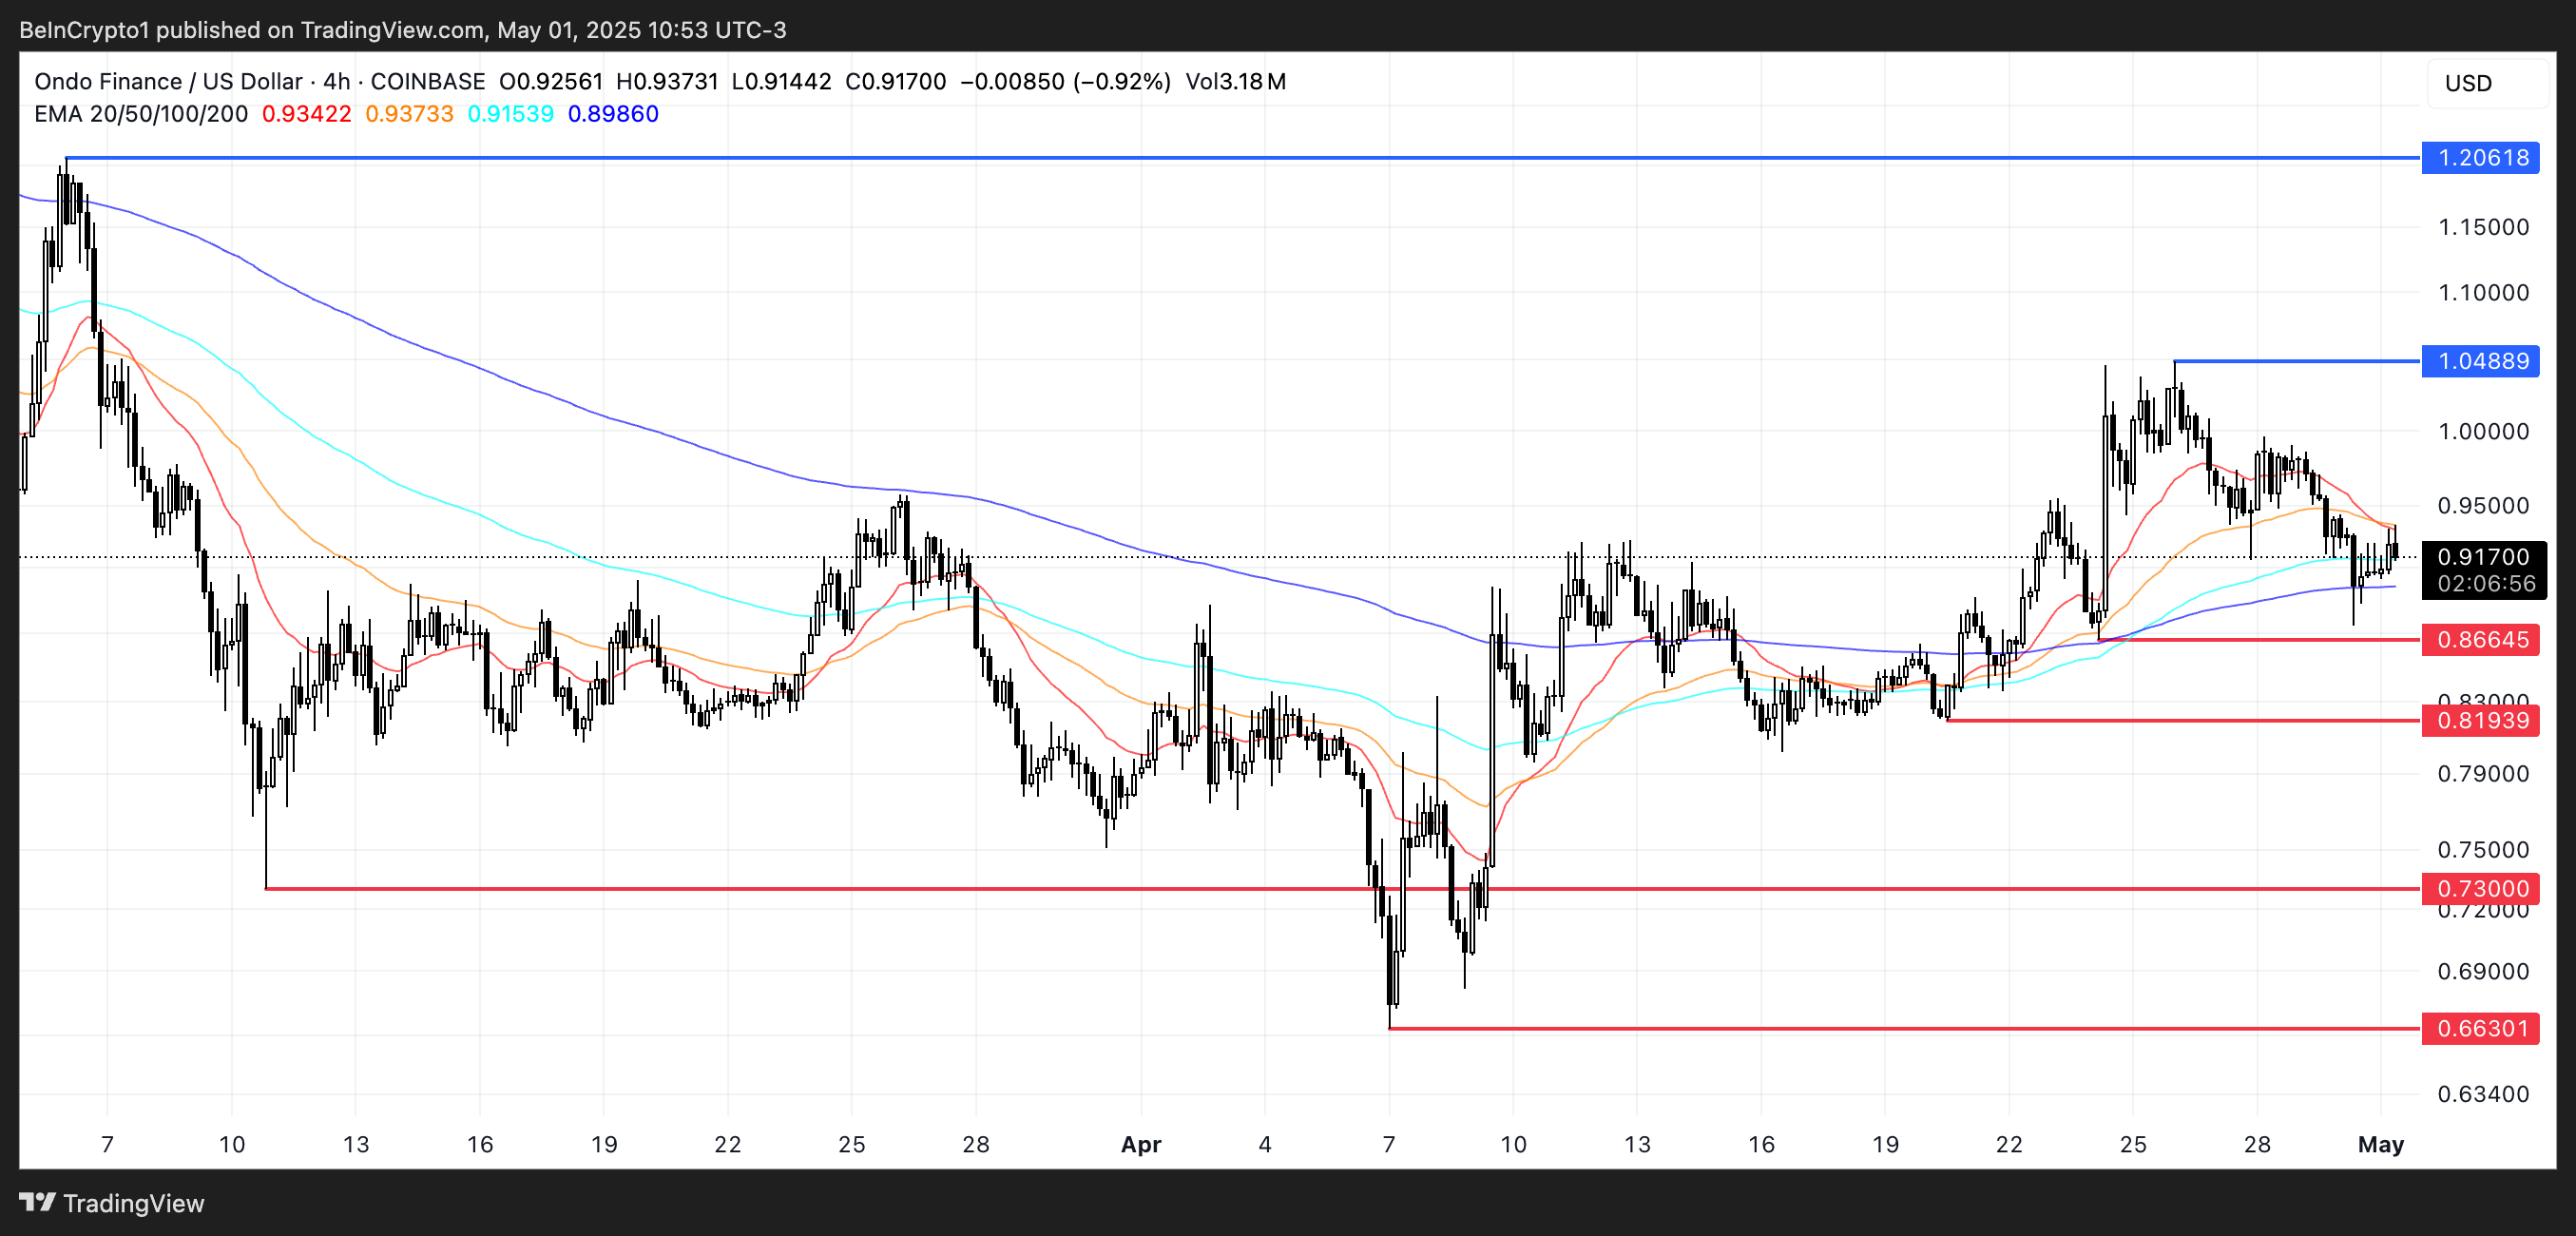
Despite ONDO’s short-term strength, its technical indicators are flashing caution. A death cross has recently formed on its EMA lines—a pattern often associated with bearish momentum.
The first key support is $0.866. If that level breaks, ONDO could decline to $0.819, with deeper support at $0.73 and $0.663 if the downtrend accelerates.
On the upside, if sentiment reverses and ONDO manages to break above the $1.04 resistance, a push toward $1.20 could follow, opening the door for a stronger recovery.
Reserve Rights (RSR)
Reserve Rights is up nearly 41% over the past 30 days, riding a wave of renewed interest following its Coinbase listing and lingering associations with incoming SEC Chair Paul Atkins.
Despite Atkins having no active ties to the project today, his early advisory role has fueled trader speculation about potential regulatory tailwinds.
This narrative, combined with Binance’s top traders heavily going long, has positioned RSR as one of the more politically charged tokens in the current market.
The listing alone sparked a 9% intraday jump, helping bring RSR back into the spotlight after a long quiet phase post-2021 peak.
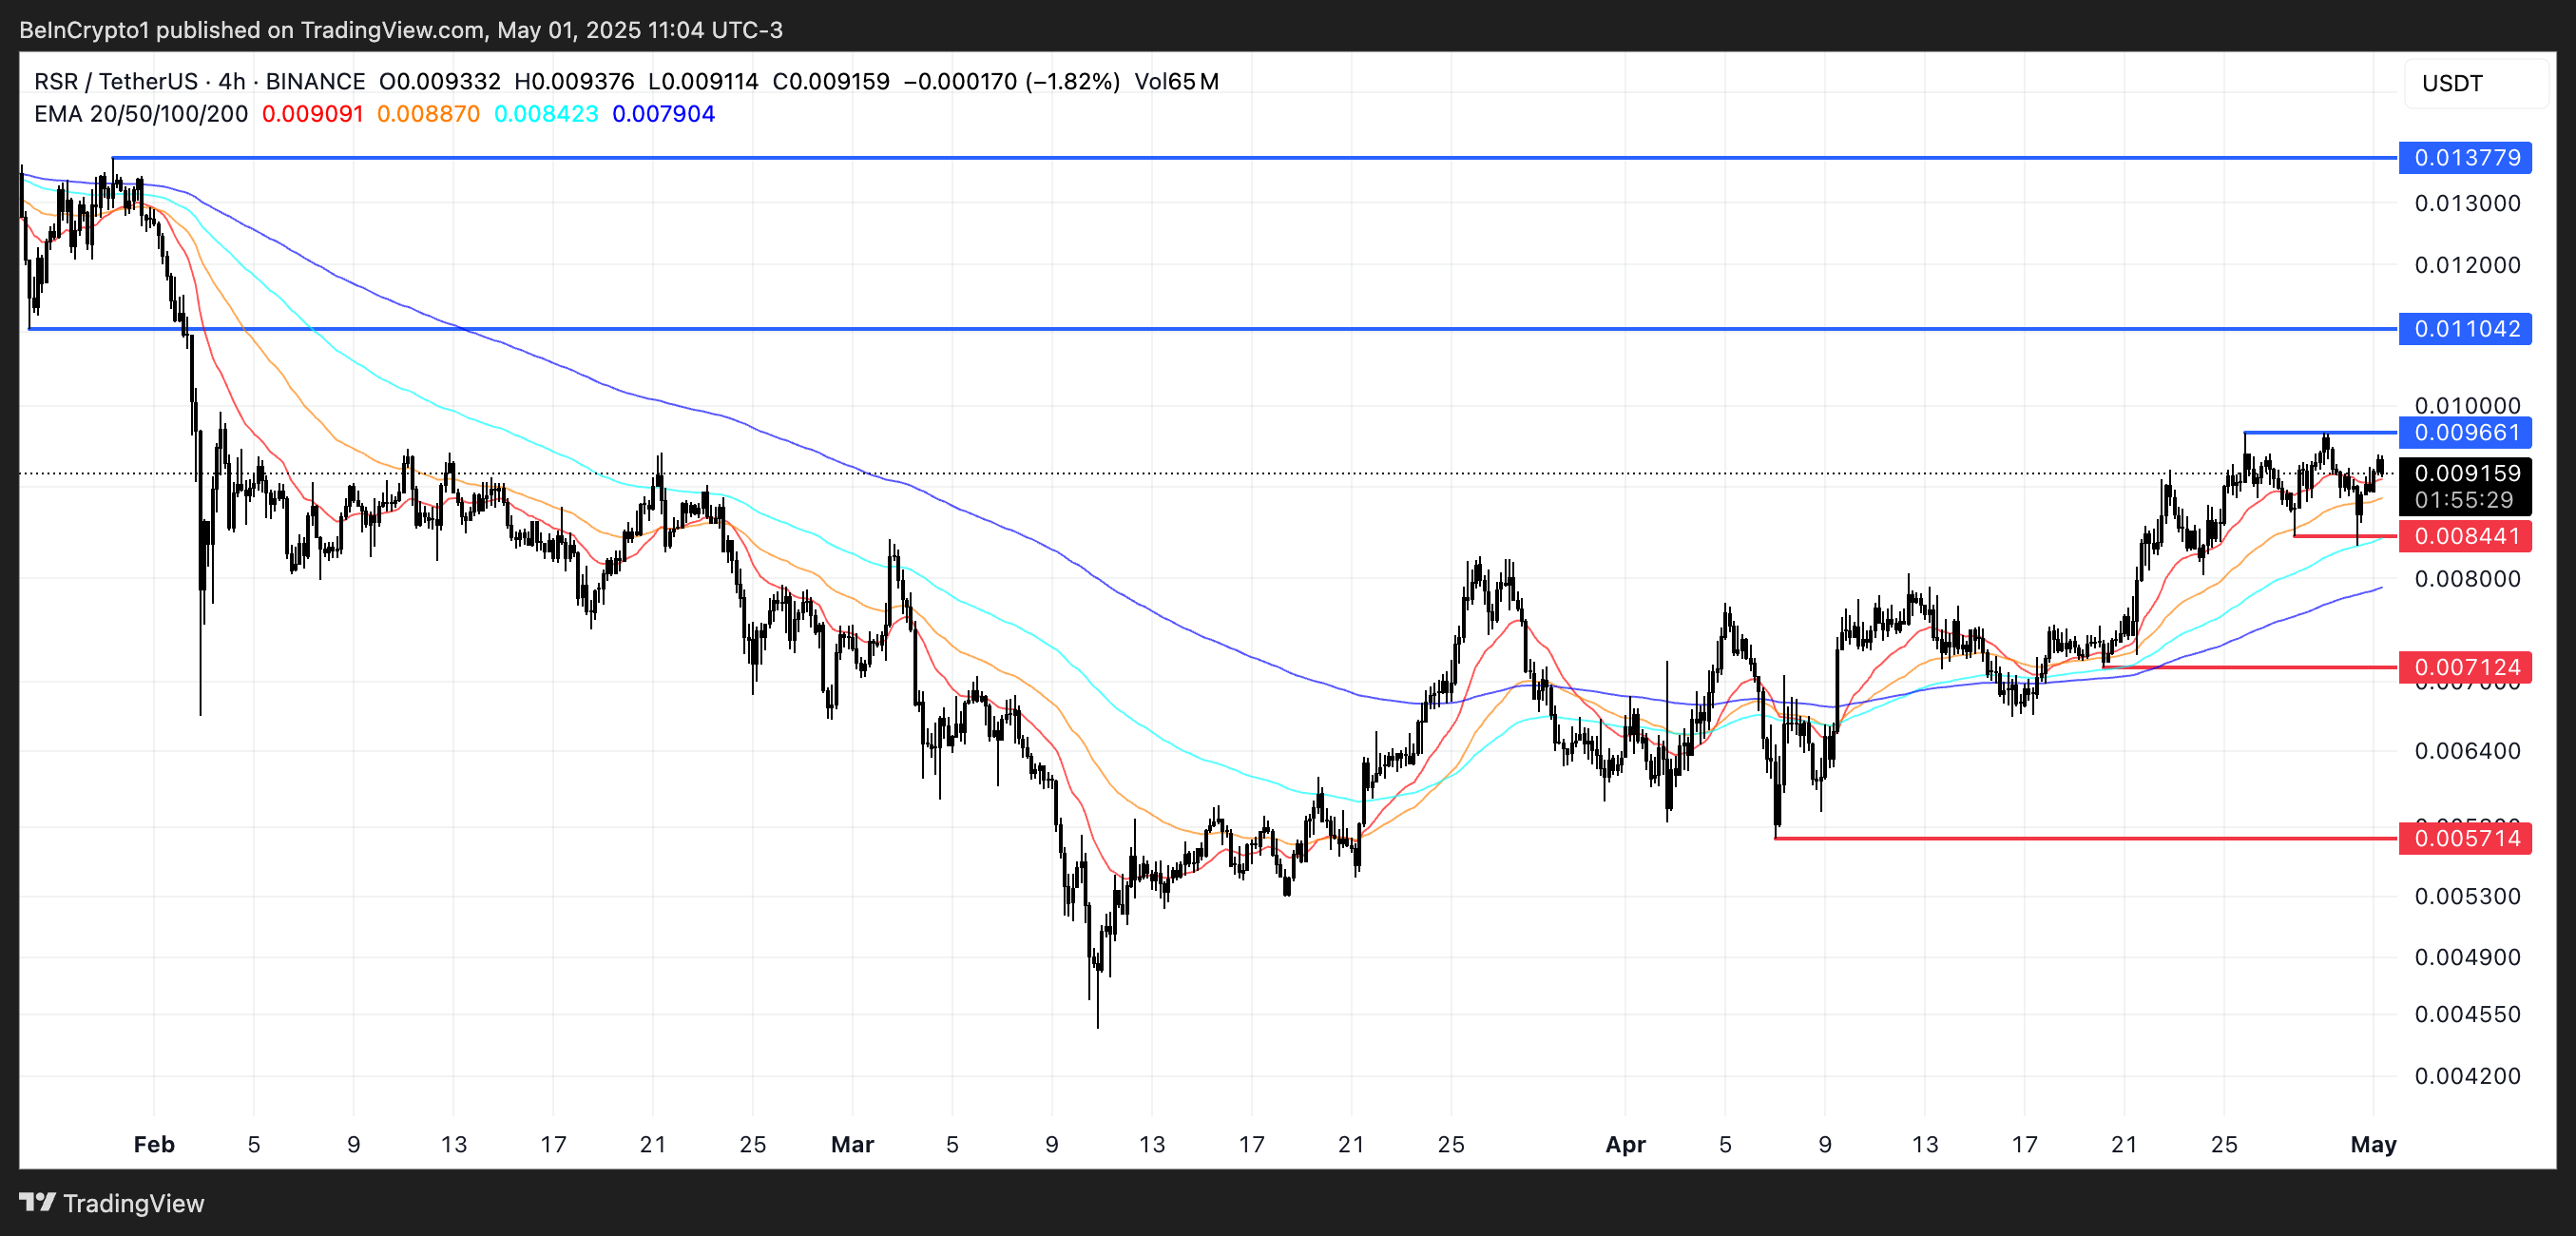
Technically, RSR is approaching a critical decision point. The token recently attempted to break the $0.0096 resistance level twice and failed, signaling the importance of that threshold.
A successful breakout could open the door to $0.011, and potentially $0.0137 if momentum builds. However, failure to hold current levels could trigger a correction toward $0.0084, with deeper support at $0.0071 and $0.0057.
TokenFi (TOKEN)
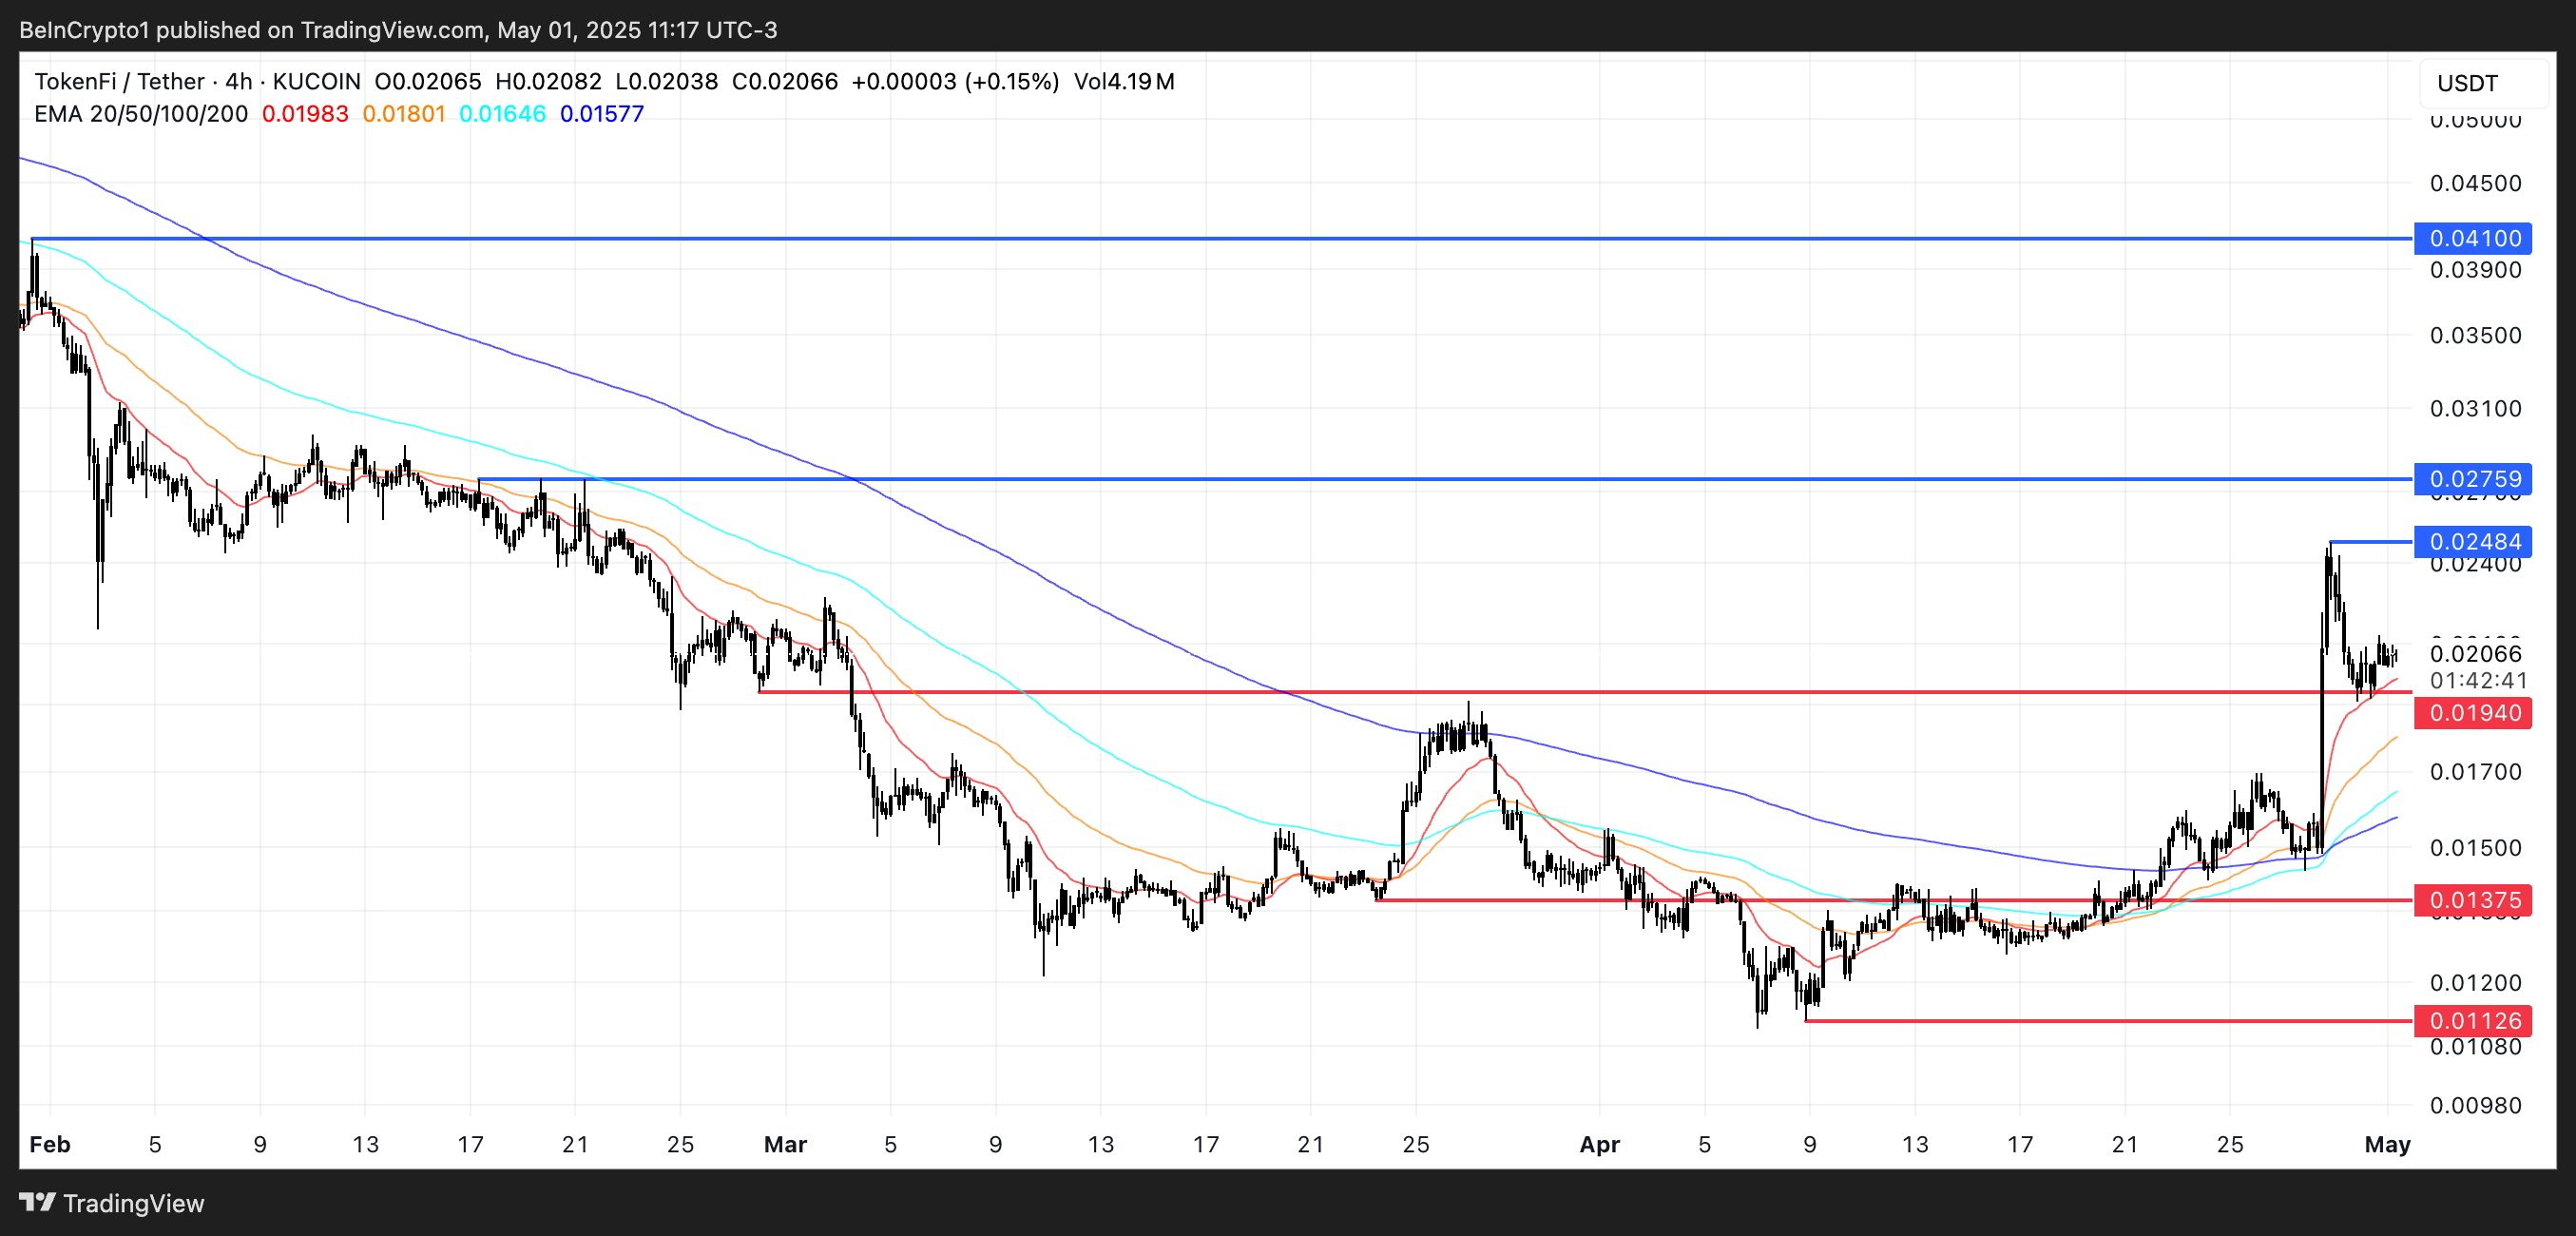
Real-world asset (RWA) platform TokenFi (TOKEN) has surged nearly 40% over the past seven days, pushing its market cap back to the $20 million mark.
The sharp rise comes despite a notable drop in trading activity, with 24-hour volume falling over 59% to $8.13 million.
The divergence between price appreciation and declining volume raises questions about the rally’s sustainability, but for now, TOKEN is regaining attention as a small-cap RWA narrative play in the altcoin market.
From a technical standpoint, TOKEN is approaching key resistance levels. If the bullish momentum continues, the token could test $0.024 and $0.0275, with a potential breakout target of $0.041.
However, any reversal could see TOKEN retrace toward the $0.0194 support level. If that fails, deeper downside levels lie at $0.0137 and $0.0112.
Cardano (ADA) is up 4% on Monday, trying to hit $0.65, showing signs of renewed bullish momentum. Technical indicators are beginning to align in favor of buyers, with the BBTrend turning positive for the first time in days and the DMI signaling strengthening upward pressure.
ADA is also nearing a potential golden cross formation on its EMA lines, which could further support a breakout if resistance levels are cleared. With momentum building and key levels in sight, Cardano is entering a critical zone that could define its short-term direction.
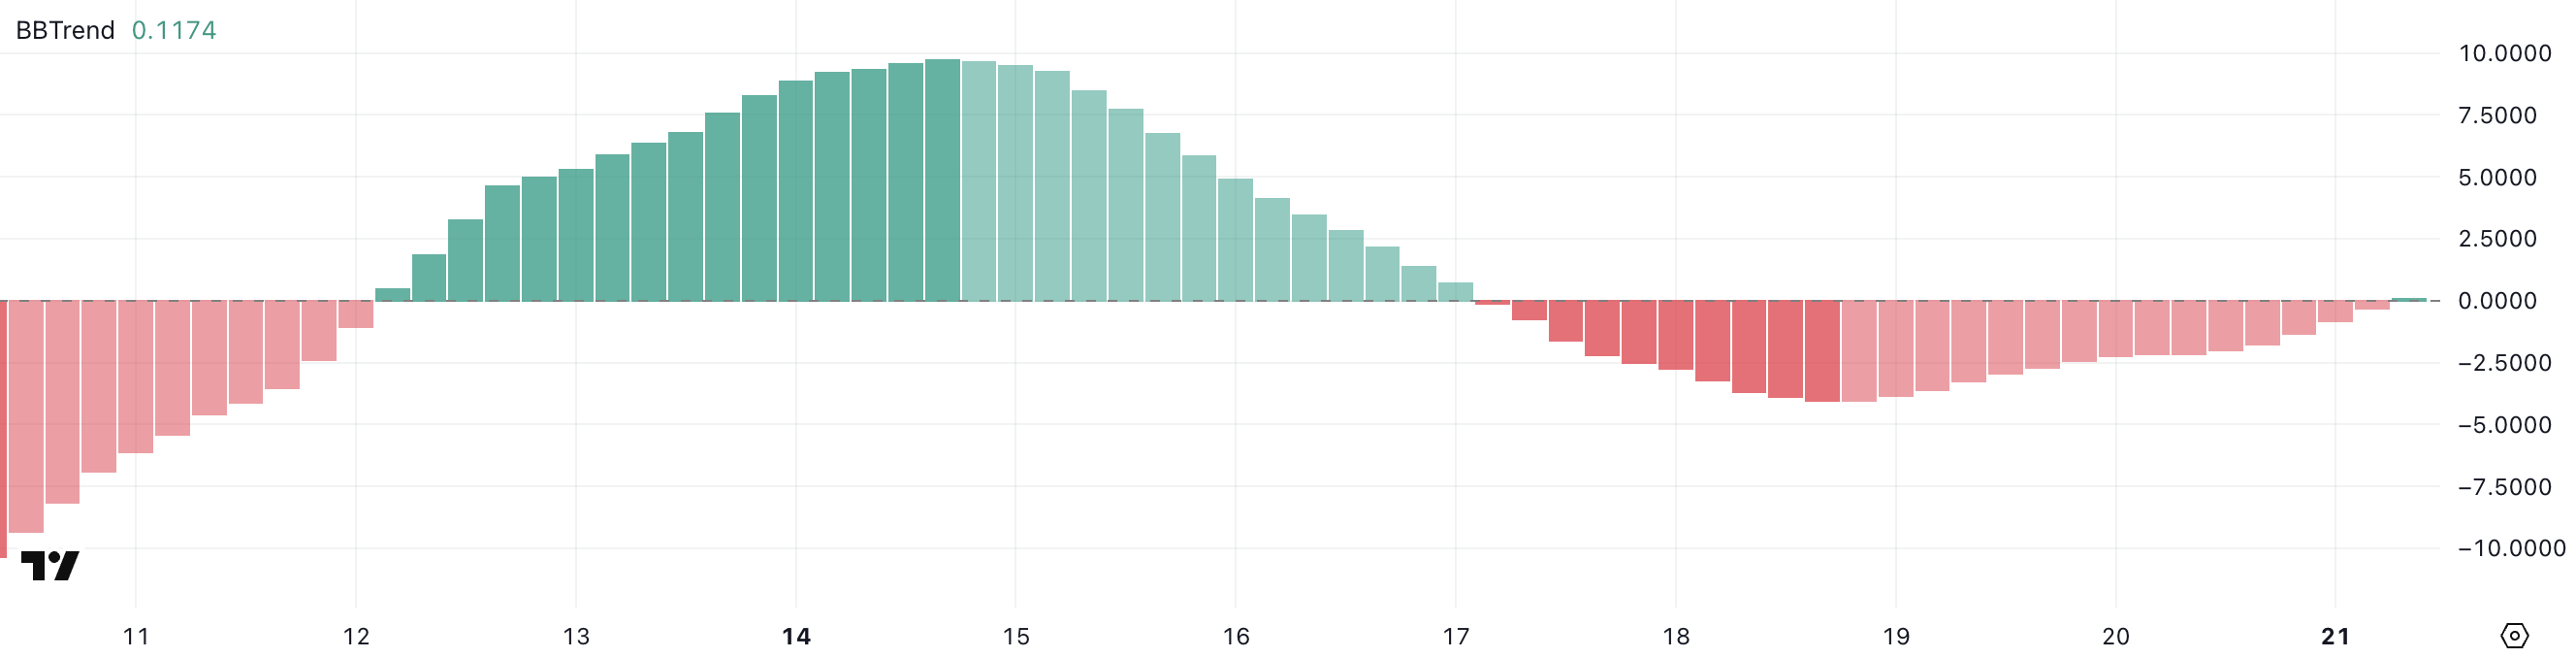
Cardano Shows Early Signs of Recovery as BBTrend Turns Positive
Cardano BBTrend has just flipped back into positive territory at 0.11, following four straight days in the negative zone. This shift, though subtle, may be the first sign of momentum stabilizing after recent weakness.
BBTrend, or Bollinger Band Trend, is a technical indicator that gauges the strength and direction of a trend based on how wide or narrow the Bollinger Bands are.
When the bands begin to expand and BBTrend moves into positive values, it often suggests growing volatility in favor of an emerging bullish trend. On the other hand, prolonged negative readings typically signal fading momentum and a lack of directional strength.
While a BBTrend of 0.11 is still low and not yet signaling a strong uptrend, the fact that it turned positive marks a potential inflection point.
It suggests that selling pressure may be fading and the price could be entering a recovery phase if buying activity increases. This early uptick in BBTrend often precedes a broader move.
Traders will likely be watching closely to see if this positive shift is sustained in the coming sessions, as continued gains in BBTrend could indicate the beginning of a more defined upward move for ADA.
Cardano Buyers Regain Control as Uptrend Shows Early Strength
Cardano Directional Movement Index (DMI) is showing a notable shift in momentum, with its Average Directional Index (ADX) climbing to 17.79, up from 13.77 yesterday.
The ADX measures the strength of a trend, regardless of its direction, on a scale from 0 to 100. Values below 20 suggest a weak or non-existent trend, while readings above 25 typically confirm that a trend is gaining strength.
ADA’s ADX is still below the 20 threshold but rising steadily—indicating that momentum is building and a stronger directional move could soon take shape.
Looking deeper, the +DI (positive directional indicator) has jumped to 26.38 from 16.30 just a day ago, signaling increased buying pressure. Although it has slightly pulled back from an earlier peak at 29.57, it remains firmly above the -DI (negative directional indicator), which has dropped significantly from 22.72 to 13.73.
This widening gap between the +DI and -DI suggests a clear shift in favor of bulls, with buyers regaining control after a brief period of selling pressure.
If the ADX continues to rise alongside a dominant +DI, it could confirm a strengthening uptrend for Cardano.
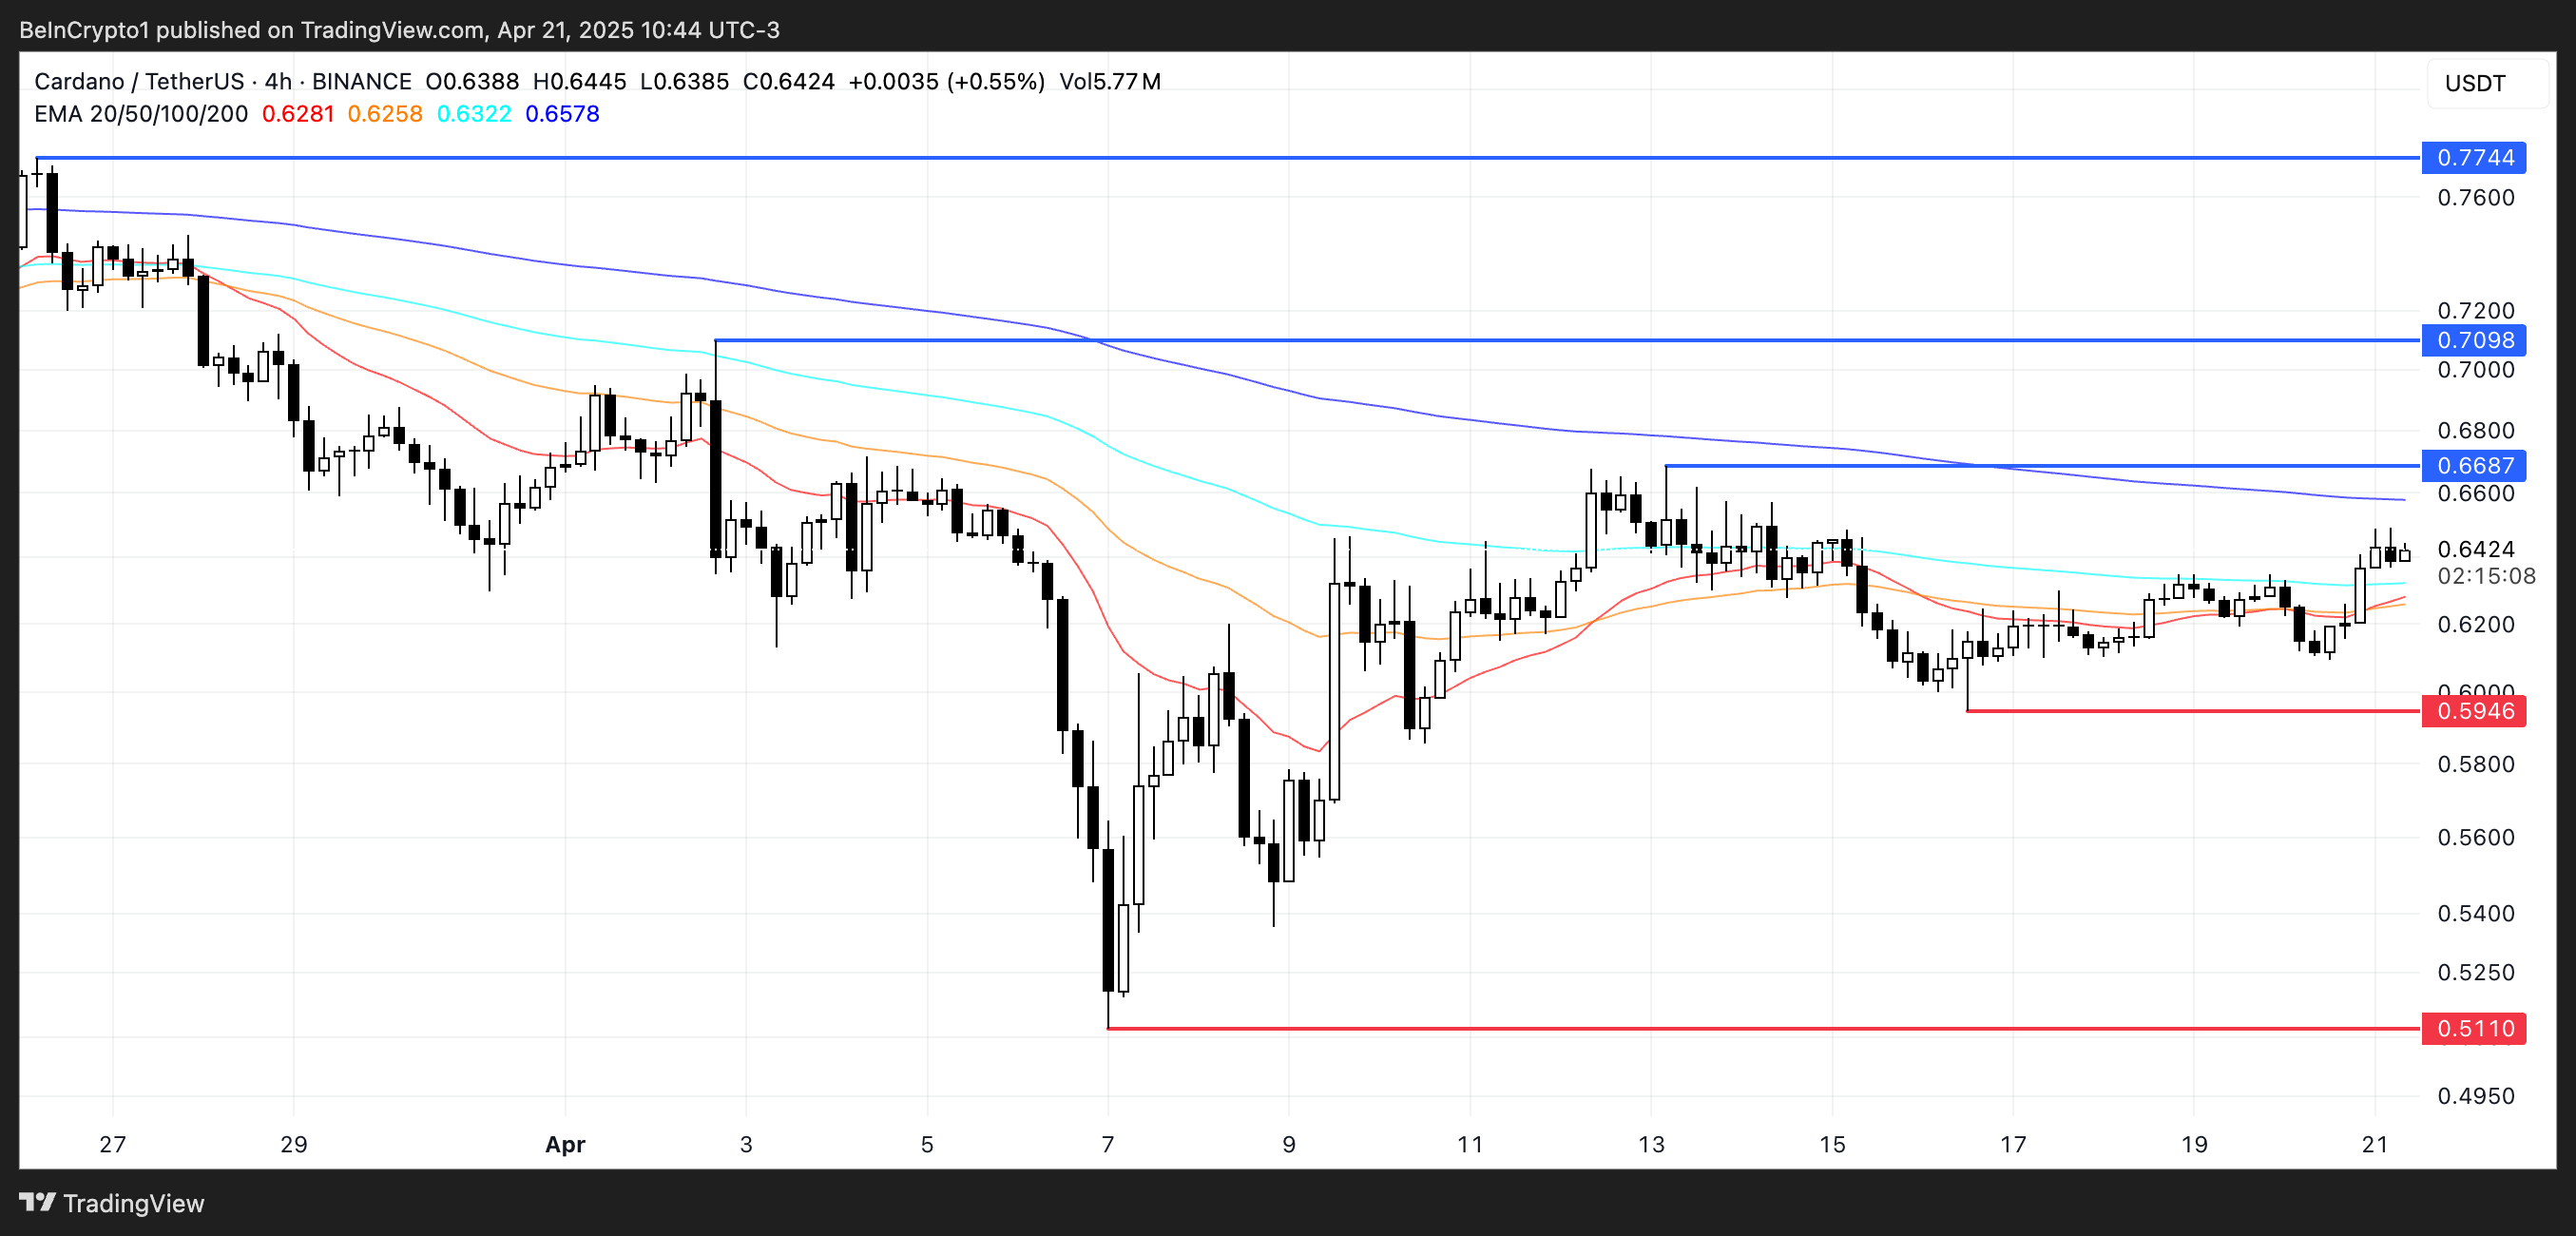
Cardano Nears Golden Cross as Bulls Eye Breakout—but Key Support Still in Play
Cardano price is approaching a potentially bullish technical development, as its EMA lines suggest a golden cross may form in the coming sessions.
A golden cross occurs when the short-term moving average crosses above the long-term moving average, often signaling the start of a stronger uptrend.
If this crossover is confirmed and ADA manages to break above the resistance at $0.668, the next upside targets sit at $0.709 and $0.77—levels not seen since late March.
However, if ADA fails to maintain its upward trajectory and the momentum fades, downside risks remain in play.
A drop back toward the $0.594 support would be the first sign of weakness, and a breakdown below that level could expose the asset to deeper losses, with $0.511 as the next key support zone.
Price action around the $0.668 resistance will likely be the deciding factor.
XRP is down 5% over the past week, struggling to regain momentum as technical indicators flash mixed signals. Its Relative Strength Index (RSI) has dropped below 50, and the price remains stuck within a tight range between key support and resistance levels.
At the same time, the Ichimoku Cloud has shifted from green to red, with a thickening cloud ahead suggesting growing bearish pressure. With volatility compressing and momentum fading, XRP is nearing a critical point where a breakout—or breakdown—seems increasingly likely.
XRP Struggles to Regain Momentum as RSI Drops Below 50
However, the fact that it hasn’t crossed the overbought threshold of 70 since March 19—over a month ago—signals a lack of sustained bullish momentum. This could mean XRP is still in a consolidation phase, with the market waiting for a clearer direction.
If RSI continues to climb toward 50 and beyond, it may hint at building momentum, but without a breakout above 70, upside could remain limited.
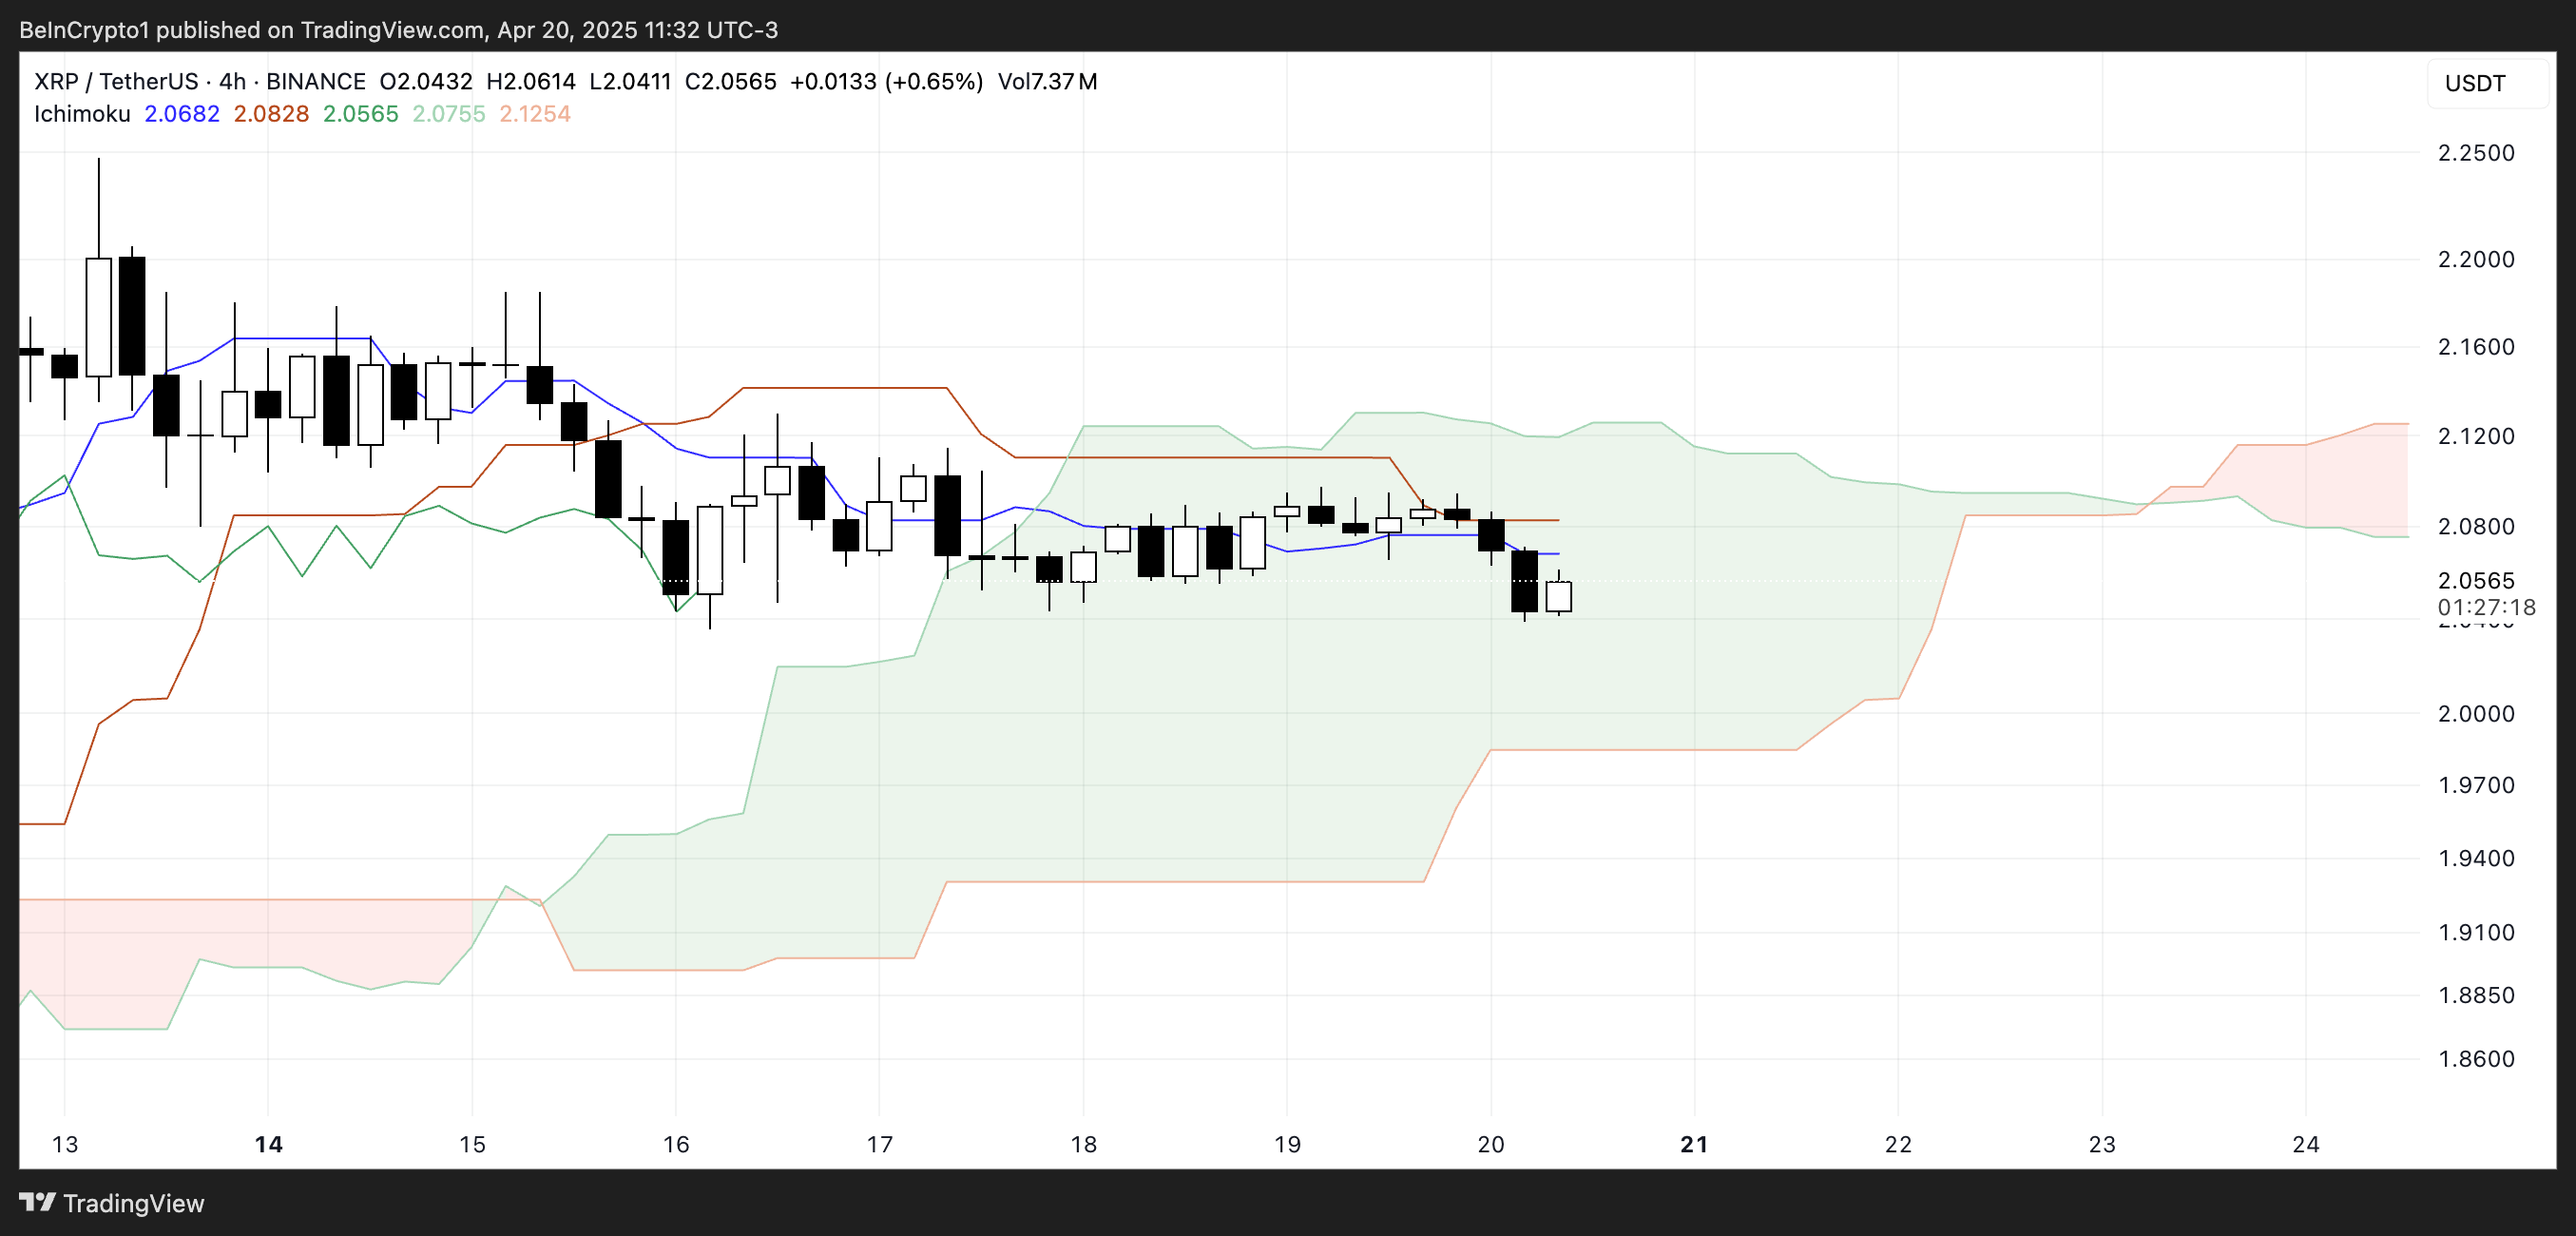
XRP Faces Uncertainty as Bearish Trend Begins to Expand
XRP is currently trading inside the Ichimoku Cloud, signaling market indecision and a neutral trend.
The Tenkan-sen (blue line) has crossed below the Kijun-sen (red line), which is a bearish signal, but with the price still within the cloud, it lacks full confirmation.
Looking ahead, the cloud has shifted from green to red—a sign that bearish momentum may be building. Even more concerning is that the red cloud is widening, which suggests increasing downward pressure in the near future.
A thickening red Kumo often signals stronger resistance overhead and a potential continuation of a bearish trend if the price breaks below the cloud.
Until XRP breaks out decisively in either direction, the market remains in a wait-and-see phase, but the growing red cloud tilts the bias toward caution.
XRP Compression Zone: A Breakout Could Send Price to $2.50 — Or Much Lower
XRP price is currently trading within a tight range, caught between a key support level at $2.05 and resistance at $2.09. This narrow channel reflects short-term uncertainty, but a decisive move in either direction could set the tone for what’s next.
If the $2.05 support fails, the next level to watch is $1.96. A break below that could trigger a steep drop toward $1.61, which would mark the first close below $1.70 since November 2024—a bearish signal that could accelerate selling pressure.
On the flip side, if bulls regain control and push XRP above the $2.09 resistance, the next target lies at $2.17. A breakout beyond that could open the door to a move toward $2.50, a price level not seen since March 19.