Balkan Startup Village is turning the Split Technology Park into a full-blown playground for founders, builders, and Web3 misfits who are actually here to get things done. Less talk, more coworking. Less hype, more pitch decks.
You’ll find everything from hands-on workshops and panels (think DePIN, AI, infra, gaming, Web3 marketing: you know, the stuff we all keep saying we need to “double down on”) to casual fireside chats, a solid Demo Day, and yes – a couple of airsoft battles and city tours to balance it out.
No ticket fees. No velvet ropes. Just open space to build, learn, and meet people who are actually building cool stuff, like the folks from Solana ID, Metaplex, Solflare, dReader, Ceres, Kamino Finance, Limechain and a bunch more.
Come early to claim your coworking corner, drop into a few panels, or stick around for Demo Day and catch some of the region’s sharpest startups pitching live. There’s even a podcast zone, career speed dating (still cooking), and a founder’s dinner if you’re lucky enough to score an invite.
They’re tagging along as a media partner, so expect interviews, daily recaps, and behind-the-scenes coverage straight from Split. But honestly, you kind of have to be there.
In the final week of July, the total open interest in the crypto derivatives market remains historically high, exceeding $200 billion. Any significant price movement now could trigger massive losses for both long and short positions.
However, a few altcoins are showing signs of potential large-scale liquidations this week. Let’s take a closer look at which ones.
1. Ethereum
Ethereum has been surrounded by positive news about institutional accumulation in recent months. At times, its inflows even outperformed those of Bitcoin ETFs. More recently, SharpLink Gaming acquired 77,206 ETH worth $296 million last week, raising its total holdings to 438,000 ETH.
These bullish developments pushed ETH close to the $4,000 mark in the last week of July. Many analysts expect ETH to hit $4,000 soon—or even surpass it. But this level also acts as a strong psychological resistance, where profit-taking could emerge at any moment.
“A key resistance level ahead for Ethereum $ETH is $3,980. Breaking above it could ignite a major bull rally!” crypto analyst Ali Martinez commented.
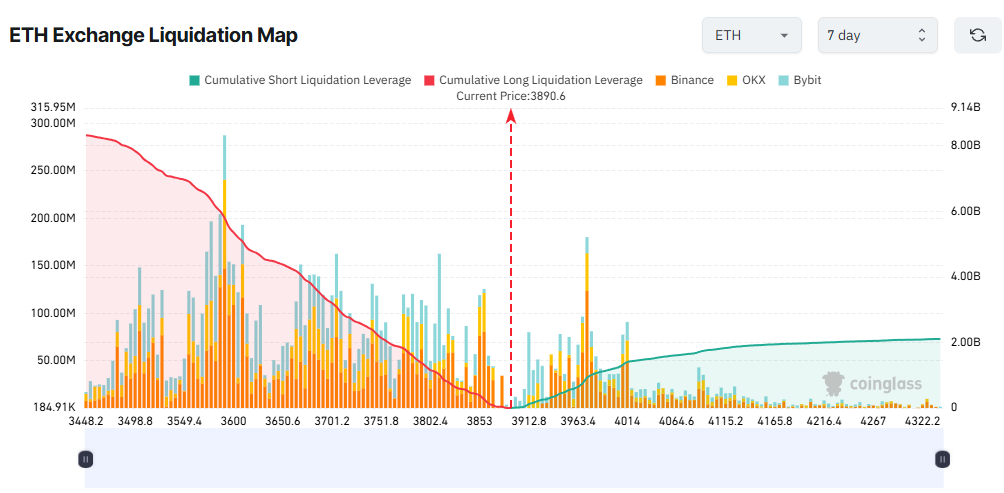
Regardless of direction, the liquidation map shows that potential liquidations could reach billions of dollars if ETH moves significantly.
According to Coinglass data, if ETH breaks above $4,000, total accumulated short liquidations could reach $1.2 billion. On the other hand, if ETH faces strong profit-taking and drops to $3,500, long liquidations could soar to $7.8 billion.
The map also reveals an imbalance between longs and shorts, indicating that many traders are betting more money and leverage on a downward correction.
2. Solana
Although Solana still needs to rise over 50% to revisit its early-year high of nearly $300, its open interest has already exceeded $11 billion. That’s over 25% higher than when SOL peaked in January.
This suggests that traders are more exposed to Solana now than in the past. However, most of this exposure comes from derivatives rather than spot trading.
CoinMarketCap data shows that SOL’s current daily spot trading volume is just over $6 billion. That’s far below the tens of billions seen in January.
This wide gap between derivatives and spot volume reflects that Solana traders are leaning toward short-term bets. As a result, the token is prone to sharp swings and potential liquidations.
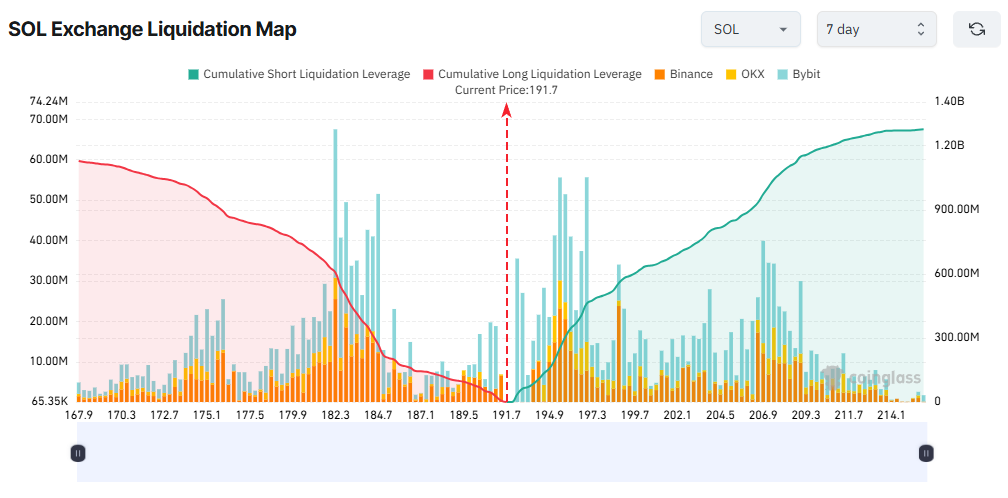
The liquidation map shows a balance between long and short positions. With SOL trading around $191, a move above $200 could trigger more than $600 million in liquidations. Conversely, a drop to $181 could liquidate over $700 million in long positions.
3. BNB
Entering the last week of July, BNB hit a new all-time high of $859. This rally was fueled by growing activity on BNB Chain and increased interest from companies in the BNB treasury.
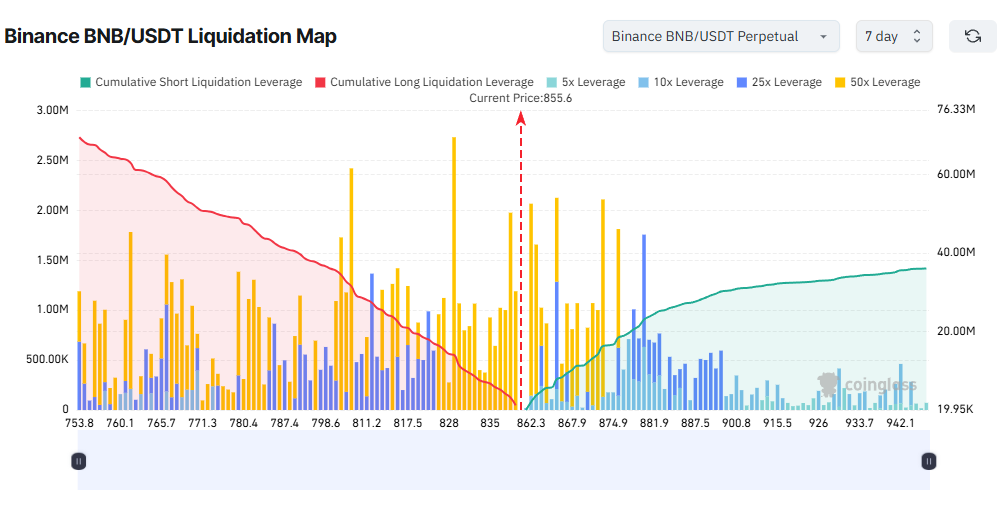
While BNB hasn’t shown signs of a pullback yet, the BNB/USDT liquidation map on Binance reveals heavy leverage—up to 50x.
The map is almost entirely covered in yellow (indicating 50x leverage), especially around the $753 to $875 range.
On Binance alone, total long liquidations outweigh shorts. If BNB surpasses $875, short positions worth $18.5 million could be liquidated. On the other hand, if BNB drops below the psychological $800 mark, more than $36 million in long positions would be wiped out.
Ignoring short-term noise, many analysts believe BNB could soon reach $1,000. However, some offer a more detailed view, suggesting that the price might first fall below $800 before resuming its uptrend.
Cardano (ADA) is down more than 6% on Thursday but remains up nearly 40% over the past seven days. After surging to $1.15 following its inclusion in the US crypto strategic reserve, ADA has struggled to stay above $1 in recent days.
Some users are now questioning its inclusion in the reserve, raising concerns about its price. With whale accumulation slowing and resistance at $1 proving difficult to break, ADA’s next move will depend on whether bullish momentum can return or if selling pressure pushes it lower.
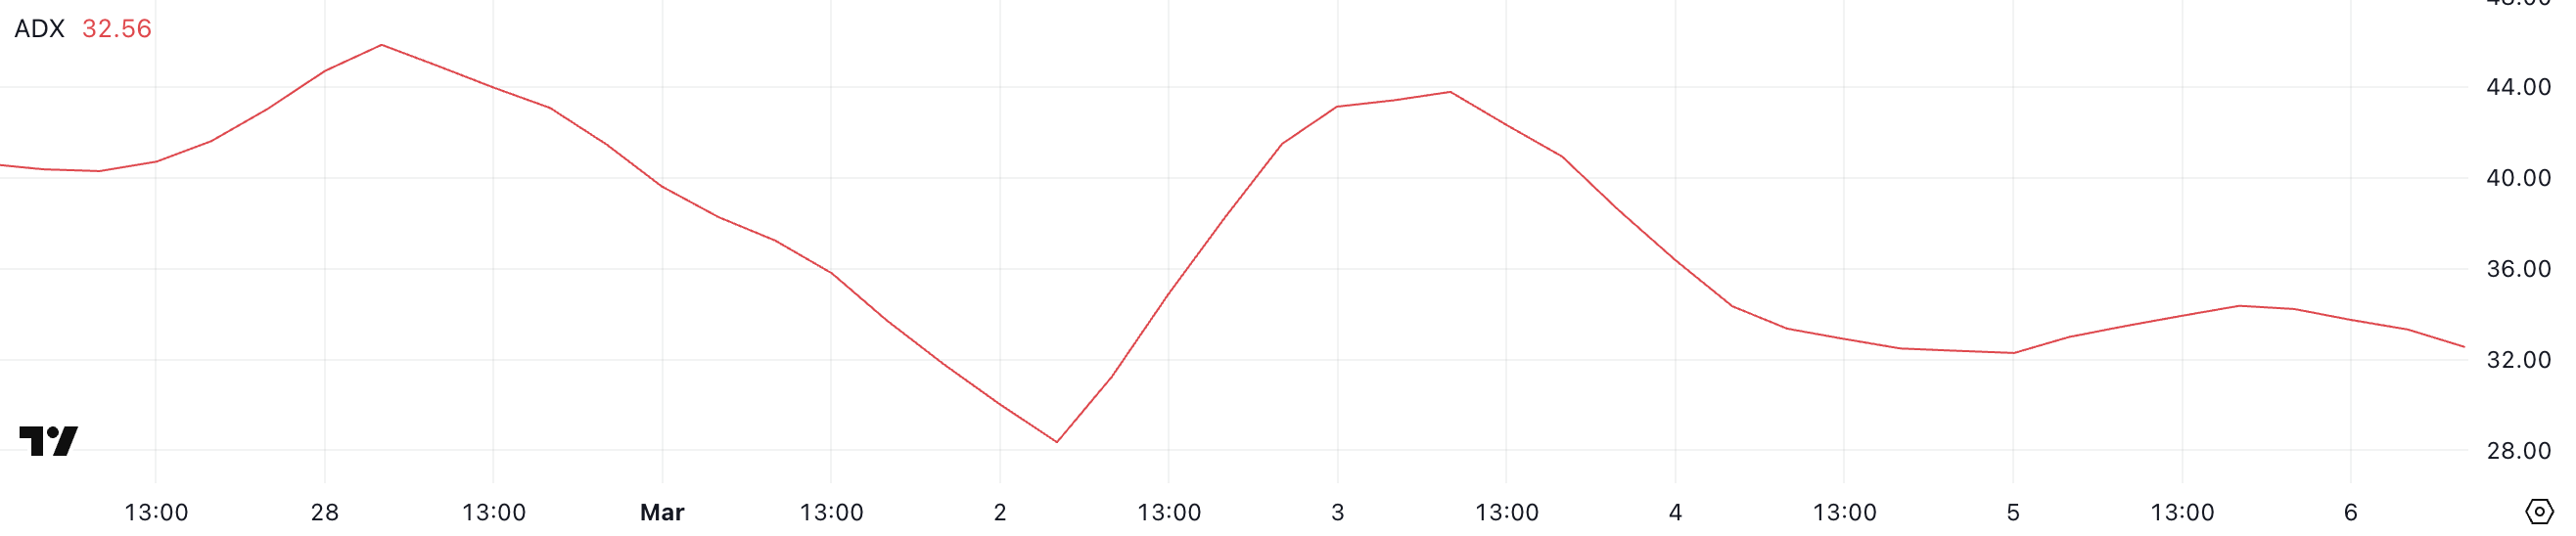
ADA ADX Shows The Uptrend Is Still Strong, But It’s Not As Strong As Before
Despite the decline in ADX, it remains above the 25 threshold, indicating that the ongoing uptrend still has strength, though momentum has slightly weakened.
The Average Directional Index (ADX) measures trend strength on a scale from 0 to 100, with readings above 25 signaling a strong trend and values below 20 suggesting weak or nonexistent momentum.
With ADA in an uptrend and ADX at 32.5, the trend remains intact but may not be as strong as it was three days ago.
If ADX continues to decline, the trend could lose momentum, leading to a potential slowdown or consolidation. However, if ADX stabilizes or rises again, ADA could maintain its upward trajectory and push toward new resistance levels.
Cardano Whales Are Not Accumulating
The number of Cardano whales – addresses holding between 1 million and 10 million ADA – has declined slightly in the past few days after a strong increase between March 1 and March 4, when it rose from 2,442 to 2,471.
Addresses Holding Between 1 Million and 10 Million ADA. Source: Santiment.
Tracking these whales is important because large holders can influence market liquidity, volatility, and price trends. A rising number of whales often signals accumulation, which can drive prices higher, while a decline suggests potential profit-taking or reduced confidence.
With the current whale count slightly below its recent surge, ADA’s recent uptrend could slow if more large holders begin selling. However, if accumulation resumes, it could support continued price gains.
Will Cardano Test $1 Soon?
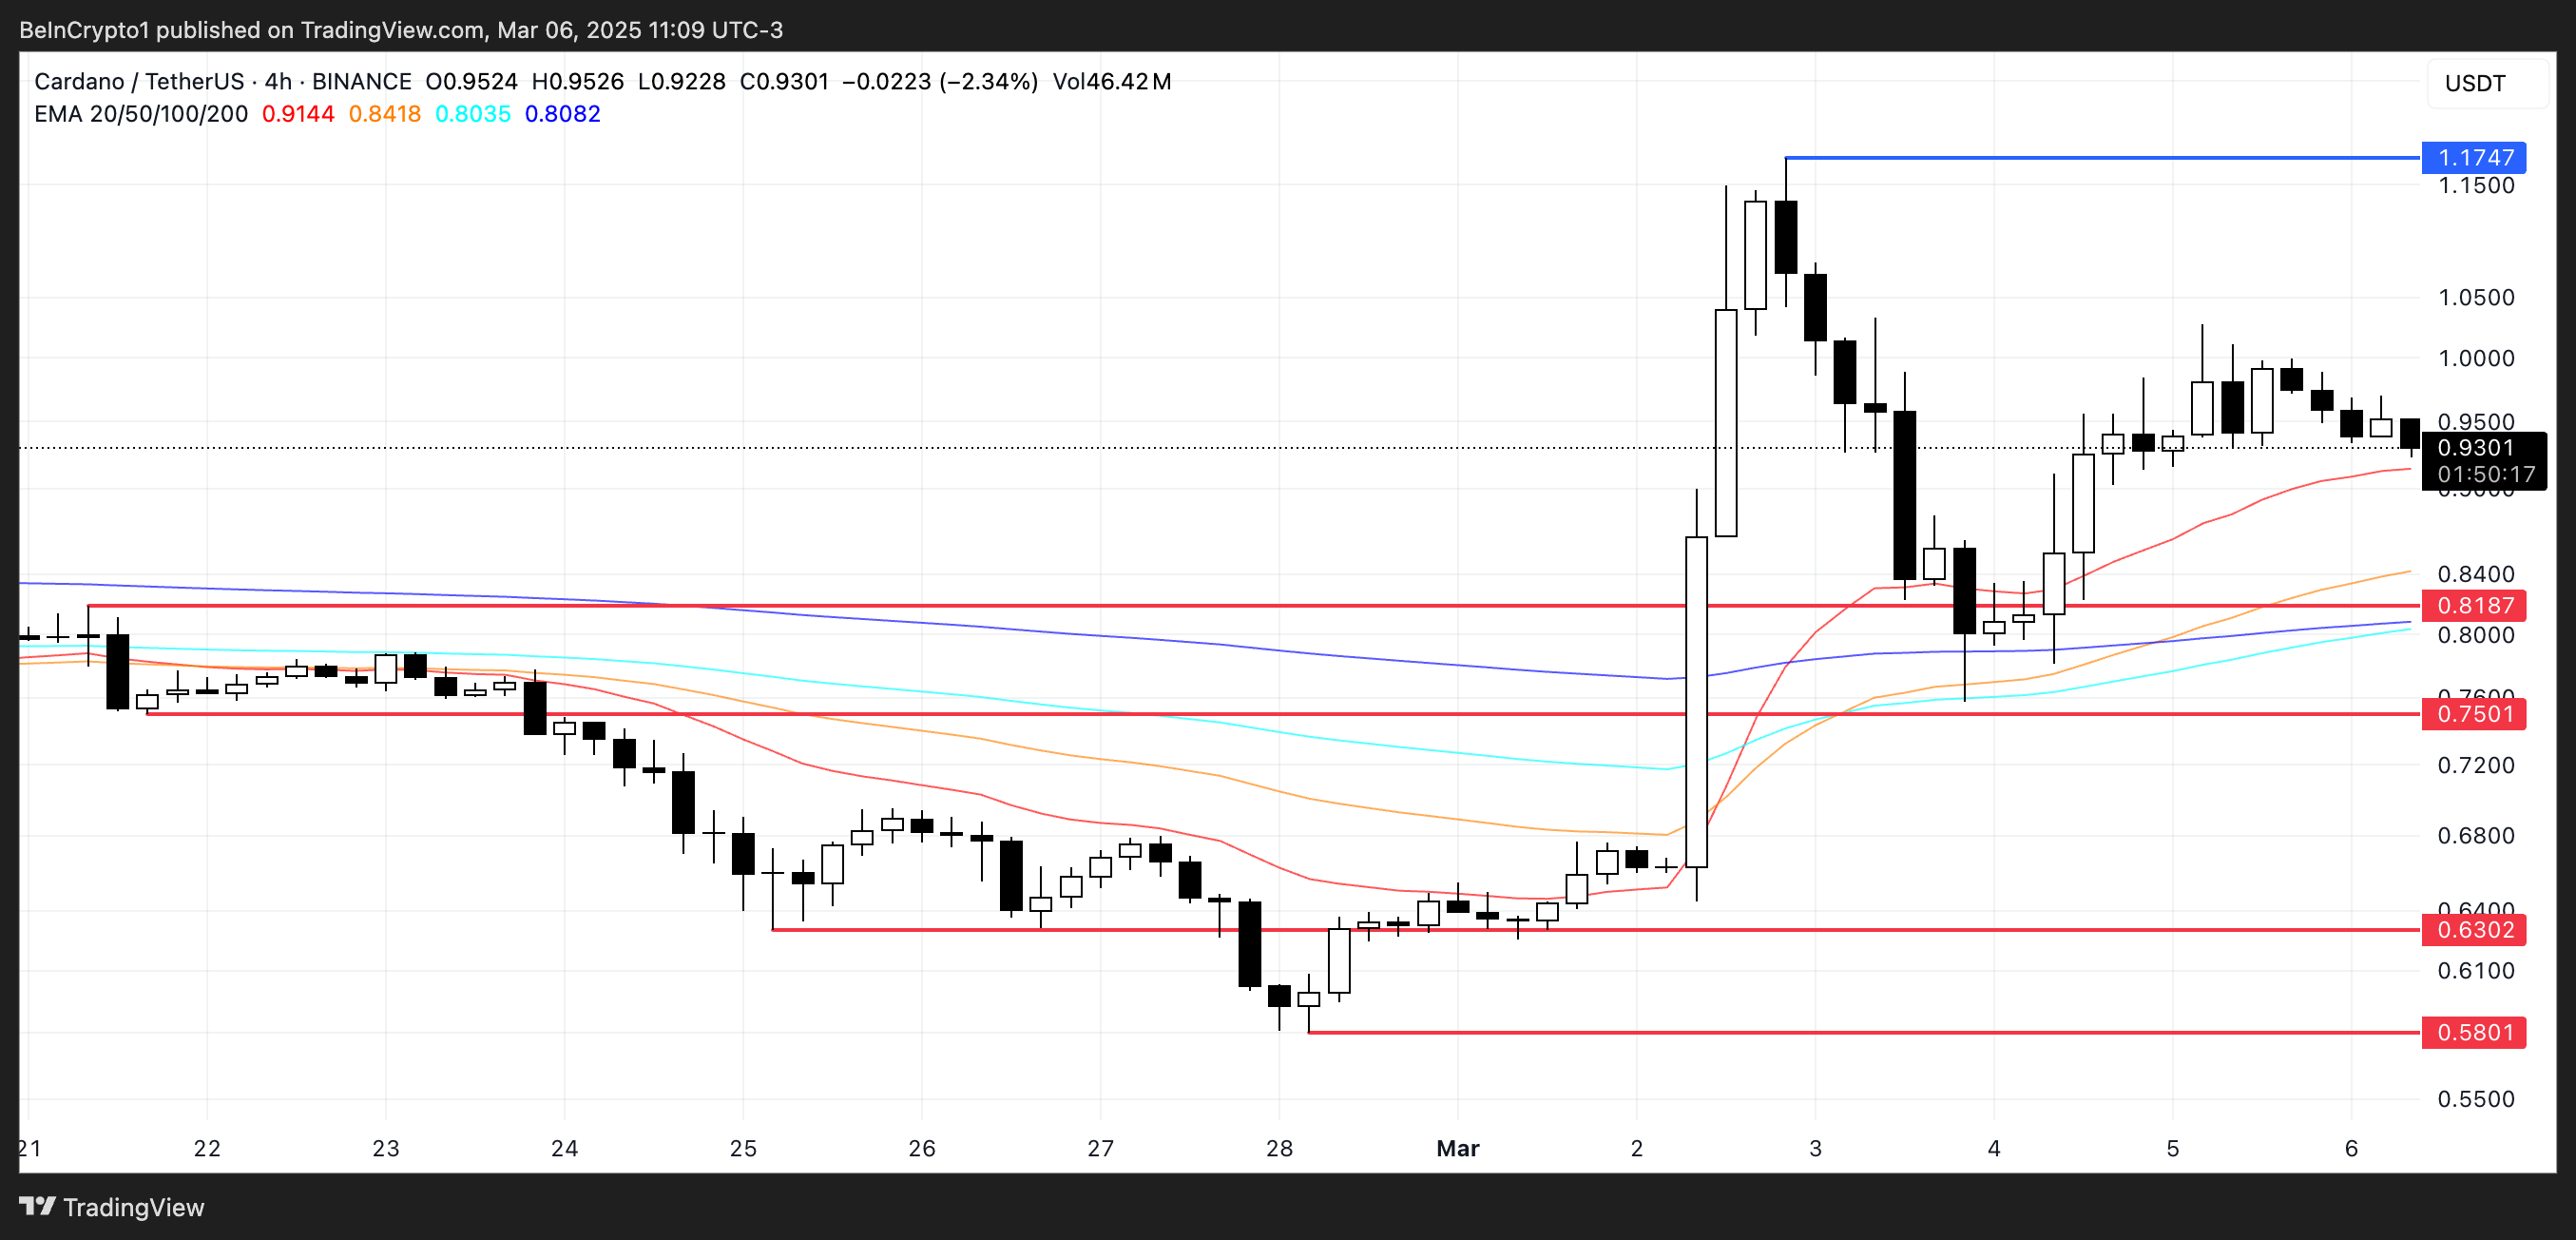
Cardano’s EMA lines indicate a bullish trend, with short-term EMAs positioned above long-term ones.
However, despite this positive setup, Cardano price has struggled to break above $1 in recent days after a sharp correction following its 71% surge on March 2. This suggests that while momentum remains intact, resistance at $1 is proving difficult to overcome.
If the current uptrend reverses into a downtrend, ADA could test support at $0.818, with a break below that level potentially leading to $0.75. A stronger selloff could push the price as low as $0.63 or even $0.58.
On the other hand, if ADA regains momentum, it could test $1 again, and a breakout above this key resistance could send the price toward $1.17, a level it nearly reached during the March 2 surge.
HBAR has experienced considerable volatility over the past month, struggling to recover recent losses and break the month-and-a-half-long downtrend.
Despite these challenges, the altcoin remains in a critical position as traders remain optimistic about its potential breakout. However, a failure to break key resistance levels could lead to further price declines.
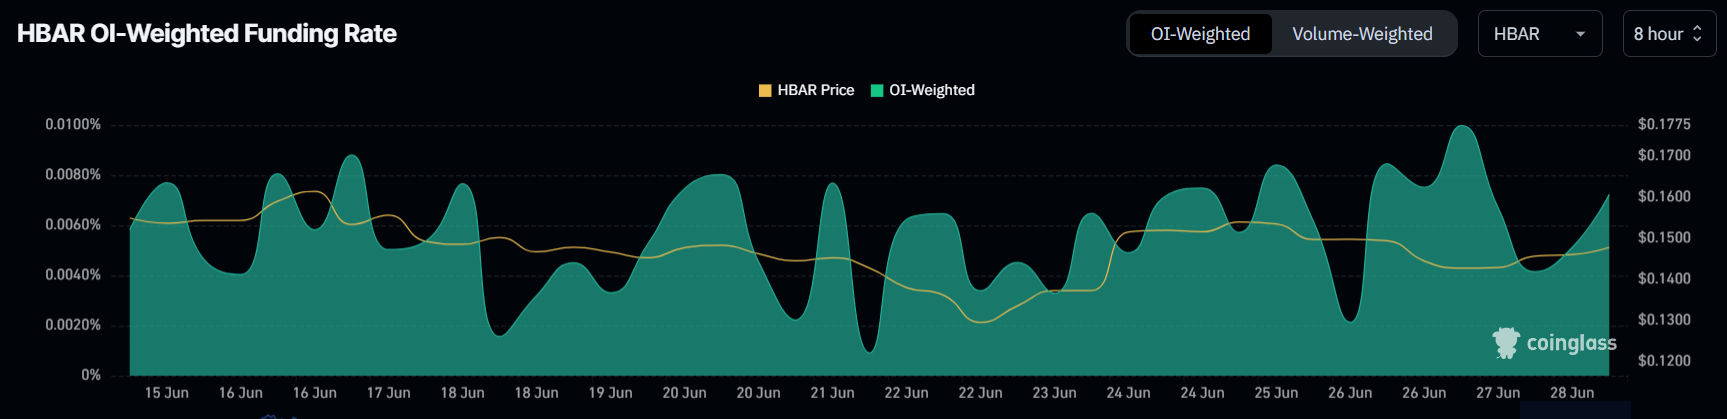
HBAR Traders Are Bullish
Throughout this month, traders have shown strong bullish sentiment toward HBAR. The funding rate has remained positive consistently, indicating a dominance of long contracts in the market.
This suggests that traders are confident about a potential price recovery and are positioning themselves to capitalize on a rise in value. The consistent optimism reflects a belief that HBAR can rebound from its current downtrend.
Also, the positive funding rate shows that more investors are willing to place bets on the future of altcoin despite the ongoing challenges.
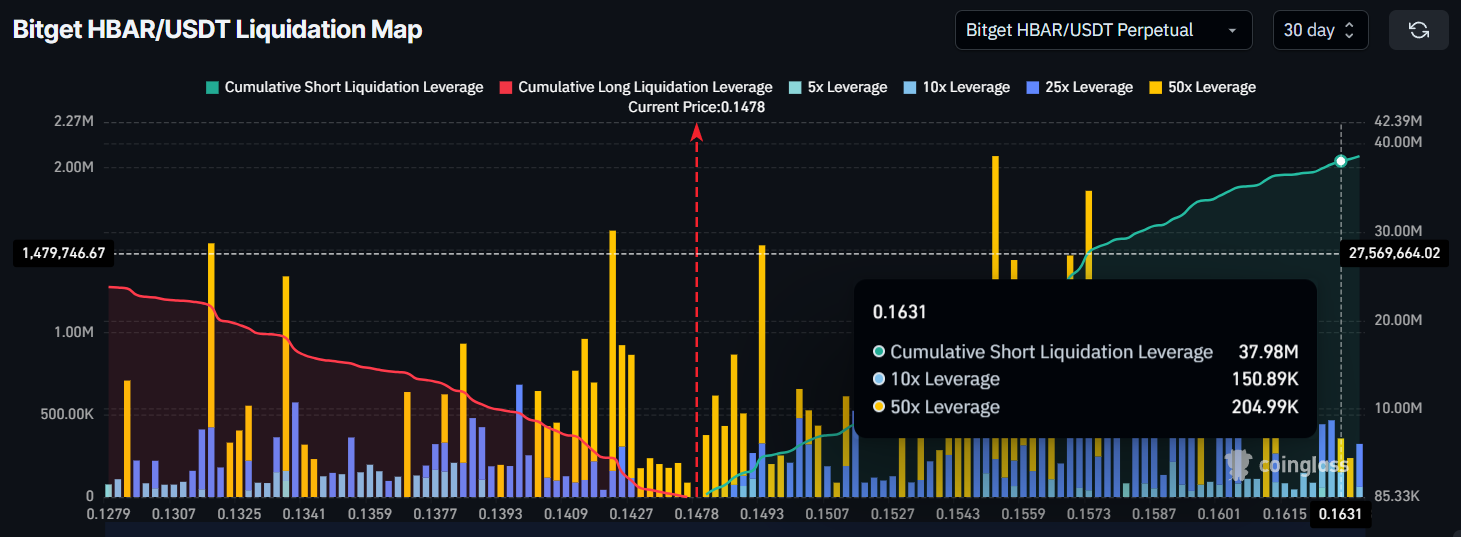
The macro momentum for HBAR reveals that short traders could face substantial losses if the price rises. The liquidation map indicates that approximately $38 million worth of short contracts could be liquidated if HBAR breaks its current downtrend and rises to $0.163.
This would have a significant impact on the market, potentially fueling further buying momentum.
Short traders have been betting on continued price declines, but a breakout above key resistance levels could force them to exit their positions. This would create additional buying pressure, supporting the potential for a larger upward move.
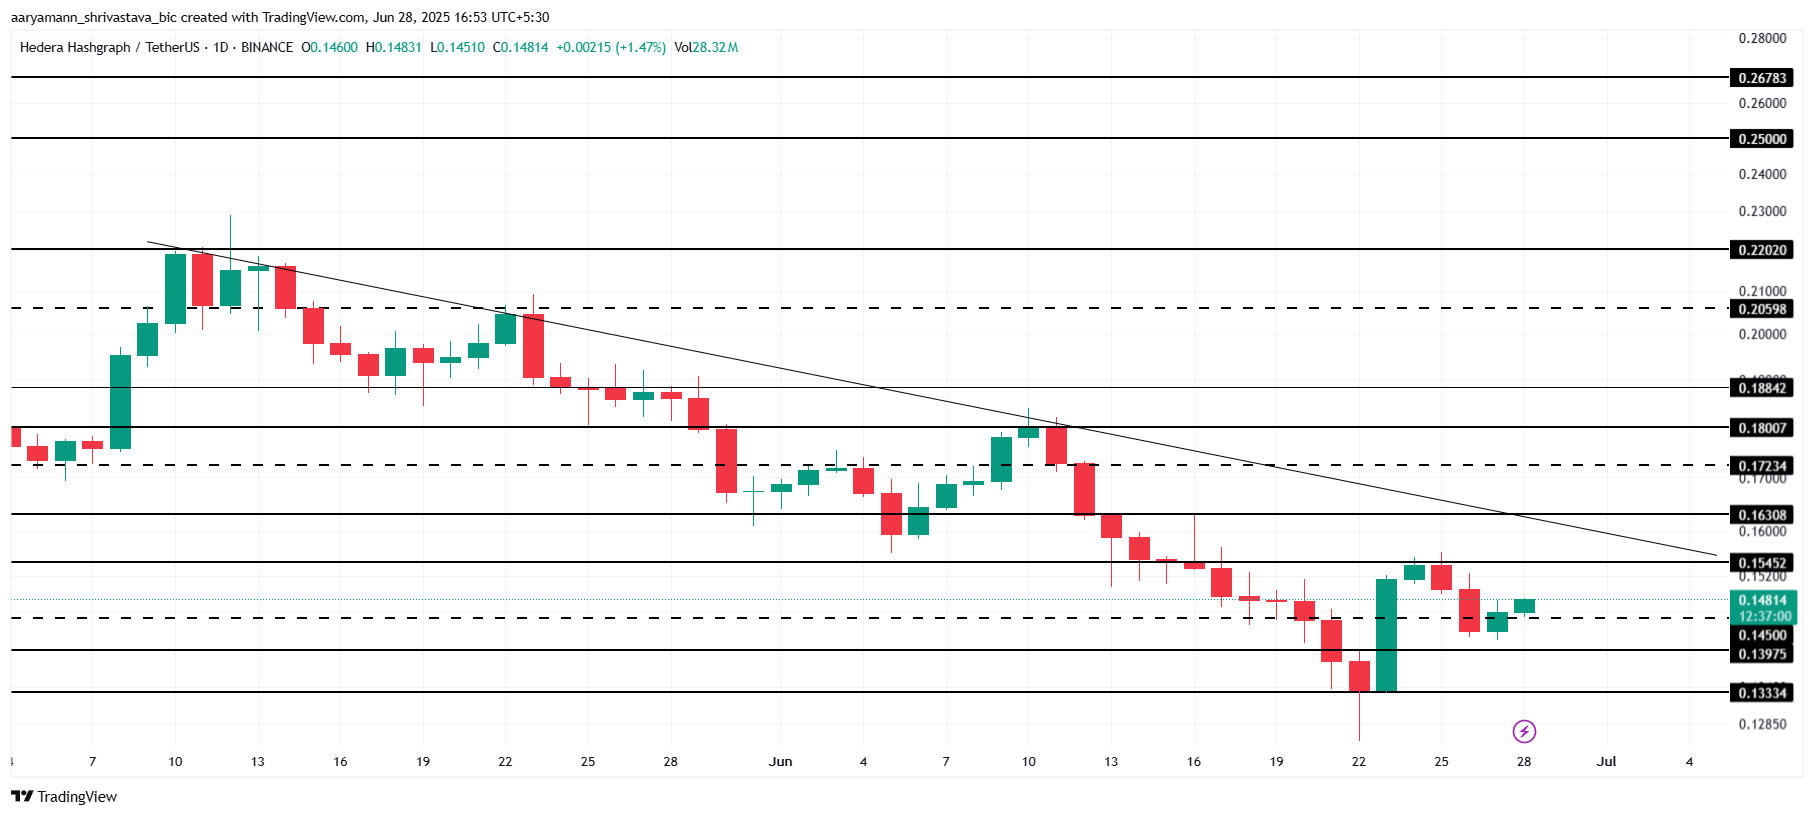
At the time of writing, HBAR is trading at $0.148, just under the critical resistance level of $0.154. The altcoin is looking to breach this resistance and break the downtrend line that has been holding it back.
A successful push past this level would be a key milestone in HBAR’s recovery.
The factors supporting a potential breakout indicate that HBAR could rise to $0.163 if it manages to flip $0.154 into support. Reaching this level could trigger the liquidation of short positions, further driving the price up.
This could help HBAR gain momentum and recover from its recent downtrend.
However, if the broader market turns bearish, HBAR’s price could fall to $0.139. Losing this support would be a bearish signal, potentially driving the price further down to $0.133.
Such a decline would invalidate the bullish thesis and shift the market outlook back toward the bears.