STX is today’s top performer, soaring nearly 20% in the past 24 hours. Alongside the price surge, the token’s trading volume has also spiked, signaling strong interest from investors.
However, despite the rally, on-chain data reveals a high demand for short positions among traders, suggesting doubts around the longevity of STX’s current uptrend.
Stacks (STX) Jumps 20%, But Bearish Traders Dominate
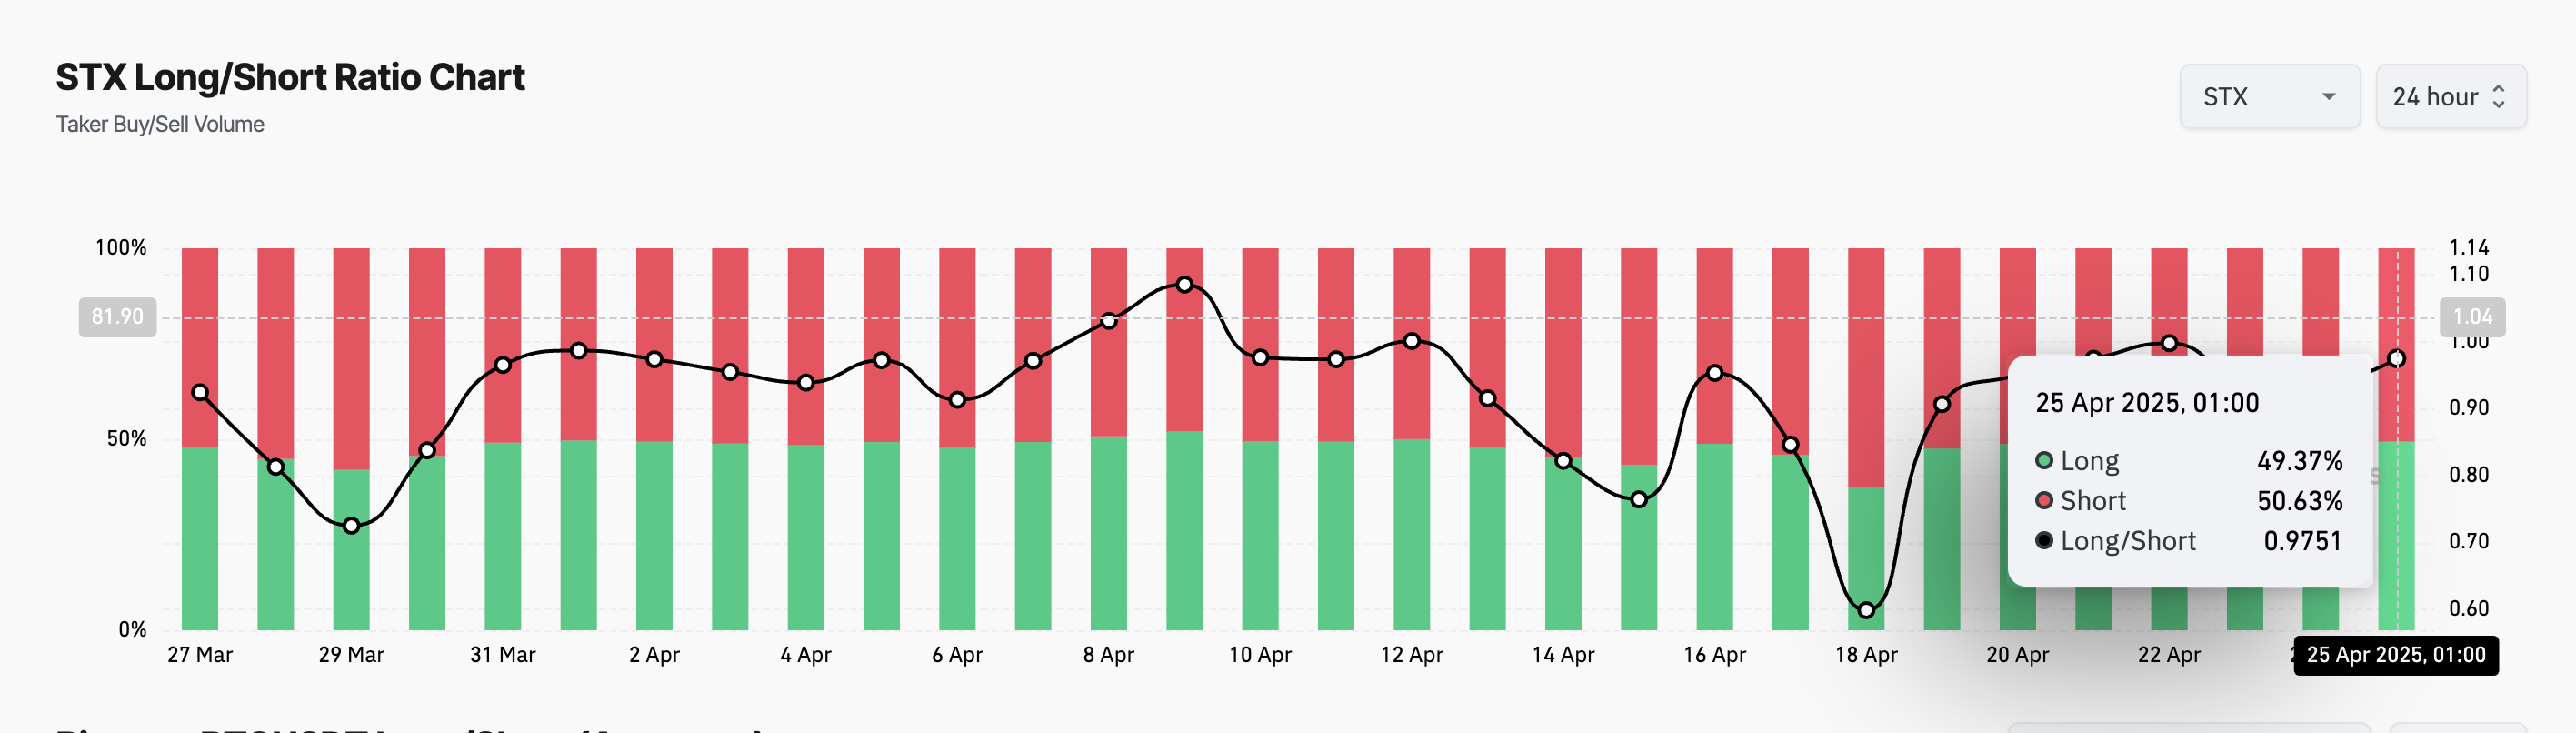
According to Coinglass, STX’s long/short ratio is currently at 0.97, signaling a preference for short positions among its futures market participants.
The long/short ratio measures the proportion of bullish (long) positions to bearish (short) positions in the market. When the ratio is above one, there are more long positions than short ones. This suggests bullish sentiment, with most traders expecting the asset’s value to rise.
Converesly, as with STX, a ratio below one indicates that more traders are betting on a price decline than on an increase. This suggests that many token holders are unimpressed by STX’s double-digit gains over the past day and anticipate a bearish reversal soon.
Moreover, STX’s overbought Relative Strength Index (RSI) supports this bearish outlook. At press time, this momentum indicator is at 74.35 and on an upward trend.
The RSI indicator measures an asset’s overbought and oversold market conditions. It ranges between 0 and 100, with values above 70 suggesting that the asset is overbought and due for a price decline. Converesly, values under 30 indicate that the asset is oversold and may witness a rebound.
Therefore, STX’s RSI reading confirms that altcoin might be overbought and could witness a price decline in the near term.
Can STX Defy Overbought Signals?
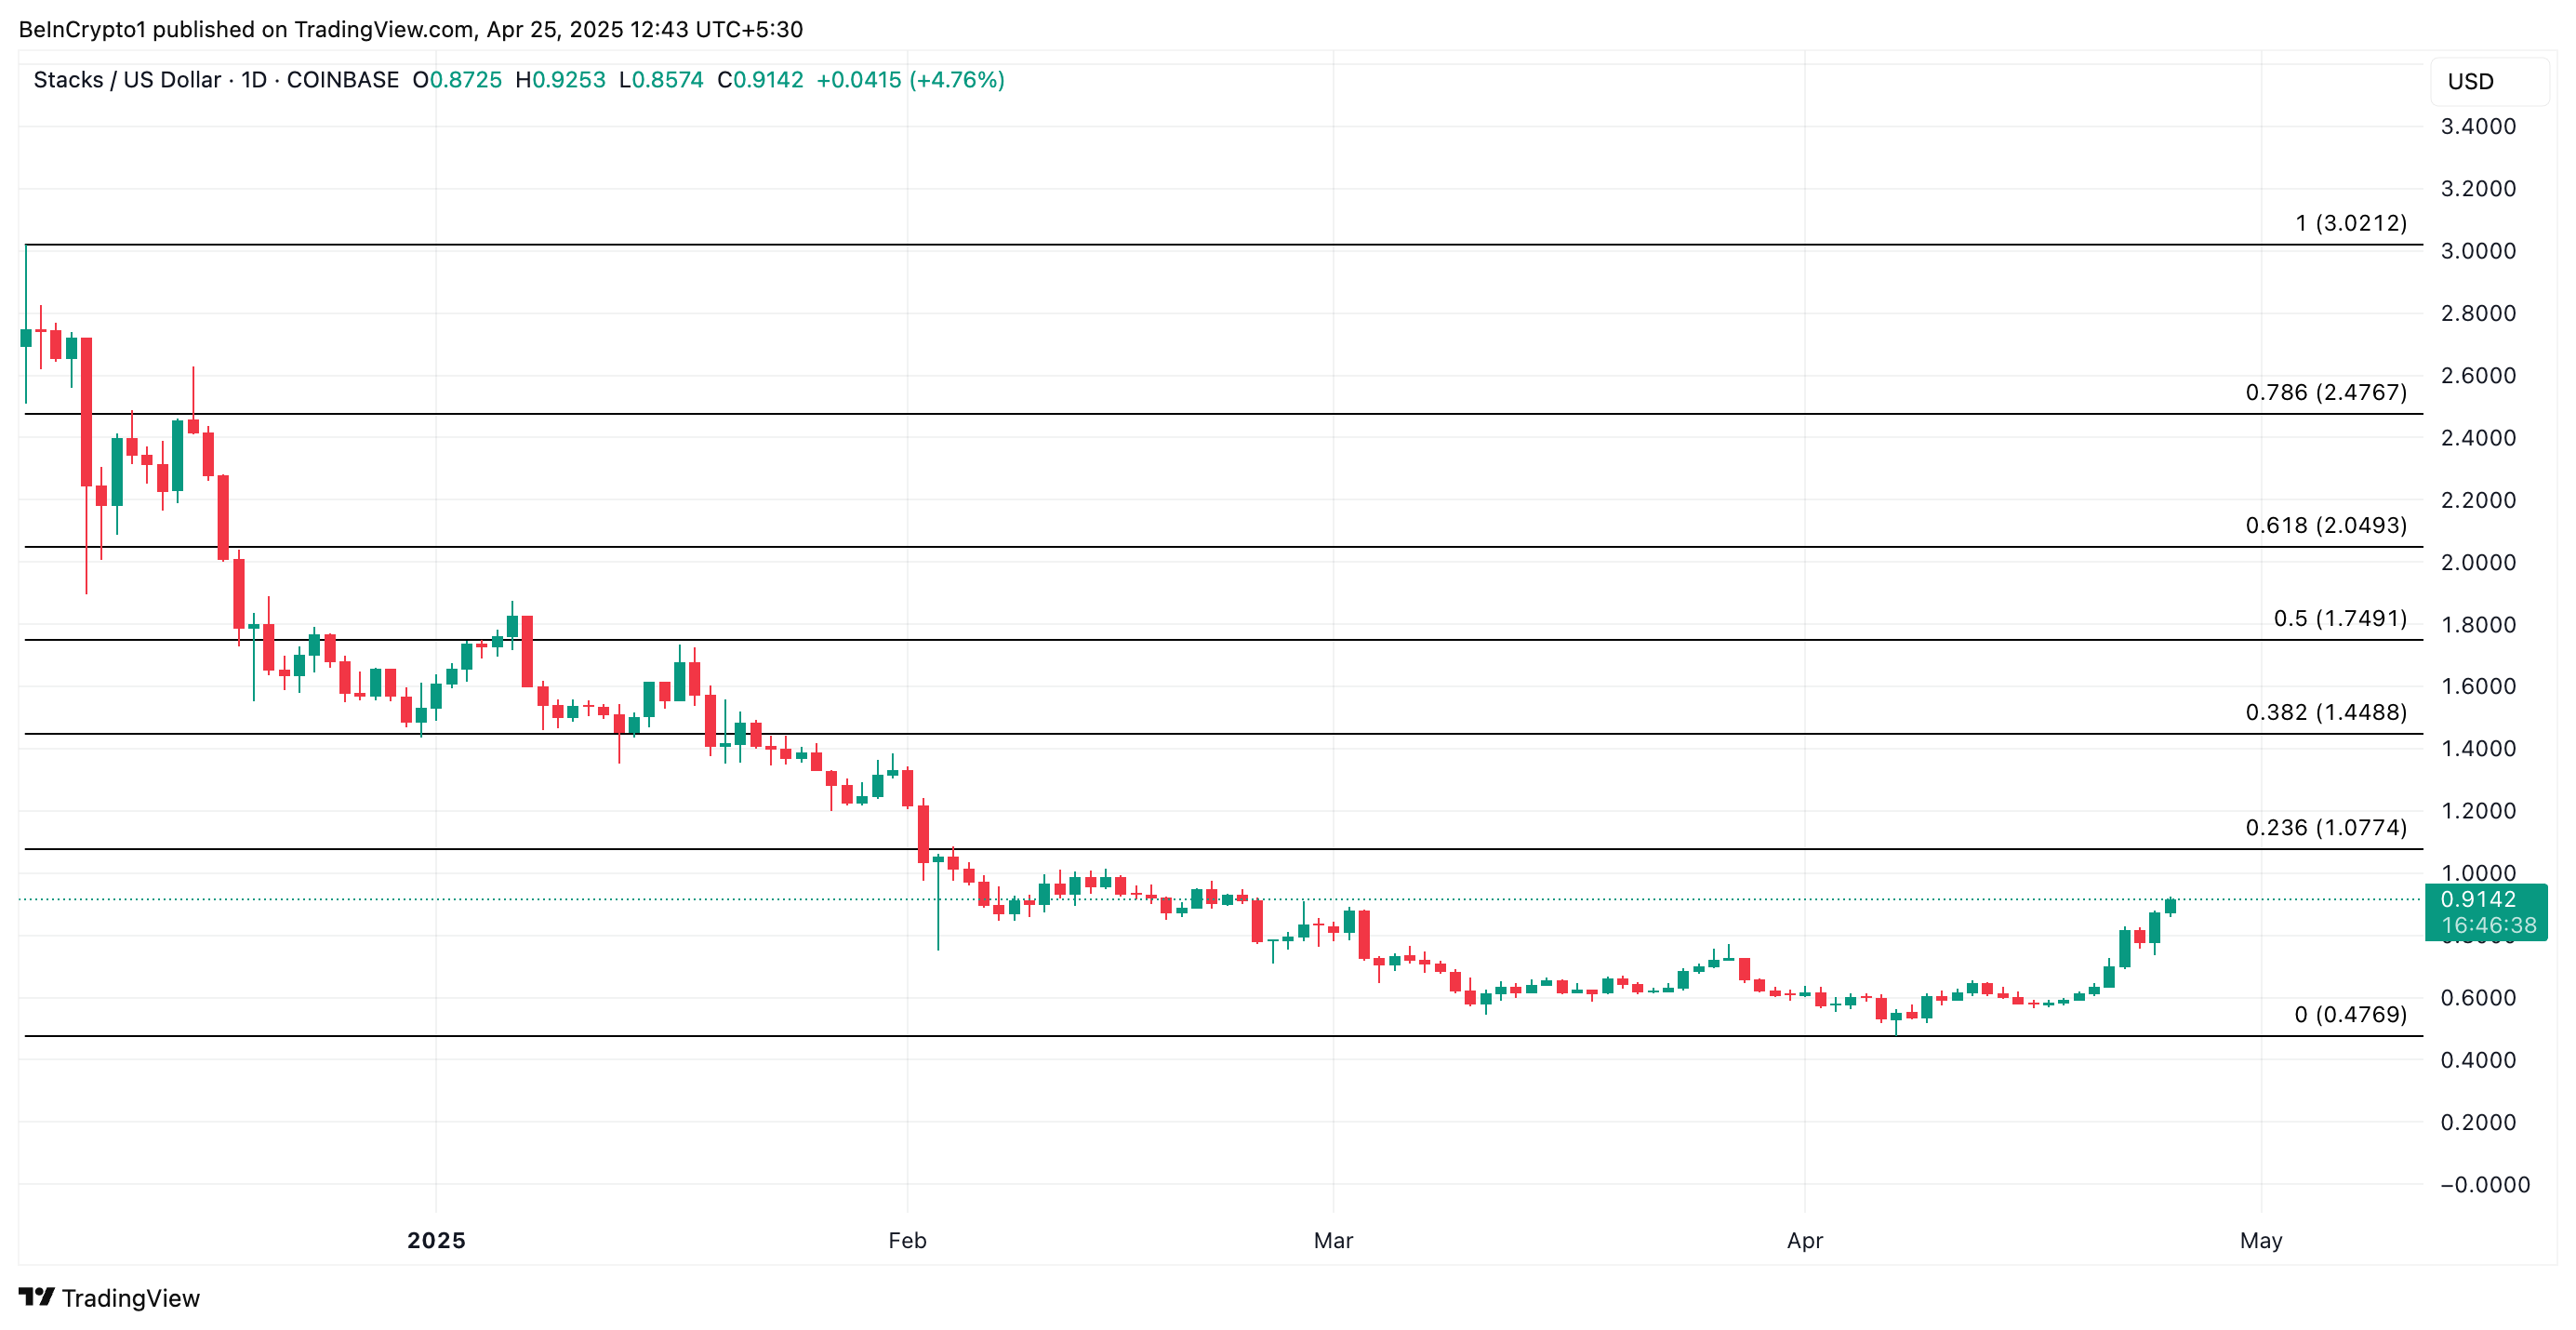
Once buyer exhaustion sets in, STX could shed some of its recent gains. In this scenario, the altcoin’s value could plunge to its year-to-date low of $0.47.
However, an RSI reading above 70 does not always signal an immediate reversal. Strong bullish momentum can sometimes sustain the rally, pushing prices even higher despite overbought conditions.
Bitcoin (BTC) reclaimed the $93,000 threshold during the early hours of the Asian session on Wednesday. The show of strength came after President Trump articulated his position about Federal Reserve (Fed) chair Jerome Powell’s replacement talks.
Over the past several months, the pioneer crypto has demonstrated increased correlation with broader economic and political issues. This suggests that macroeconomics is growing in influence on Bitcoin.
The report followed Treasury Secretary Scott Bessent’s announcement that the Trump administration was planning to interview candidates to replace Jerome Powell.
“The Fed would be much better off cutting rates as US Tariffs start to transition (ease!) their way into the economy. Do the right thing,” Trump wrote on Truth Social.
On the other hand, Powell insists on a cautious approach to monetary policy decisions, rejecting further interest rate cuts. The Fed also made significant downward revisions to its 2025 economic projections.
These opposing views fanned speculation that Jerome Powell’s job as Fed chair was at risk. In a recent development, however, Trump stated that he has no plans to fire Powell.
“I have no intention of firing him…I would like to see him be a little more active in terms of his idea to lower interest rates,” Reuters reported, citing Trump telling reporters in the Oval Office on Tuesday.
In the immediate aftermath, Bitcoin shattered past the $93,000 threshold. As of this writing, BTC was trading for $93,136, representing a surge of almost 6% in the last 24 hours.
Notably, there are about 13 months left in Jerome Powell’s tenure as chair of the Federal Reserve.
Bitcoin Benefits From Eroded Trust in Government
BitMEX founder and former CEO Arthur Hayes commented on the swift reaction to this topic on the Bitcoin price chart.
“Trump says he wants to fire JAYPOW – dollar dips, BTC rips Trump says he has no intention of firing JAYPOW – dollar rips, BTC rips some more,” Hayes quipped.
In tandem, Bitcoin rallied as investors viewed it as a potential hedge against a weakening dollar and inflationary pressures.
As Trump’s stances cause market volatility, fluctuations in the dollar are bullish for Bitcoin, reflecting its appeal as a hedge against traditional financial (TradFi) instability.
BeInCrypto reported this status in a recent US Crypto News publication, citing Geoff Kendrick, the Head of Digital Asset Research at Standard Chartered.
According to Kendrick, Bitcoin is increasingly seen as a hedge against TradFi and US Treasuries risks.
“I think Bitcoin is a hedge against both TradFi and US Treasury risks. The threat to remove US Federal Reserve Chair Jerome Powell falls into Treasury risk—so the hedge is on,” Kendrick told BeInCrypto.
Meanwhile, Nate Geraci, the president of the ETF Store, says Bitcoin is benefiting from the erosion of trust in governments and politicians, which is pushing people towards alternatives.
“Bitcoin is one of the biggest winners from events over the past several weeks IMO, at least from a philosophical standpoint. Further erosion of trust in governments and politicians will push people towards alternatives. Not saying that is good or bad, but think logically,” Geraci remarked.
In a keynote address at the SEC’s latest Crypto Roundtable, Paul Atkins commented on the Commission’s role in crypto policy. He identified three key regulatory focus areas: issuance, custody, and trading.
Compared with his last Roundtable appearance in late April, Atkins gave an insightful look at his ambitious crypto agenda. With these priorities, it seems like the SEC will truly transform US crypto policy.
“In order for the United States to be the ‘crypto capital of the planet’ as envisioned by President Trump, the Commission must keep pace with innovation. Rules and regulations designed for off-chain securities may be incompatible with or unnecessary for on-chain assets and stifle the growth of blockchain technology,” he claimed.
This discussion is Paul Atkins’ second Crypto Roundtable discussion since becoming SEC Chair. Today’s appearance, however, was very different.
Although his speech in April was remarkably brief, this keynote address was much more comprehensive. Atkins’ comments extended past tokenization to give insights into his overall outlook on crypto policy.
His comments revolved around a common theme: the digital asset industry is comprehensively different from TradFi institutions, and requires a new approach.
Atkins claimed that the SEC has the responsibility “to set fit-for-purpose standards for market participants.” To accomplish this, he identified three overarching areas of interest:
First, Atkins claimed that the SEC should enable crypto firms to explicitly issue securities contracts. Issuers have generally avoided the Howey Test, and Atkins mentioned that only four crypto companies currently have registered securities offerings.
He believes that the SEC “has broad discretion under the securities acts to accommodate the crypto industry” and intends to use it.
Secondly, Atkins wishes to direct the SEC to liberalize custody rules for cryptoassets. He plans to encourage more of them by reforming “qualified custodian” requirements and the broker-dealer framework.
This includes recognizing blockchain-based self-custody solutions and other high-tech approaches that don’t currently align with the law’s view of an asset custodian.
In a particularly important move, Atkins wants the SEC to allow more asset trading. This position manifests in a few ways. He doesn’t just advocate for single firms to offer both securities and commodities; Atkins would even allow “pairs trading,” matching both categories together.
His priority is keeping the securities market in the US, and he wants Congress to facilitate this.
In summary, Paul Atkins has very ambitious plans for the SEC’s crypto approach. Compared to his last Roundtable appearance, today’s keynote speech was practically a manifesto.
With this bold and clear-eyed leadership, it seems inevitable that the SEC will transform US crypto regulation for the better.
SUI meme coins are gaining major traction as the SUI ecosystem continues to strengthen. SUI DEX volume has surged to $3.8 billion over the past seven days, up 74%, making it the fifth-largest chain by decentralized trading volume and surpassing Arbitrum.
As interest in SUI grows, top meme coins like Sonic Snipe Bot (SONIC), LOFI, MEMEFI, MIU, and Fud the Pug (FUD) are showing a mix of strong momentum and key technical tests. The next few days could be crucial in deciding which tokens emerge as leaders in the fast-growing SUI meme coin space.
Sonic Snipe Bot (SONIC)
Sonic Snipe Bot is an automated trading tool built for lightning-fast trade executions. It is fully integrated into the Telegram application and stands out by offering support for 31 blockchain networks, including Sui, Ton, Injective, Solana, and Tron.
Sonic Snipe Bot also supports all major bonding curves, such as Movepump on Sui, making it a flexible and powerful option for traders looking to operate across multiple ecosystems without leaving Telegram.
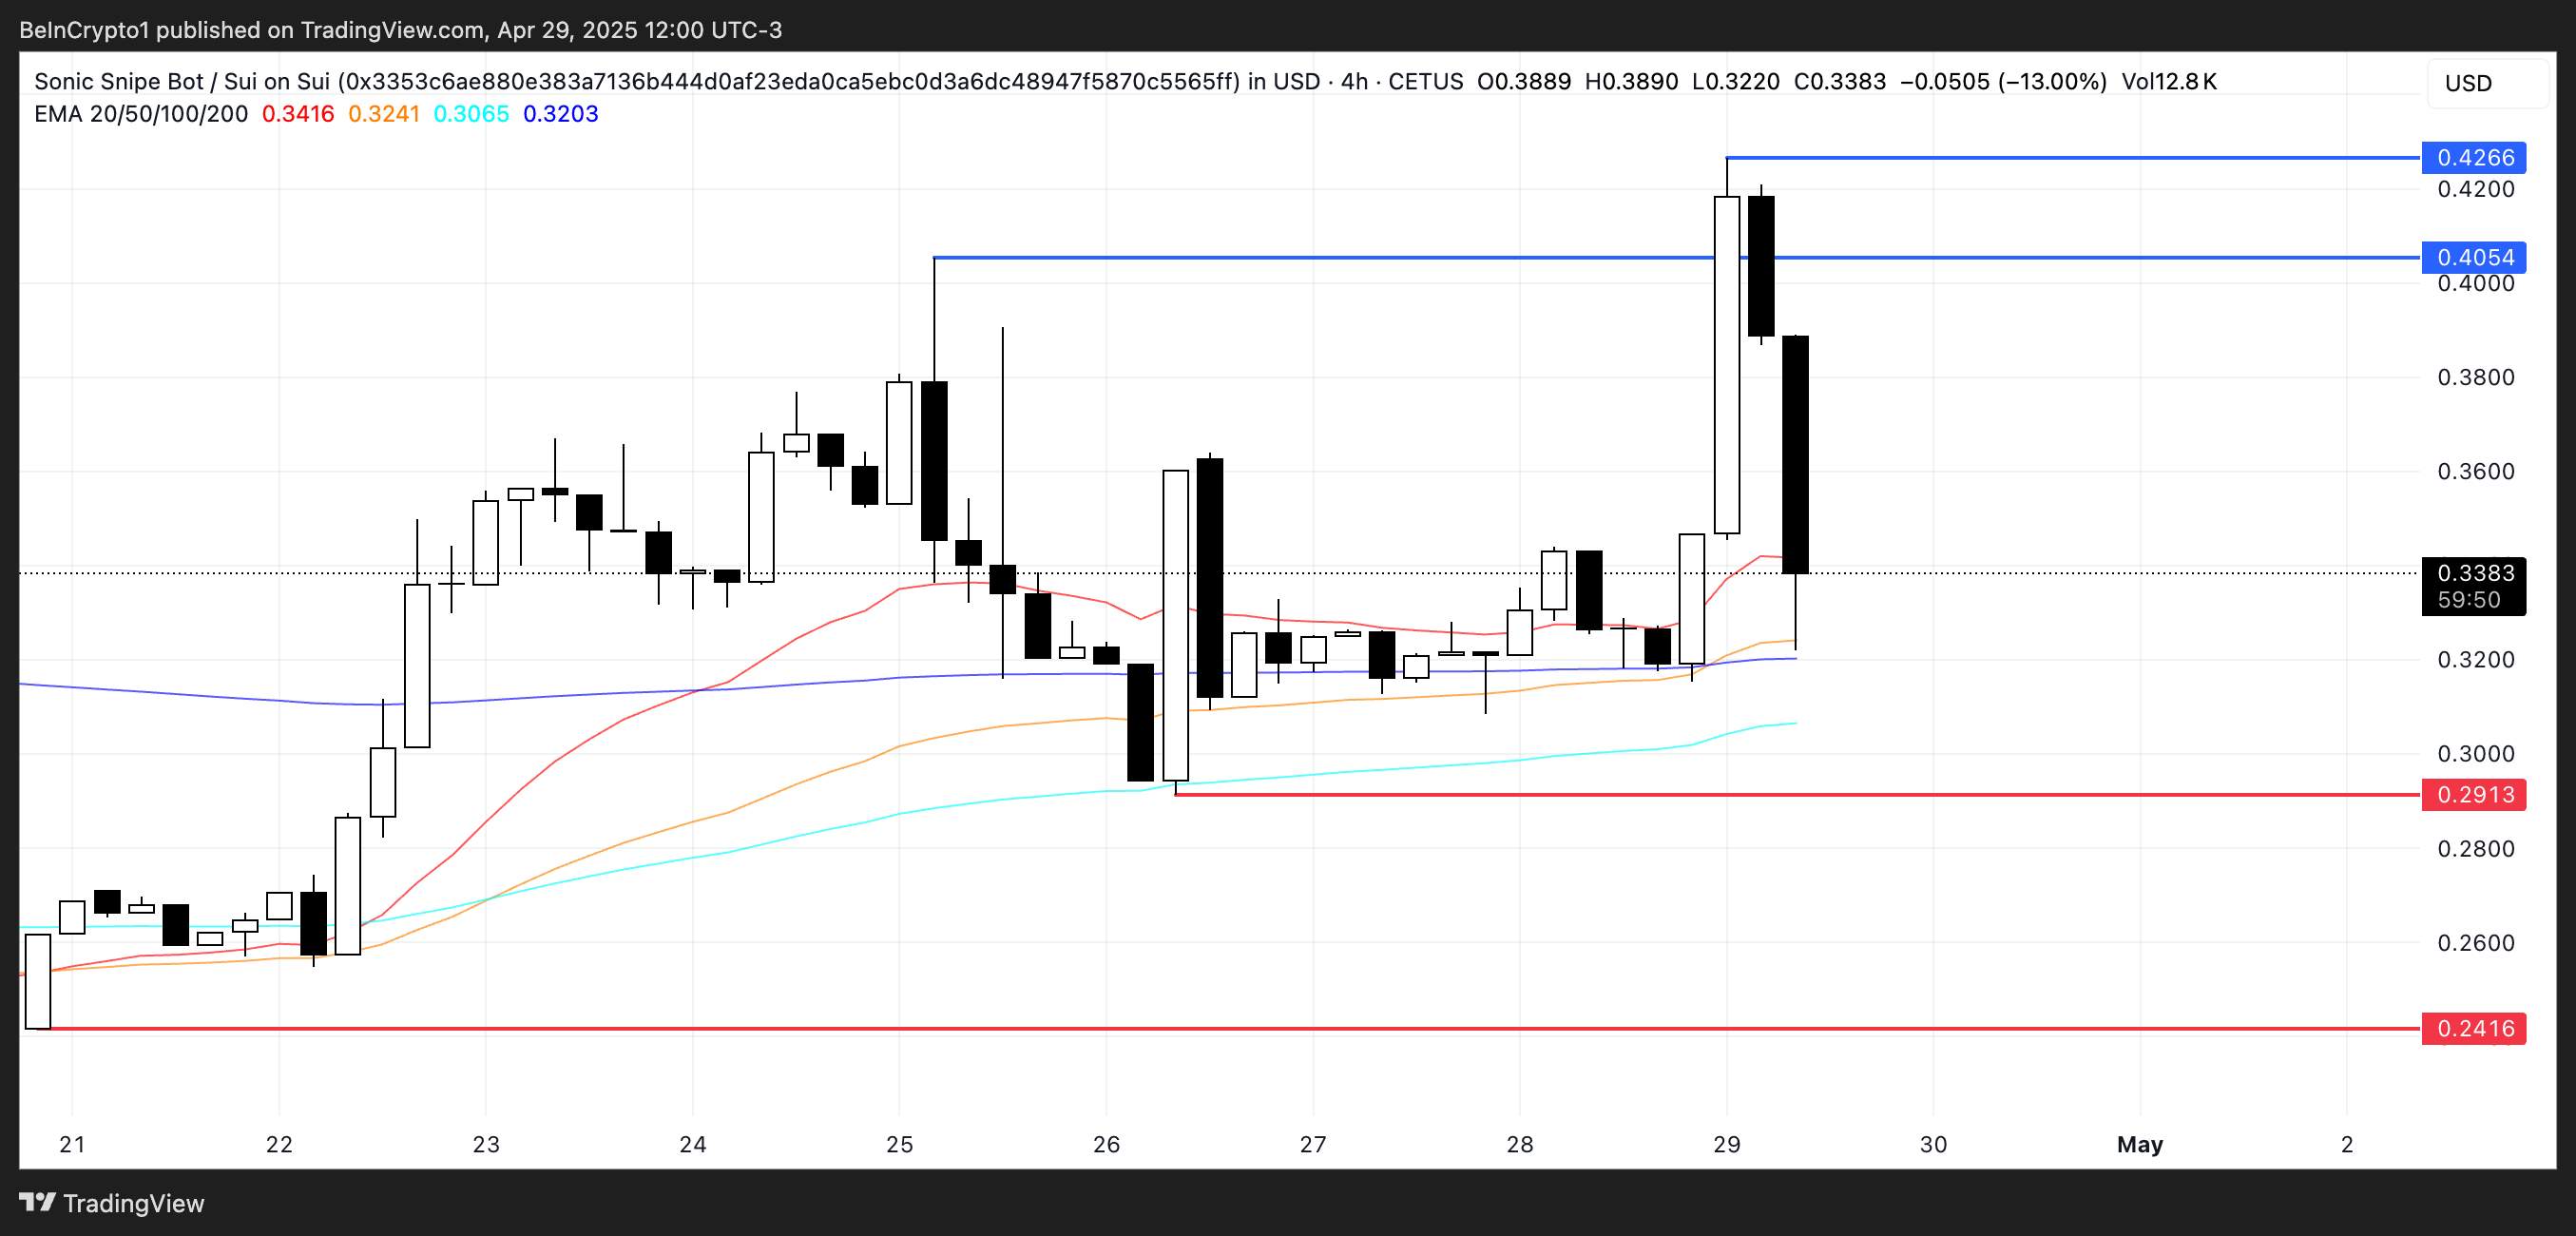
Over the past seven days, SONIC, the native token tied to the bot, has surged by 27%, pushing its market cap to approximately $1.7 million. If positive momentum continues, SONIC could rise above the $0.40 mark and potentially challenge the $0.426 level.
However, if the trend reverses and selling pressure builds, the token could fall back toward $0.29, and in a stronger downtrend, even $0.24 could be tested.
LOFI
LOFI is one of the biggest meme coins on the SUI blockchain, built around the theme of a Yeti character. Despite its strong brand and visibility, LOFI stands out for a less positive reason this week—it is the only token among the top 10 SUI meme coins that is down over the past seven days.
This relative underperformance could indicate weakening investor interest compared to its peers, or it could present a potential rebound opportunity if sentiment around SUI meme coins remains strong overall.
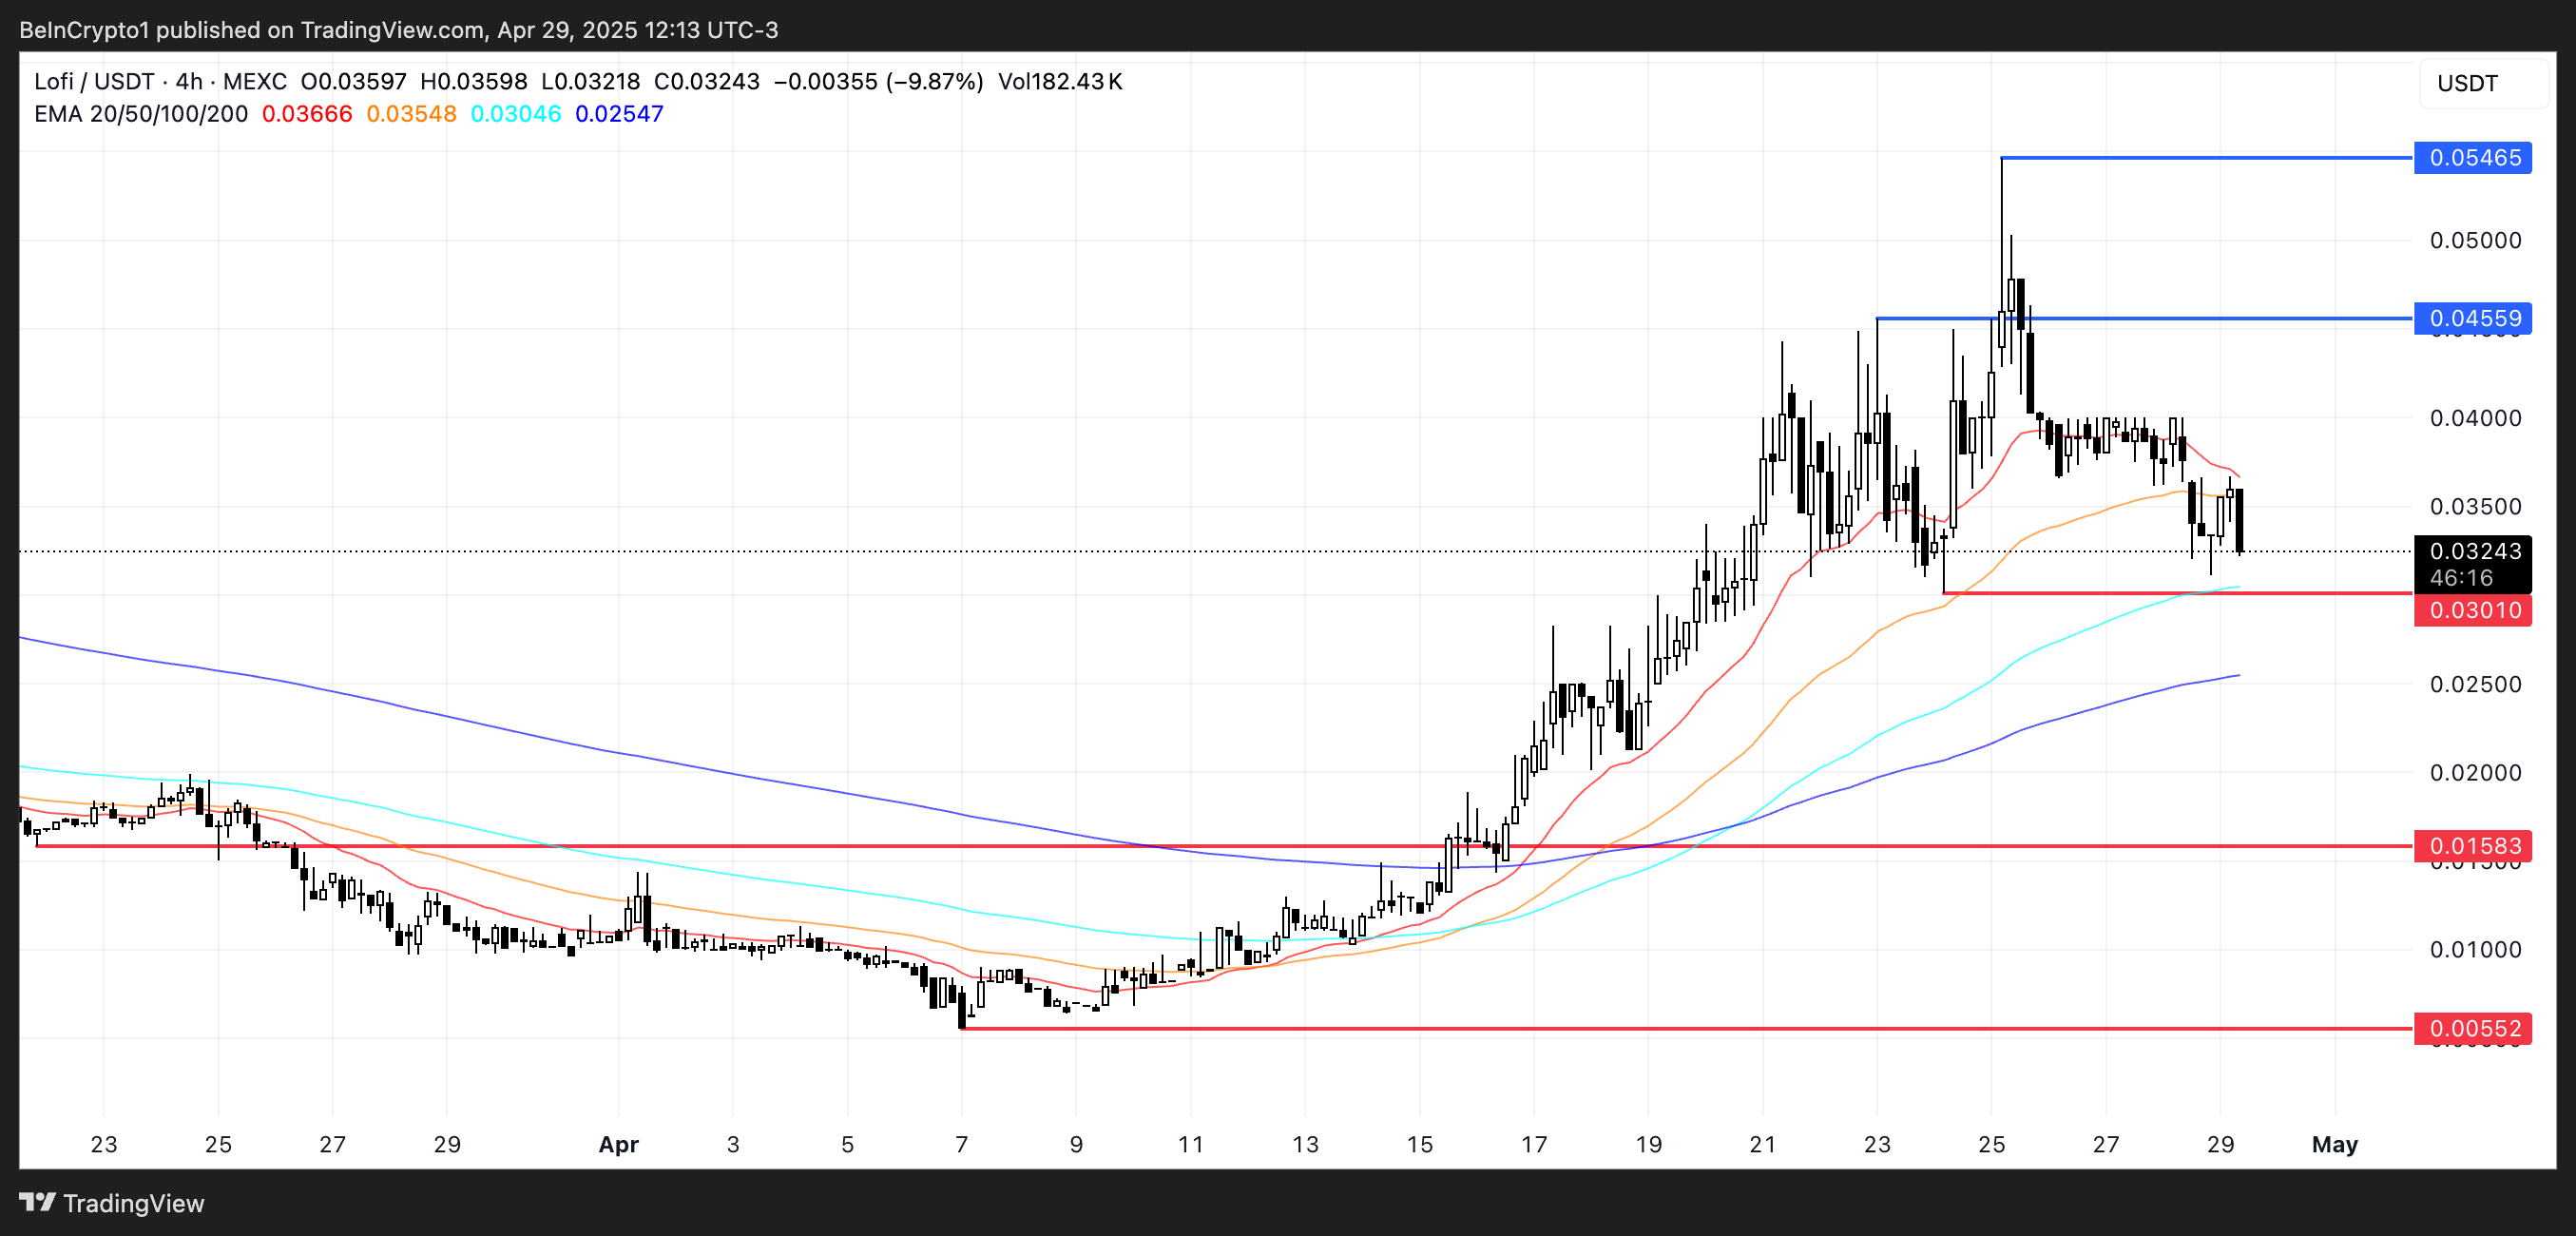
LOFI continues its push to become one of the most recognized meme projects on the SUI blockchain. If momentum recovers, LOFI could rise above the $0.045 mark and potentially challenge $0.054 in an extended rally.
However, the $0.030 support level remains critical. A break below this zone could trigger a steeper decline toward $0.0158, and if selling pressure accelerates, even $0.0055 could be tested.
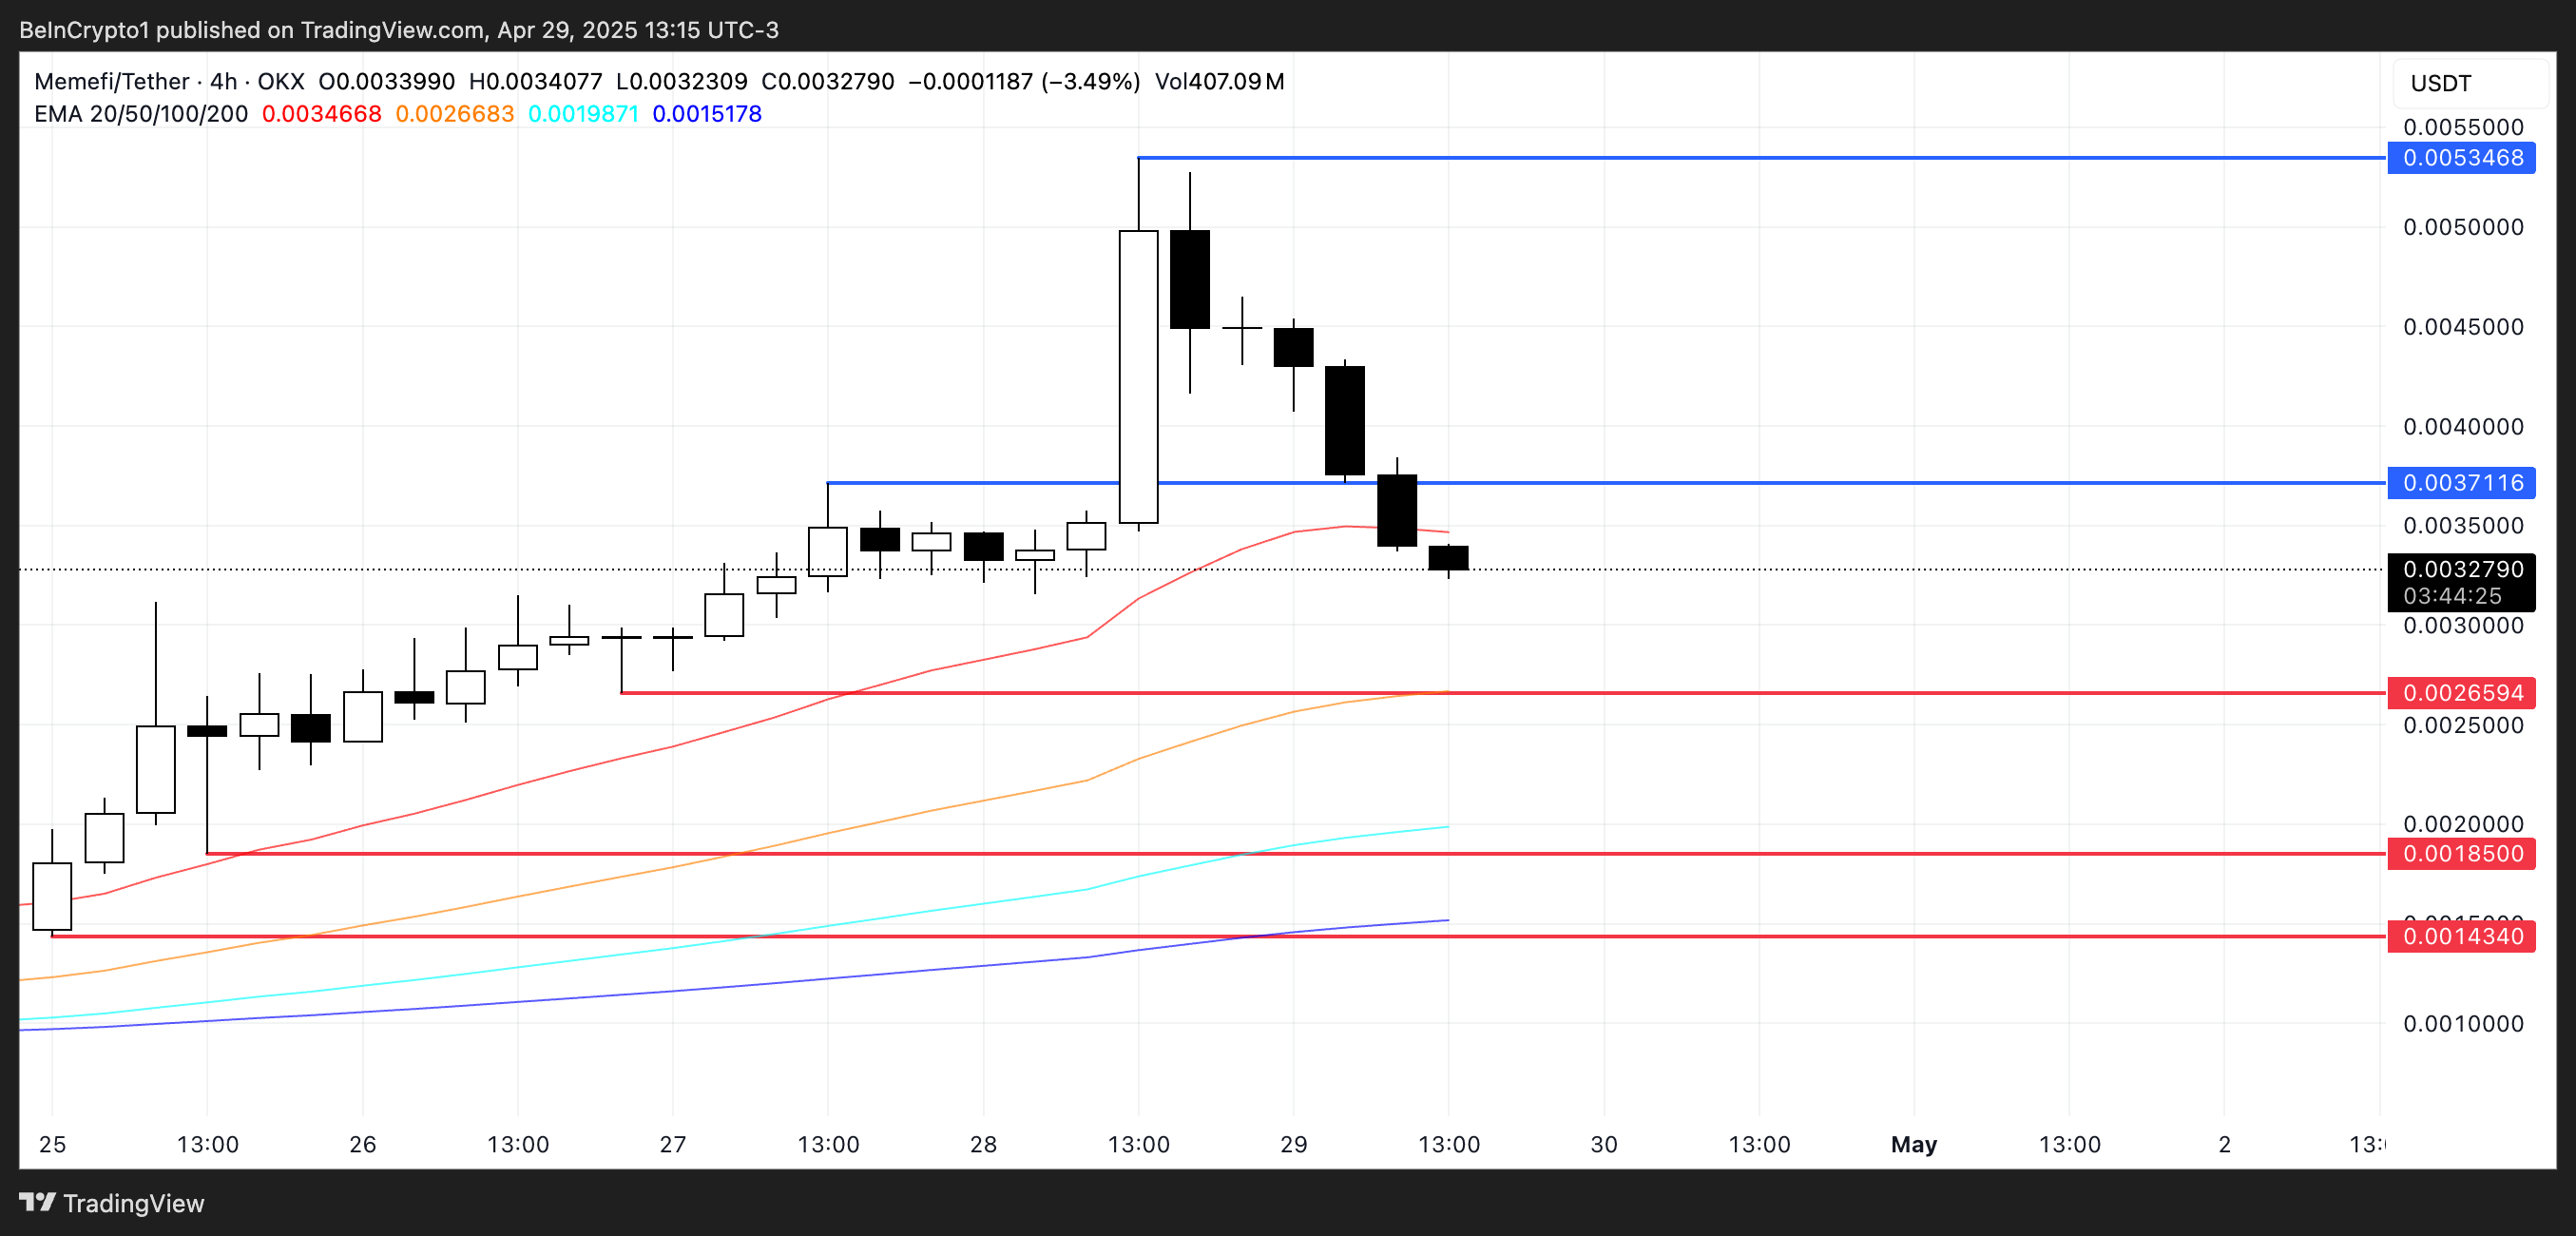
MemeFi (MEMEFI)
MEMEFI is a Telegram-based game and Web3 meme universe that claims to have more than 50 million players worldwide. It has quickly climbed the ranks and is now the second-largest SUI meme coin by market cap, currently at $35 million.
This marks a sharp pullback from its peak of $51 million reached just yesterday, reflecting the recent correction underway.
Despite the decline, MEMEFI is still up an impressive 353% over the past seven days.
If MEMEFI can regain its bullish momentum, it could first aim to break above the resistance at $0.0037. A successful breakout would open the path toward $0.0053, potentially extending its rally.
However, if the ongoing correction deepens, the first major support to watch is at $0.0026. A break below that could push the price further to $0.00185; if selling pressure intensifies, even $0.00143 could come into play.
MIU
MIU is currently the biggest meme coin on the SUI network, boasting a market cap of $68 million. Its price has climbed 16.7% over the past seven days, reinforcing its leadership position within the growing SUI meme coin ecosystem.
MIU is by far the largest meme coin in this space, with no close competitors matching its size or visibility. As the broader SUI ecosystem gains momentum and attracts more attention, MIU could continue to benefit from the overall surge in interest.
As the dominant player, it stands in a strong position to ride the next wave of growth if the trend across SUI meme coins remains positive.
If the positive momentum around MIU continues, the token could rise to test the $0.000000080 level, marking a new short-term target.
However, if the trend weakens and selling pressure emerges, MIU could first fall toward support at $0.0000000689. A deeper correction could even push the price down to $0.0000000599.
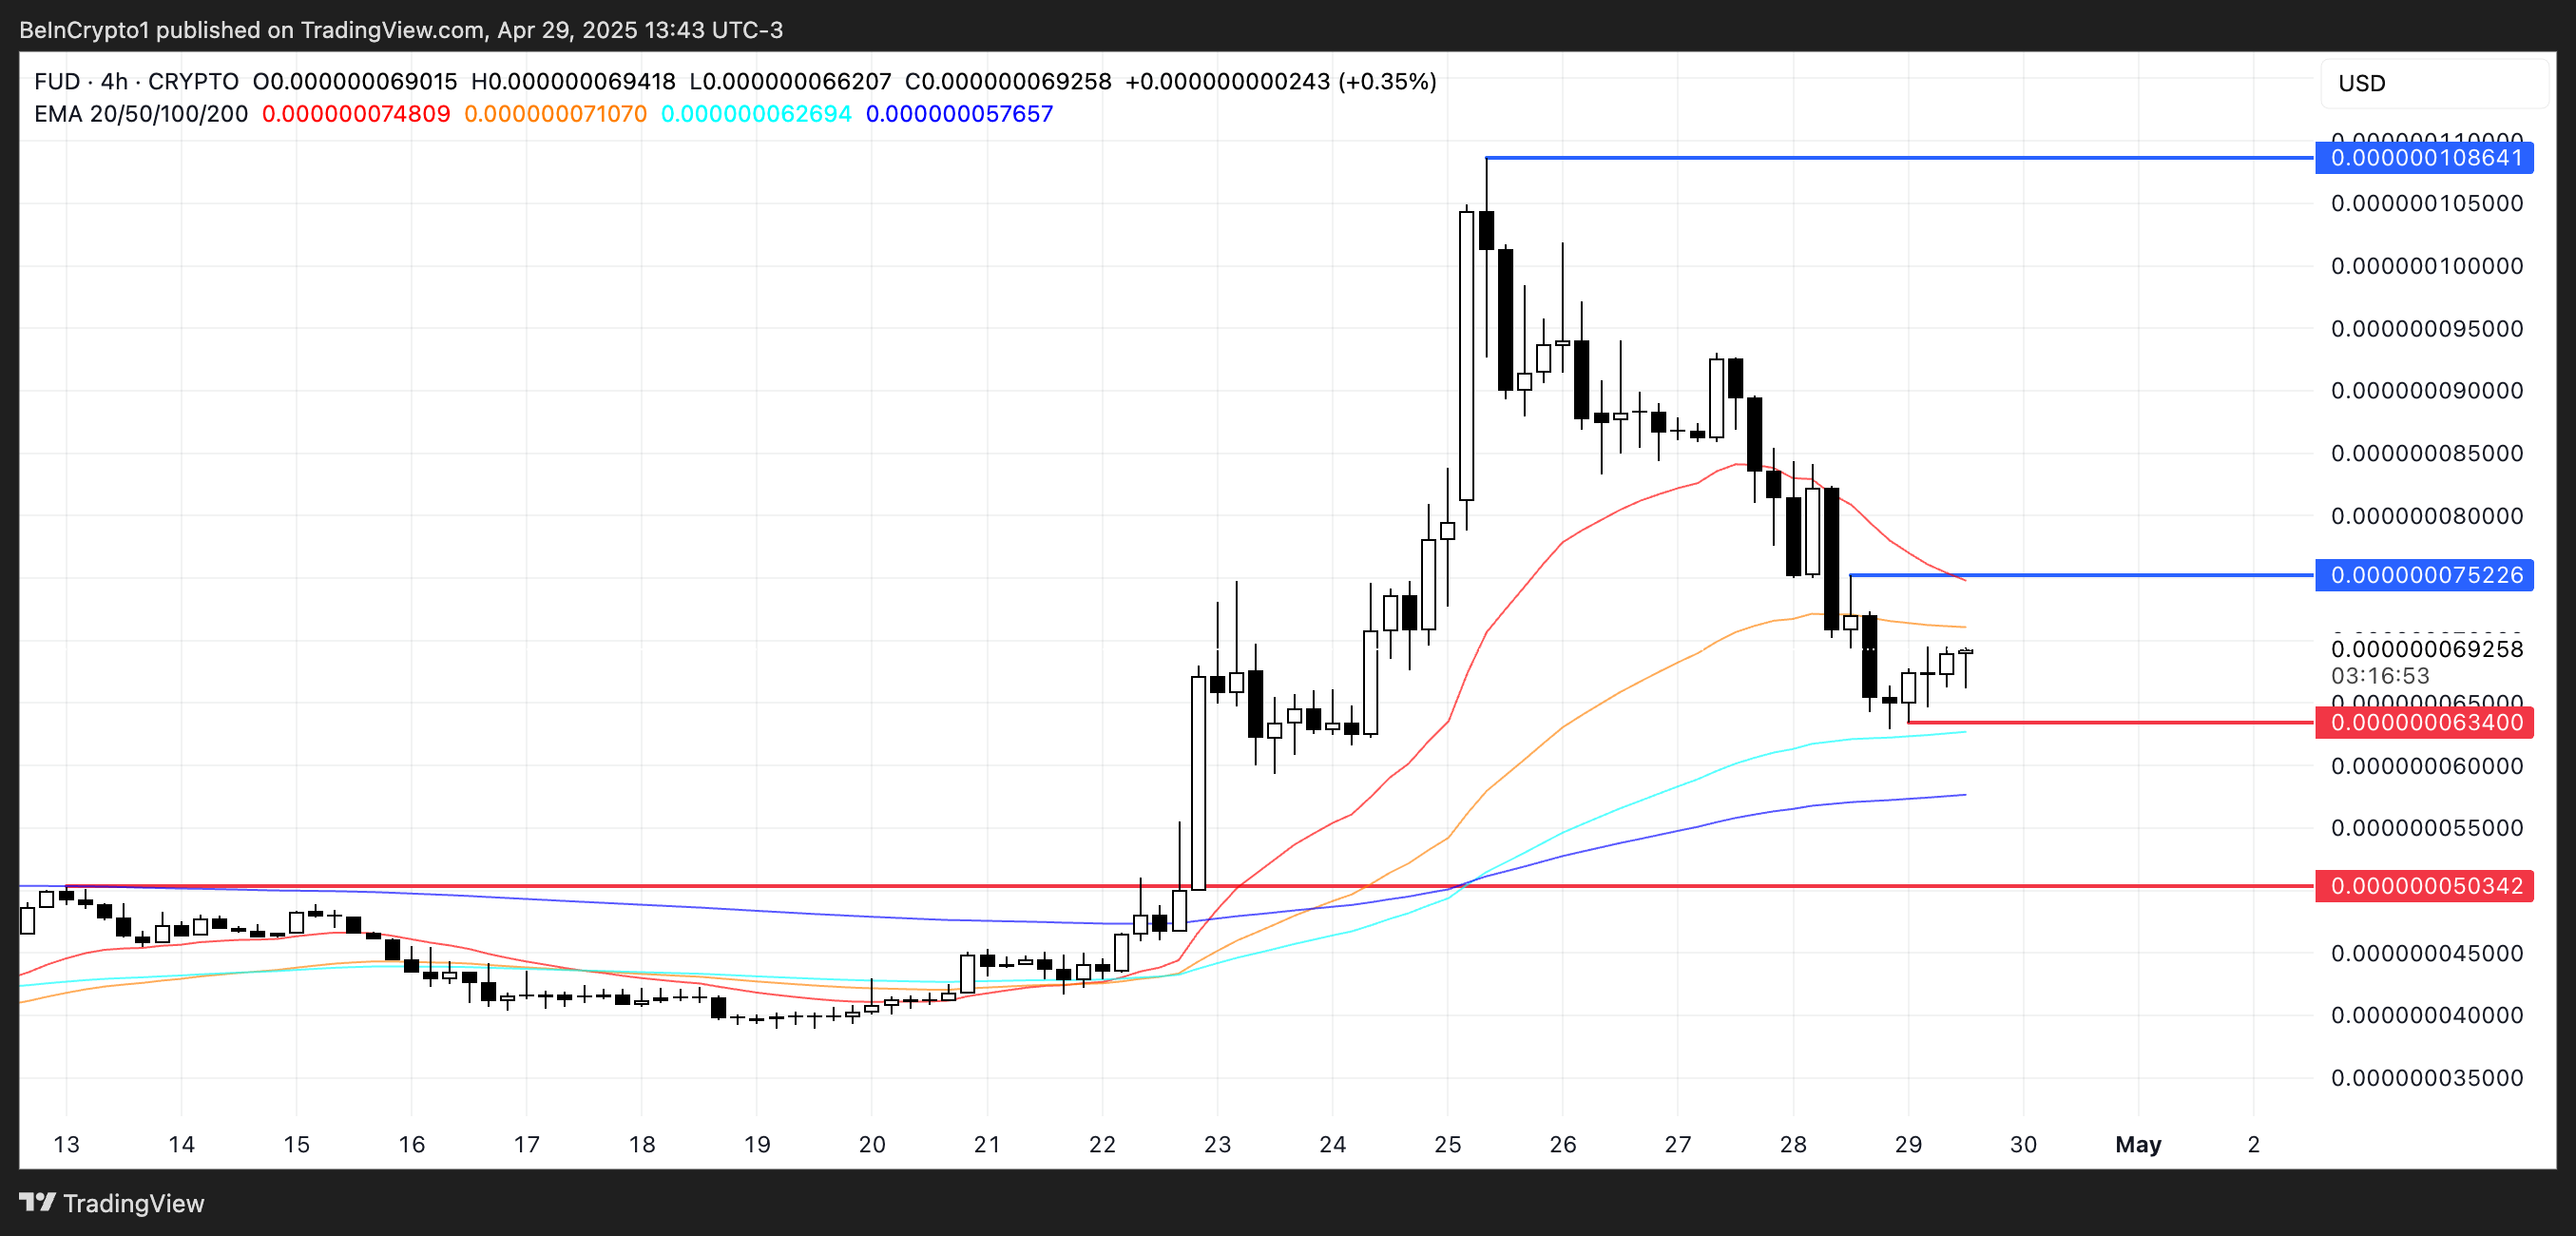
Fud the Pug (FUD)
This one is another meme coin aiming to carve out a leading spot in the growing SUI meme coin ecosystem. FUD currently holds a market cap of $3.8 million, down from its peak of $5.9 million just two days ago.
Despite a nearly 5% drop over the last 24 hours, FUD remains up an impressive 41% over the past seven days, highlighting strong underlying momentum.
Technically, FUD recently tested the support level at $0.0000000634. If this level is tested again and fails to hold, the next downside target would be around $0.000000050.
On the upside, if the current pullback stabilizes and momentum returns, FUD could rise to challenge resistance at $0.000000075. A breakout above that could pave the way for a push toward $0.00000010.
With dog-based meme coins often attracting outsized attention and hype, FUD could have a strong chance to expand its market presence if broader interest in SUI meme coins continues to grow.