Square has launched Square Handy, a compact and durable mobile POS terminal designed for Japan’s digital economy. Weighing just over 300g with an IP54 rating, Square Handy supports payment processing, inventory management, and order acceptance via a 6.2-inch touchscreen. Ideal for busy retail and restaurant environments, it integrates with Square’s POS app for seamless operations. Available now for ¥44,980, the device aims to boost efficiency and flexibility for businesses adapting to cashless, digital-first workflows.
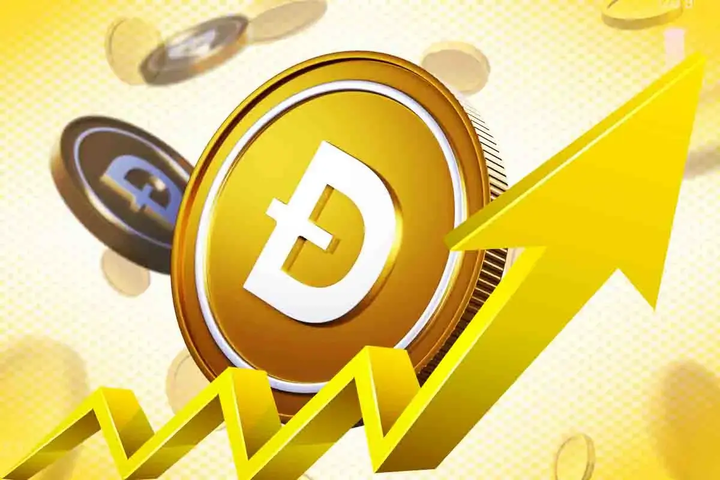
Dogecoin charts show formation of bullish “Adam and Eve” double bottom pattern, a market structure that precedes a major breakout. This pattern emerged on the weekly chart and follows a notable DOGE price gain of 6.69% over the past seven days. The on chain metrics and other factors support this breakout. Is A Dogecoin Breakout to $1 Next? Dogecoin price targets an 88.97% breakout toward $1.08 as it completes a rare Adam and Eve double bottom on the weekly chart. The meme coin is consolidating near $0.228, following a rounded Eve bottom from mid-2022 to late 2024, and a sharp retracement and spike forming the v-shaped Adam structure in early 2025. The Adam and Eve pattern is a bottoming structure that typically marks the end of a prolonged downtrend. It comprises two distinct troughs — a rounded “Eve” followed by a steep “Adam”, which usually signals a shift in momentum… Read More at Coingape.com
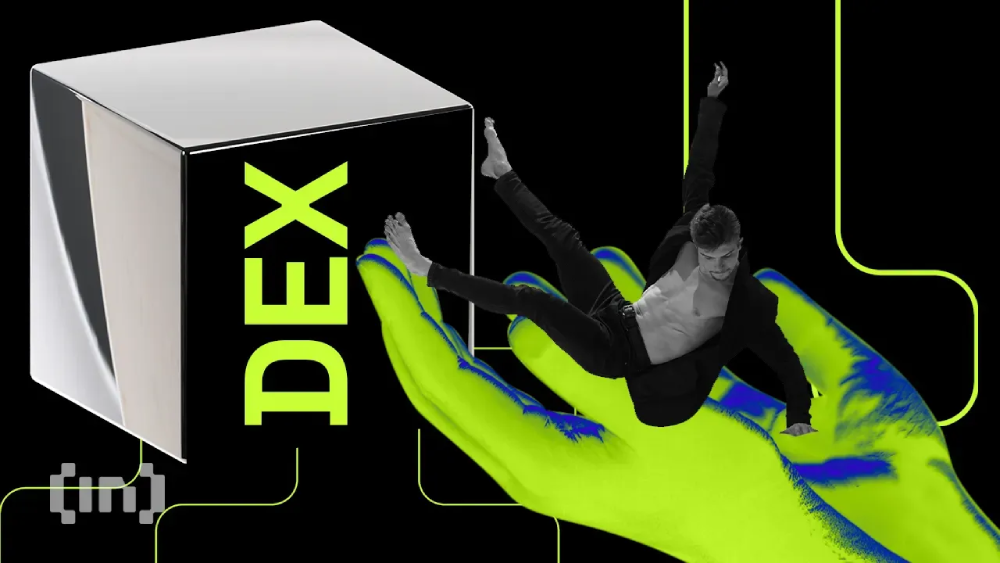
Bybit, one of the world’s leading centralized crypto exchanges, is preparing to enter the decentralized finance (DeFi) space with the launch of Byreal, its first on-chain trading platform.
The platform will go live on the Solana network, with its testnet debut set for June 30 and the mainnet launch expected in the third quarter of this year.
Byreal aims to offer users a seamless experience with CEX-level liquidity, rapid execution, and low slippage, all while preserving the transparency and autonomy native to DeFi.
Byreal incorporates features like Request for Quote (RFQ) and Concentrated Liquidity Market Maker (CLMM) routing to achieve this.
These tools are designed to shield users from maximal extractable value (MEV) attacks and provide more efficient price execution.
Byreal will also roll out innovative features to improve user access and token distribution. These include the “Reset Launch” mechanism, which uses Smart Price Laddering and the Faishare Engine to ensure fairer token allocations.
Additionally, the DEX will include a Revive Vault, offering curated yield opportunities for assets such as bbSOL and other Solana-based tokens.
Bybit CEO Ben Zhou described Byreal as a critical step in the company’s vision of hybrid finance—an emerging model that combines the advantages of centralized and decentralized exchanges.
Announcing Byreal — our first onchain DEX incubated by Bybit, will be LIVE by end of the month. Starting from scratch and now born on Solana. what’s special: 1/ CEX + DEX synergy Byreal isn’t “just another DEX.” It’s combining CEX-grade liquidity with DeFi-native transparency.… https://t.co/JU60e4zHQ4
Bybit’s move sets it apart from competitors like Coinbase and Kraken, which have concentrated efforts on Layer 2 solutions. Instead, Bybit is positioning Byreal to go head-to-head with leading DEX platforms such as Uniswap, PancakeSwap, and Hyperliquid.
On June 3, the Latvian Cabinet approved Bill No. 24-TA-3148, a major step toward aligning the country’s tax laws with the Crypto Asset Reporting Framework (CARF) and the EU’s DAC8 directive. The new legislation introduces stricter reporting and due diligence rules for crypto asset service providers and will come into effect on January 1, 2026.
Key Highlights of Latvia’s New Crypto Regulation
DAC8 Directive Implementation: The bill incorporates Directive 2023/2226/EU (DAC8), which mandates detailed reporting standards for crypto service providers to prevent tax evasion and crypto-related financial fraud.
Automatic Data Exchange: Aligned with the Multilateral Competent Authority Agreement (MCAA), the new framework enables cross-border financial data sharing for better transparency under CARF.
Stricter Reporting Obligations: The Common Reporting Standard (CRS) and CARF now extend to crypto, requiring service providers to report on crypto assets, swaps, and electronic money products, including central bank digital currencies (CBDCs).
Non-Compliance Penalties: Failure to meet the reporting requirements can result in fines of up to EUR 14,000 (~$16,026).
New Definitions Introduced: The bill formally defines reportable crypto assets and crypto swaps, plugging critical gaps in earlier regulations that allowed for loopholes in taxation.
EU-Wide Adoption Deadline: All EU Member States must publish their DAC8-compliant rules by December 31, 2025.
The new crypto bill aims to increase transparency and cooperation across the EU by ensuring all crypto transactions, including indirect investments, fall under international reporting standards.
CARF also expands CRS coverage to include digital wallets and stablecoins, aligning with the OECD’s global push for crypto regulation.
Latvia’s Vision: A Blockchain Powerhouse
Latvia is rapidly emerging as a hub for crypto and blockchain innovation. According to the Ministry of Economics:
Around 20 new blockchain startups are setting up operations in the country.
Established names like Paybis reflect the growing confidence in Latvia’s crypto-friendly ecosystem.
With a clear regulatory roadmap, Latvia is positioning itself to lead in Web 3.0 development, attracting global talent and investment in blockchain technology.
Never Miss a Beat in the Crypto World!
Stay ahead with breaking news, expert analysis, and real-time updates on the latest trends in Bitcoin, altcoins, DeFi, NFTs, and more.
The post Latvia Approves New Crypto Tax Bill, Sets 2026 Deadline for DAC8 Compliance appeared first on Coinpedia Fintech News
On June 3, the Latvian Cabinet approved Bill No. 24-TA-3148, a major step toward aligning the country’s tax laws with the Crypto Asset Reporting Framework (CARF) and the EU’s DAC8 directive. The new legislation introduces stricter reporting and due diligence rules for crypto asset service providers and will come into effect on January 1, 2026. …