Solana’s price has gained significant momentum over the past week. It has risen by 10% amid the improving sentiment across the broader cryptocurrency market.
This renewed optimism has propelled the coin upward, and with bullish momentum gaining strength, SOL appears poised for a sustained rally.
Market Momentum Turns in Solana’s Favor
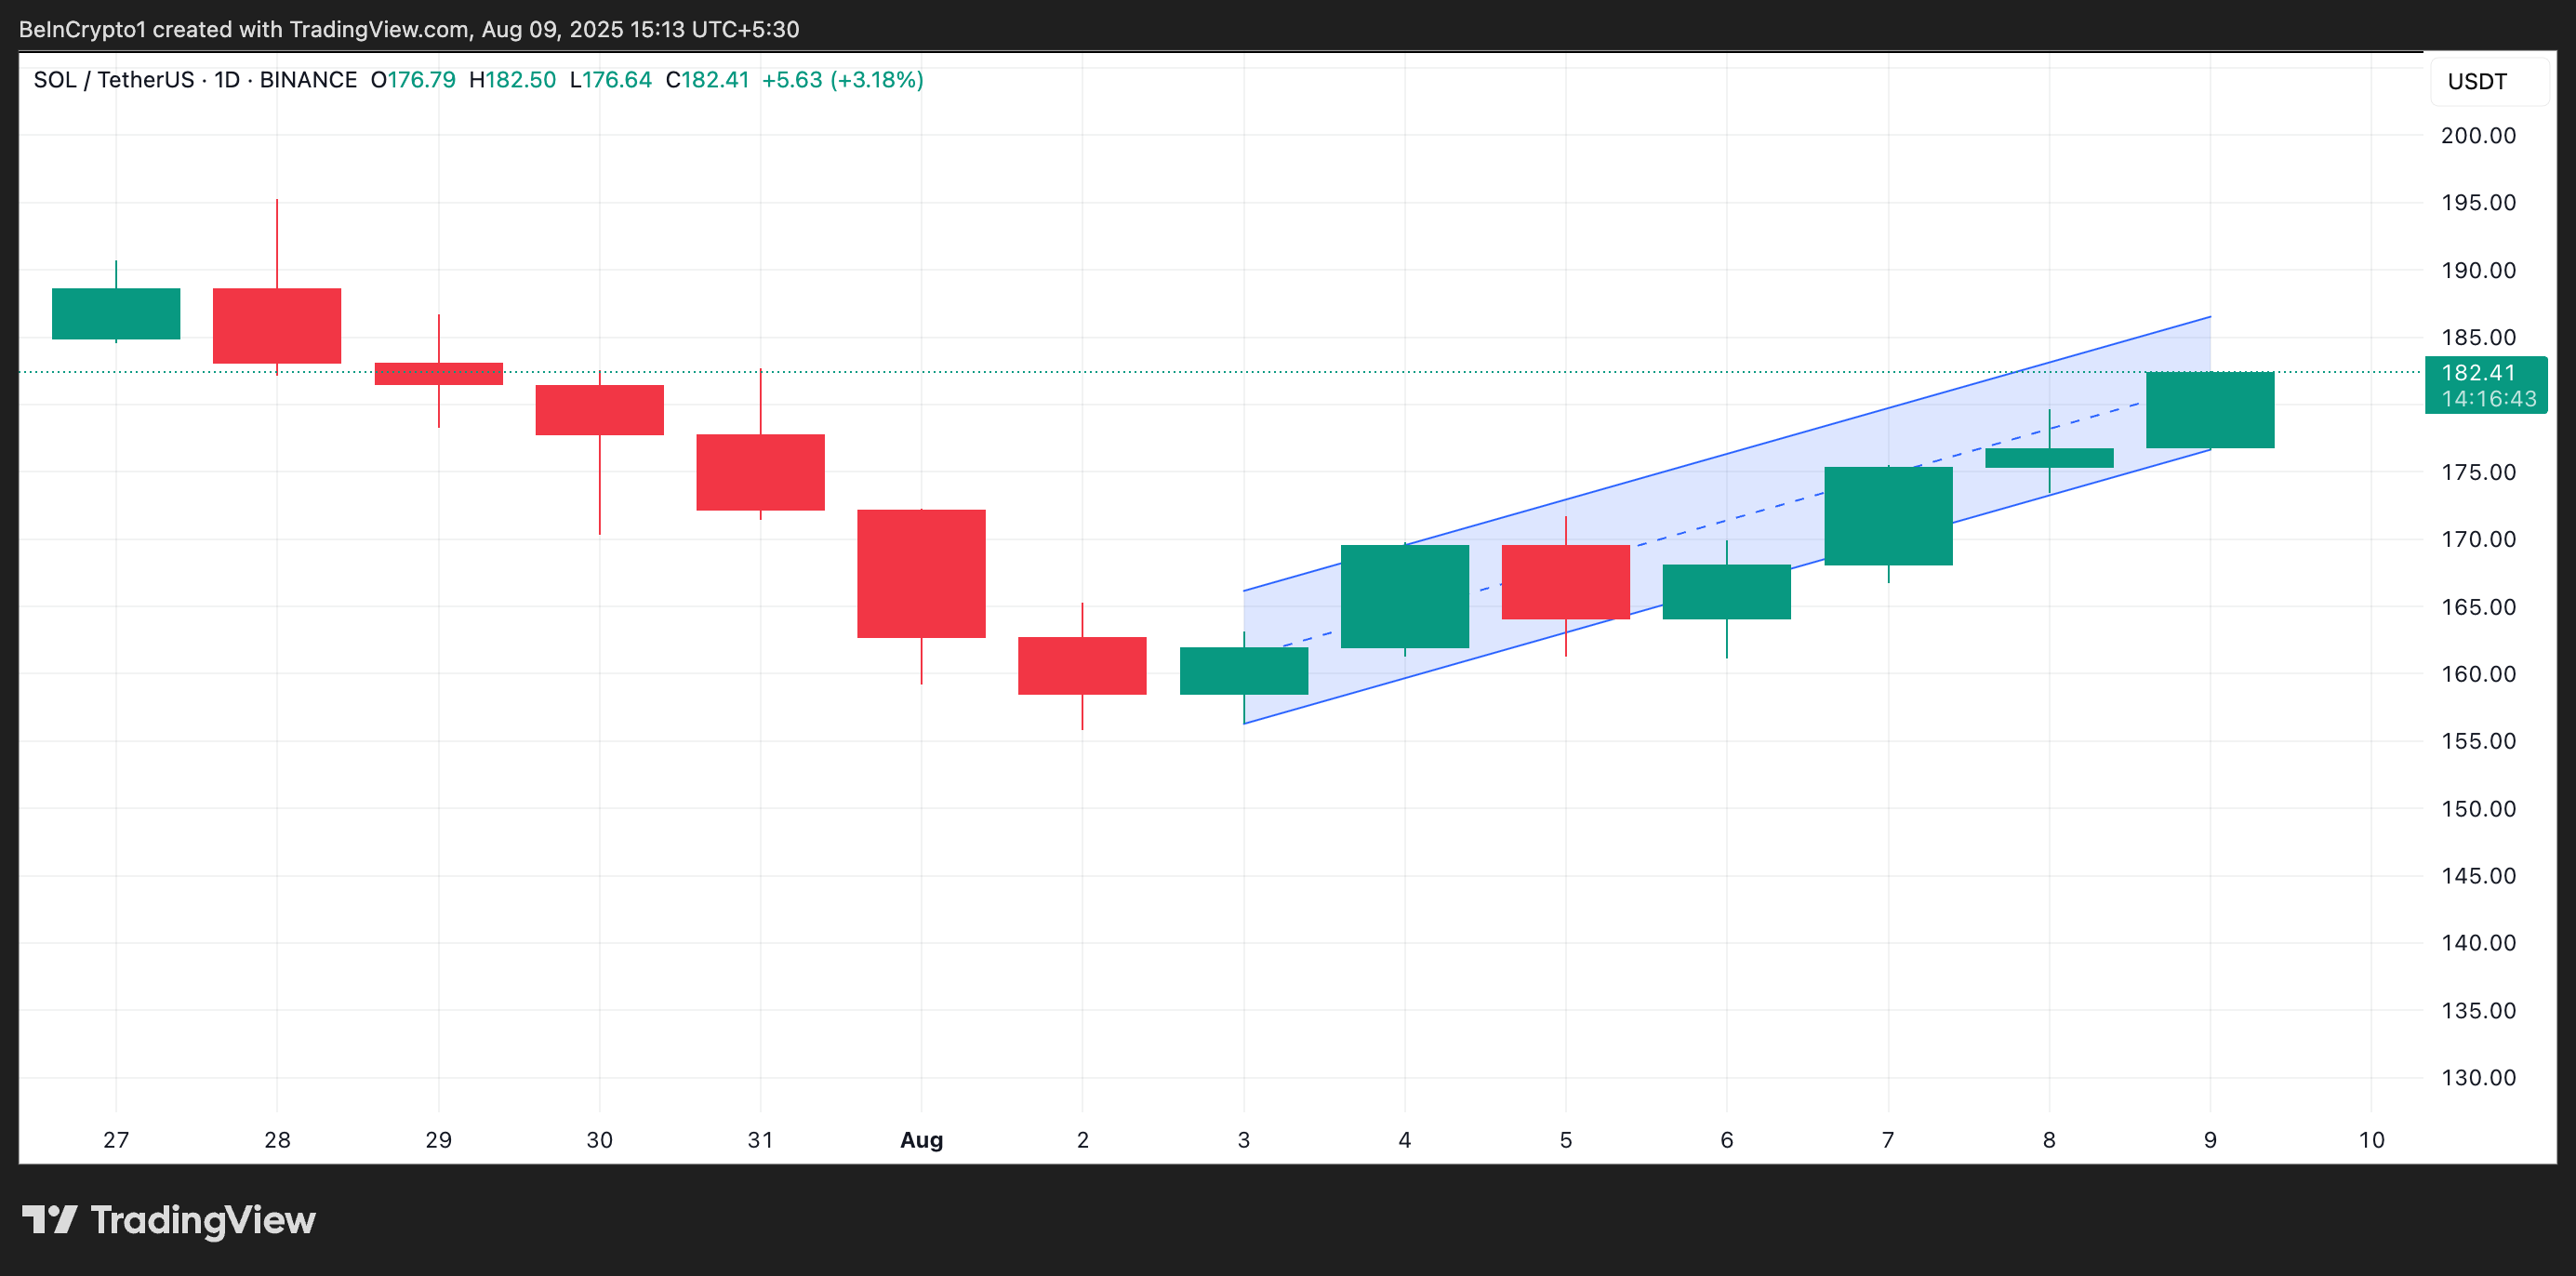
SOL’s double-digit rally in the past week has caused its price to trade within an ascending parallel channel on the daily chart.
Want more token insights like this? Sign up for Editor Harsh Notariya’s Daily Crypto Newsletter here.
This pattern is formed when price action creates a series of higher highs and higher lows, moving between two upward-sloping parallel trendlines. The lower boundary acts as dynamic support, while the upper boundary serves as resistance
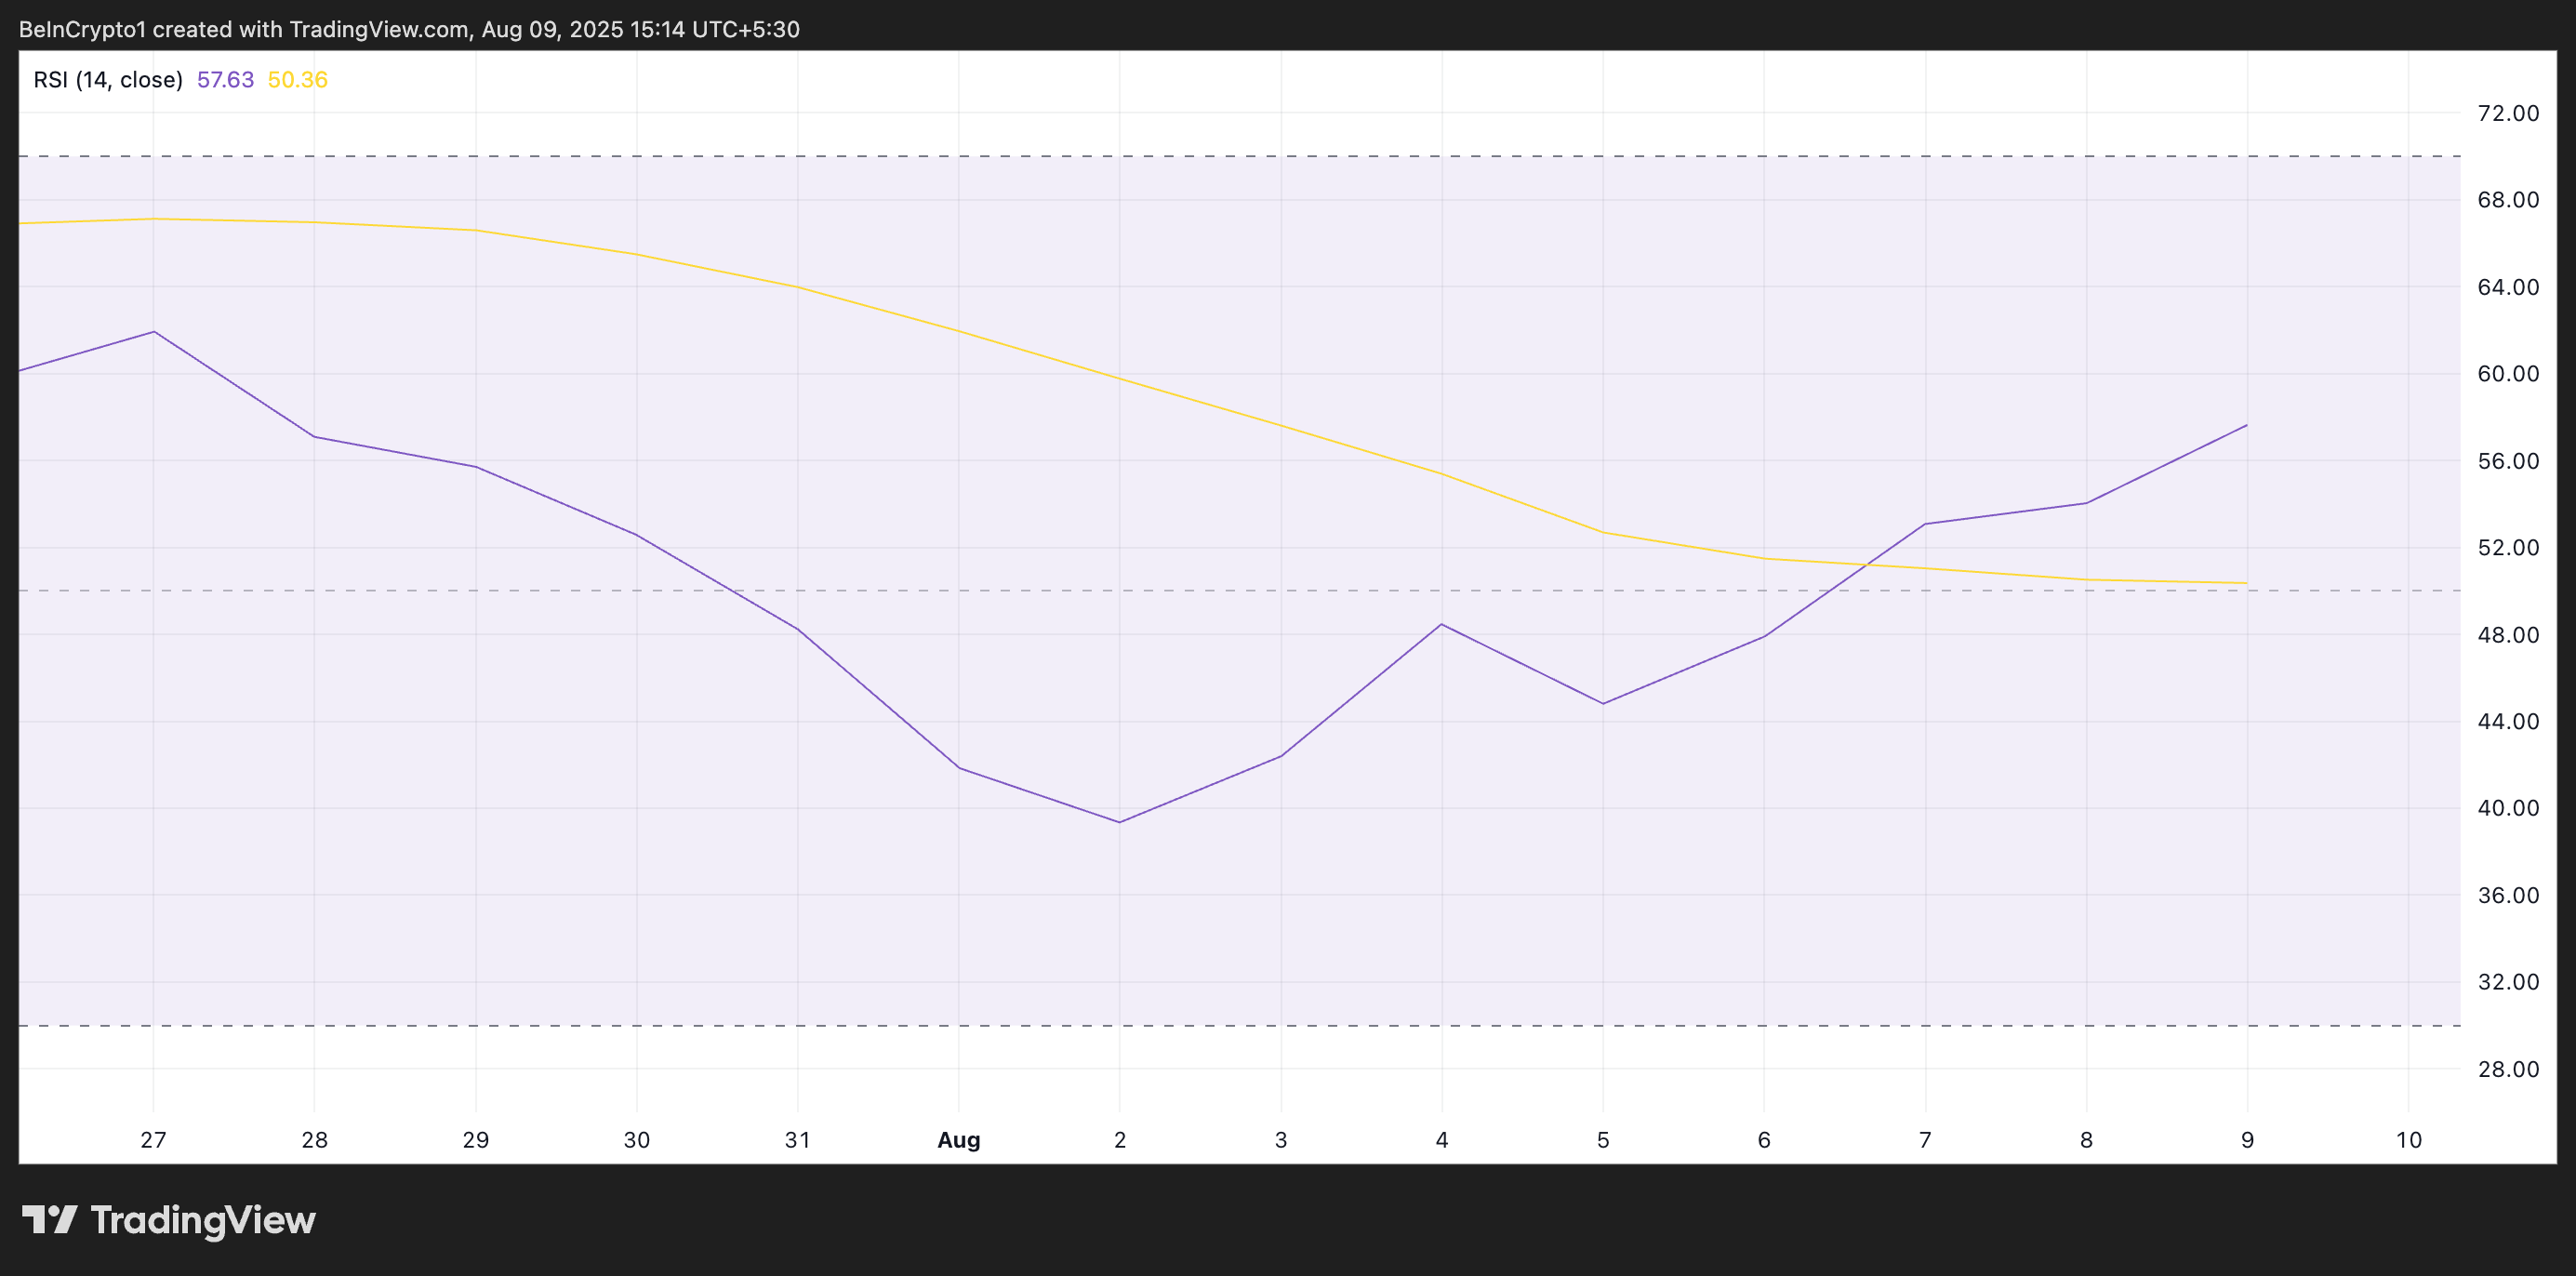
When an asset trades within such a channel, it signals an uptrend where demand outweighs supply. Readings from SOL’s Relative Strength Index (RSI) confirm the buy-side pressure currently backing its rally. As of this writing, this momentum indicator stands at 57.63.
The RSI indicator measures an asset’s overbought and oversold market conditions. It ranges between 0 and 100. Values above 70 suggest that the asset is overbought and due for a price decline, while values under 30 indicate that the asset is oversold and may witness a rebound.
SOL’s RSI readings indicate market participants prefer accumulation over distribution. If this trend continues, its price could continue to rise.
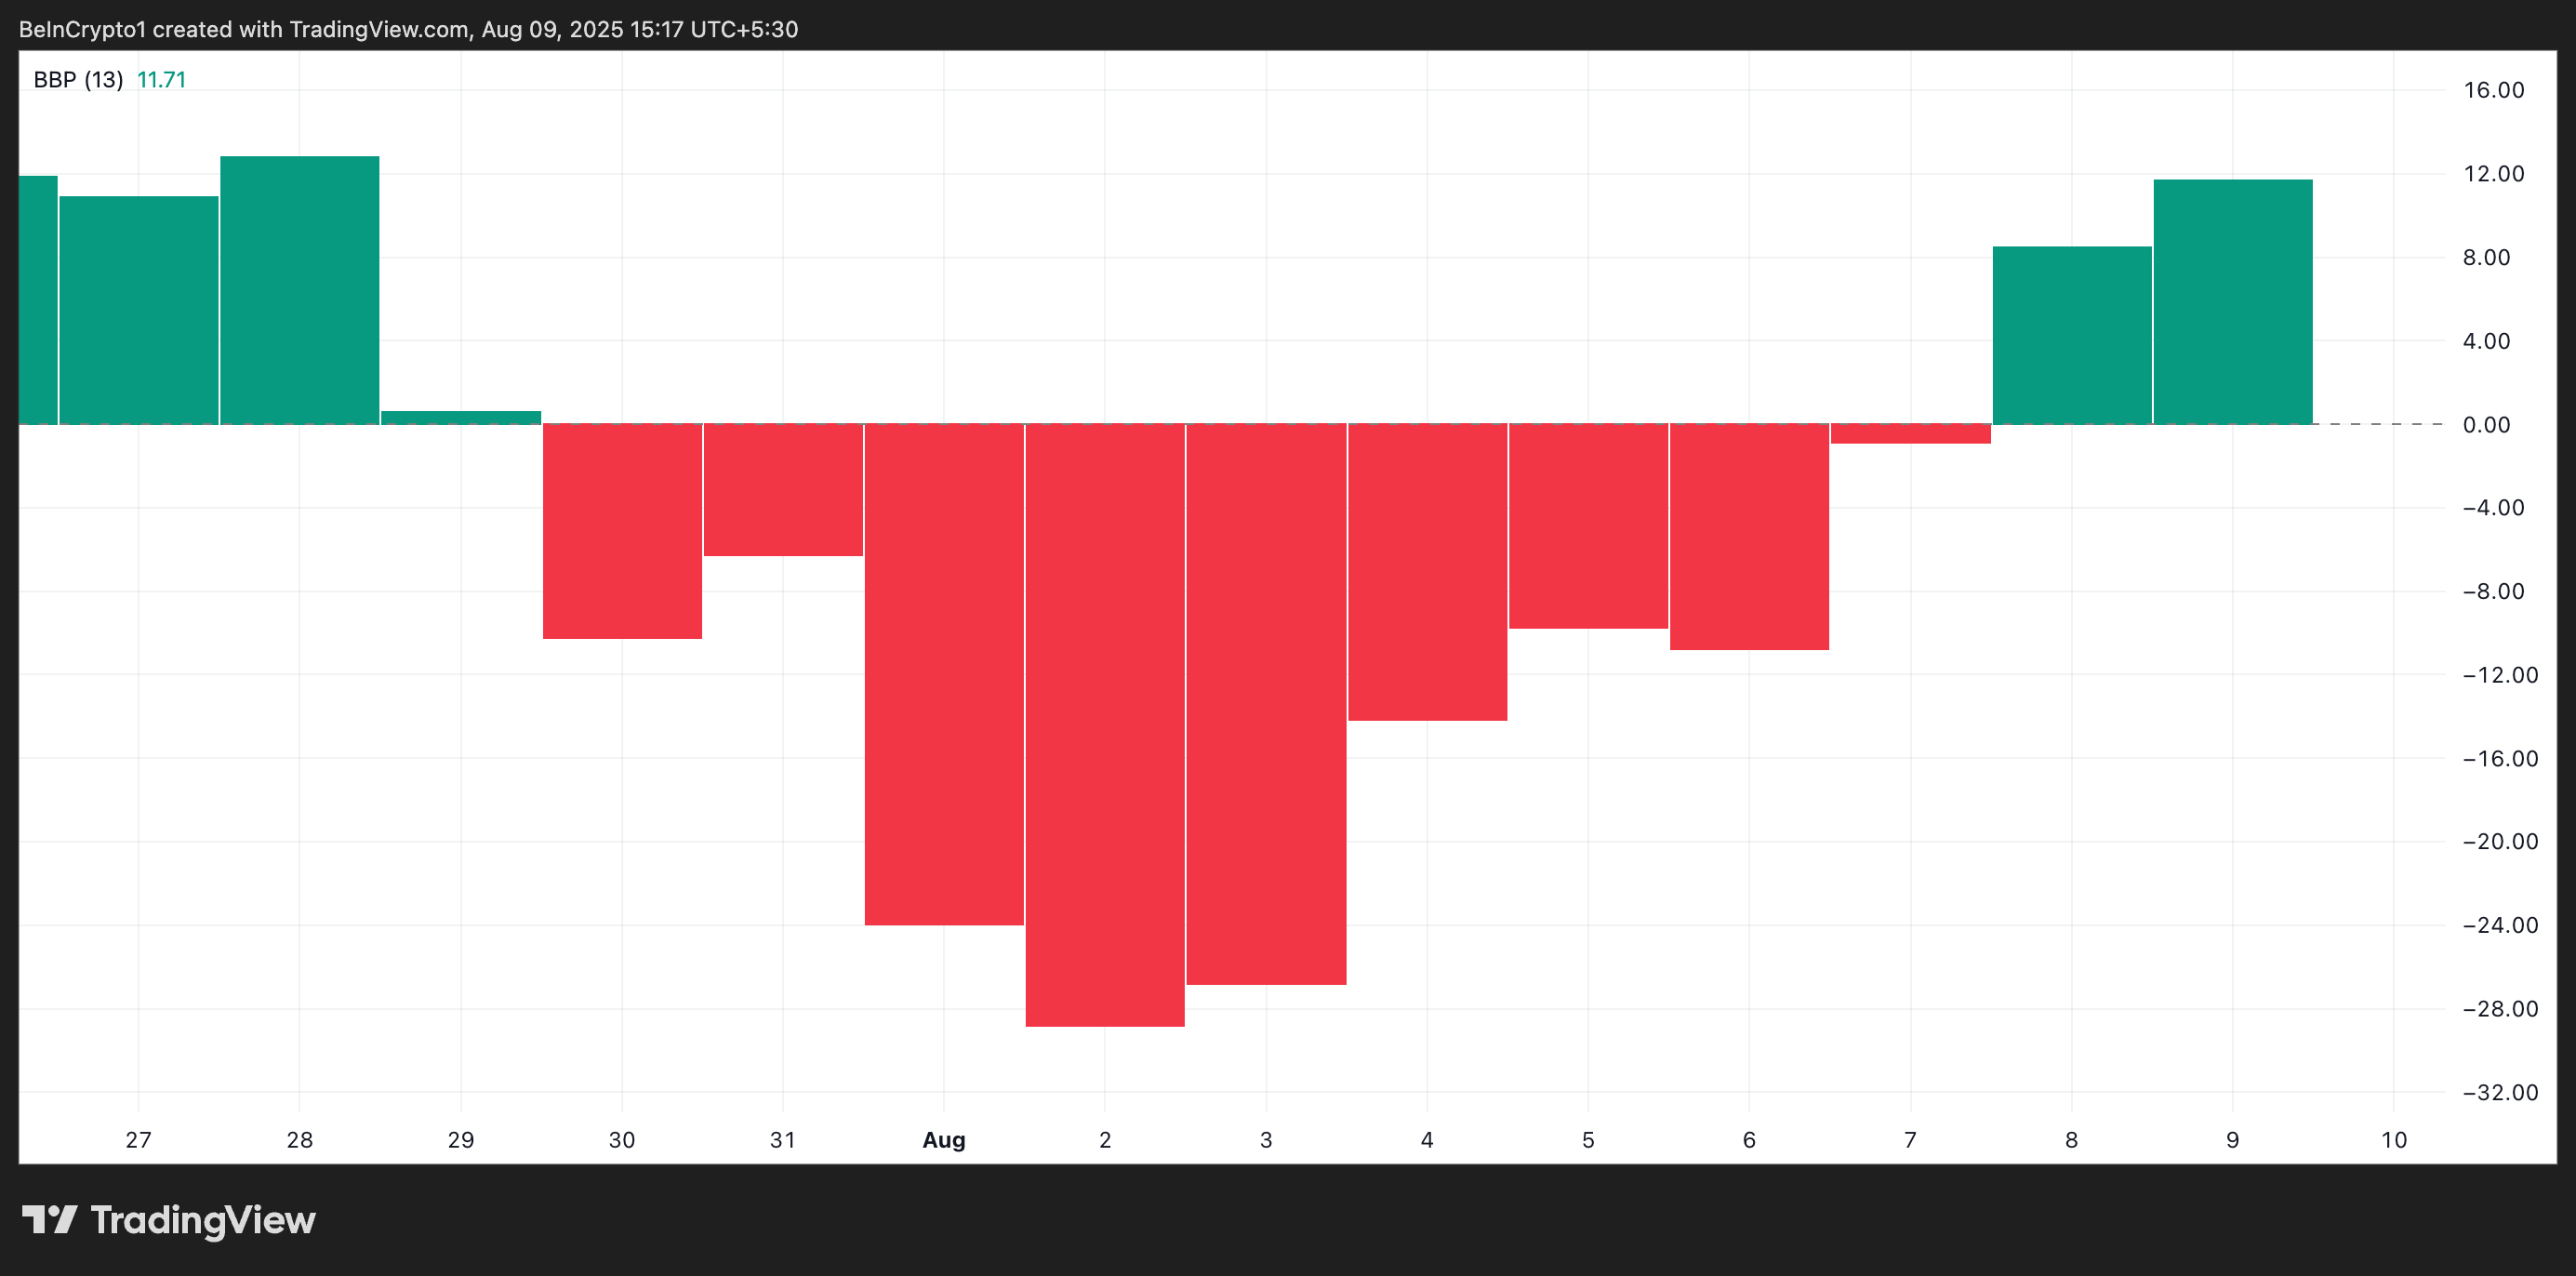
Furthermore, SOL’s Elder-Ray Index has remained positive for the past two trading sessions, marking a significant turnaround after a nine-day streak of red histogram bars. This shift signals a positive change in market momentum, with the index currently at 11.71 at press time.
The Elder-Ray Index measures the balance of power between buyers and sellers. When its value is positive, bullish pressure outweighs bearish pressure, with buyers gaining market control.
In SOL’s case, its Elder-Ray Index strengthens the bullish outlook and suggests that the recent rally could extend if buying interest persists.
SOL Bulls and Bears Face Off Near $186
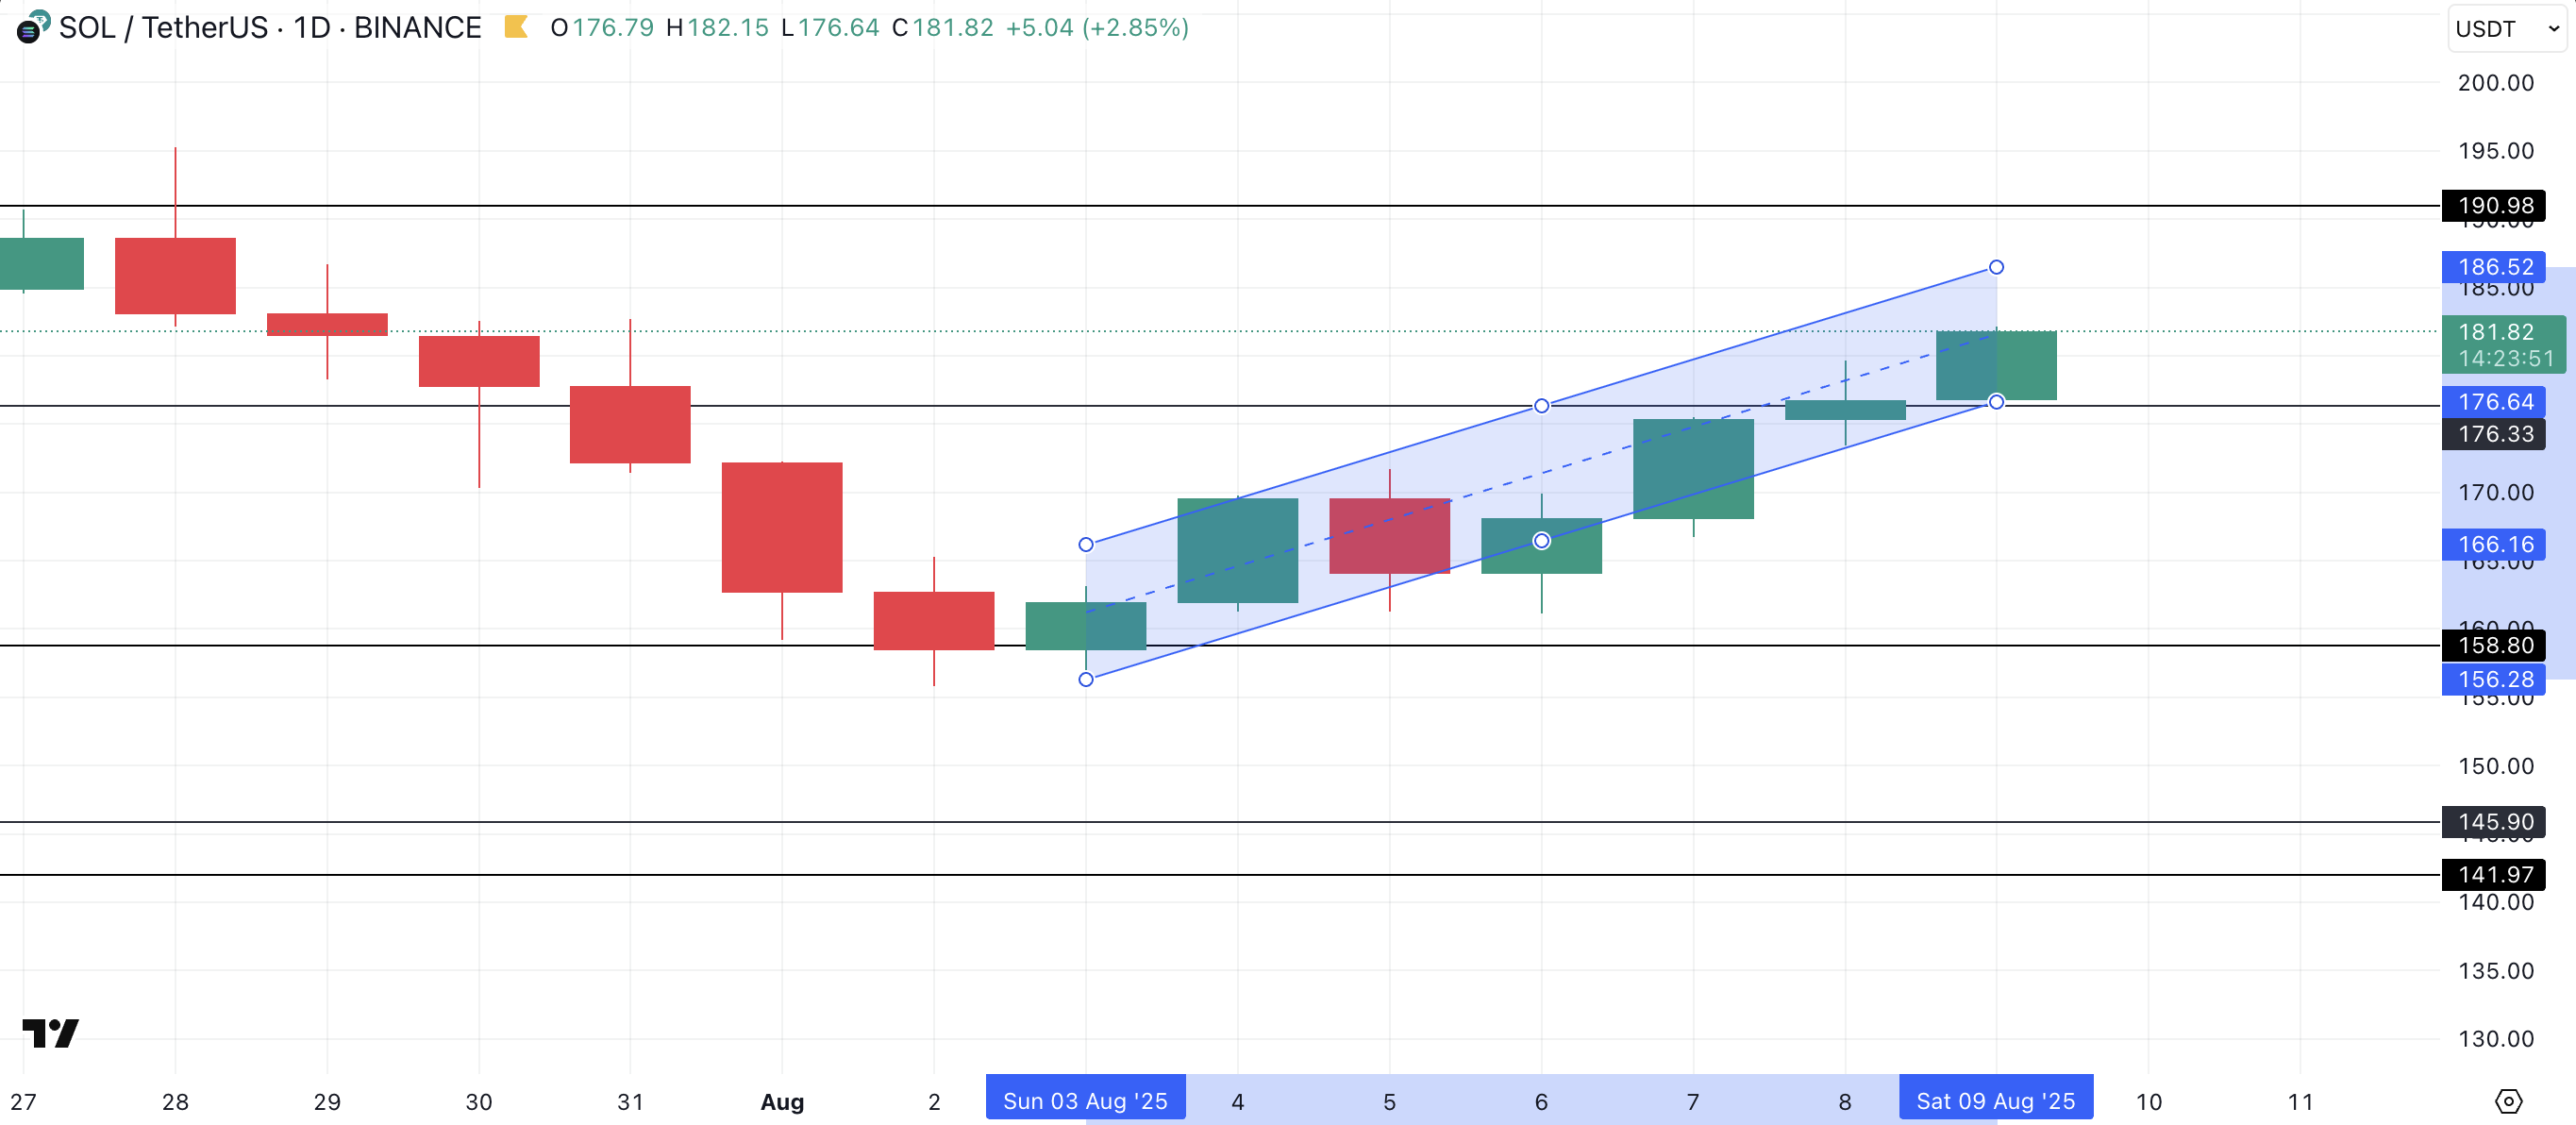
At press time, SOL changes hands at $181.82, sitting just below the resistance level at $186.52, the upper boundary of its ascending parallel channel.
A surge in buying pressure could see the token break through this barrier and push past the psychologically significant $190 mark.
Welcome to the US Crypto News Morning Briefing—your essential rundown of the most important developments in crypto for the day ahead.
Grab a coffee for another read about Bitcoin (BTC) from Max Keiser, one of the most popular pioneers. His latest comments come amid soaring Bitcoin price, with the king of crypto progressively threatening to sidestep fiat money.
Crypto News of the Day: Max Keiser Says Bitcoin Could Hit $220,000 in 2025
In a recent US Crypto News publication, BeInCrypto reported Max Keiser’s prediction that Bitcoin would hit $200,000, a move that he said would alter global finance.
“At $200,000 BTC, we trigger the tipping point when millions of Bitcoiners have the wherewithal and political will to opt out of the banking system and the nation state. I am already seeing this in El Salvador. And the trickle will become a raging torrent at $200,000. And this is just the beginning,” Keiser told BeInCrypto.
The Bitcoin pioneer has revised his target, noting that Bitcoin could hit $220,000 this year. What may have prompted this change in outlook, and more importantly, why the urgency with 2025 halfway in?
Keiser’s bullish forecast for Bitcoin comes amid the pioneer crypto’s growing influence in mainstream finance. A recent US Crypto News publication pointed to this effect, indicating BlackRock’s BTC stash nearing that of Satoshi Nakamoto.
“I offer a solution for trump’s fiat money addiction, fiat money addicts need to find their bottom, and be willing to hear the message of Bitcoin. When Trump is ready to recover, Bitcoin will still be here, just a lot higher in price,” Keiser said.
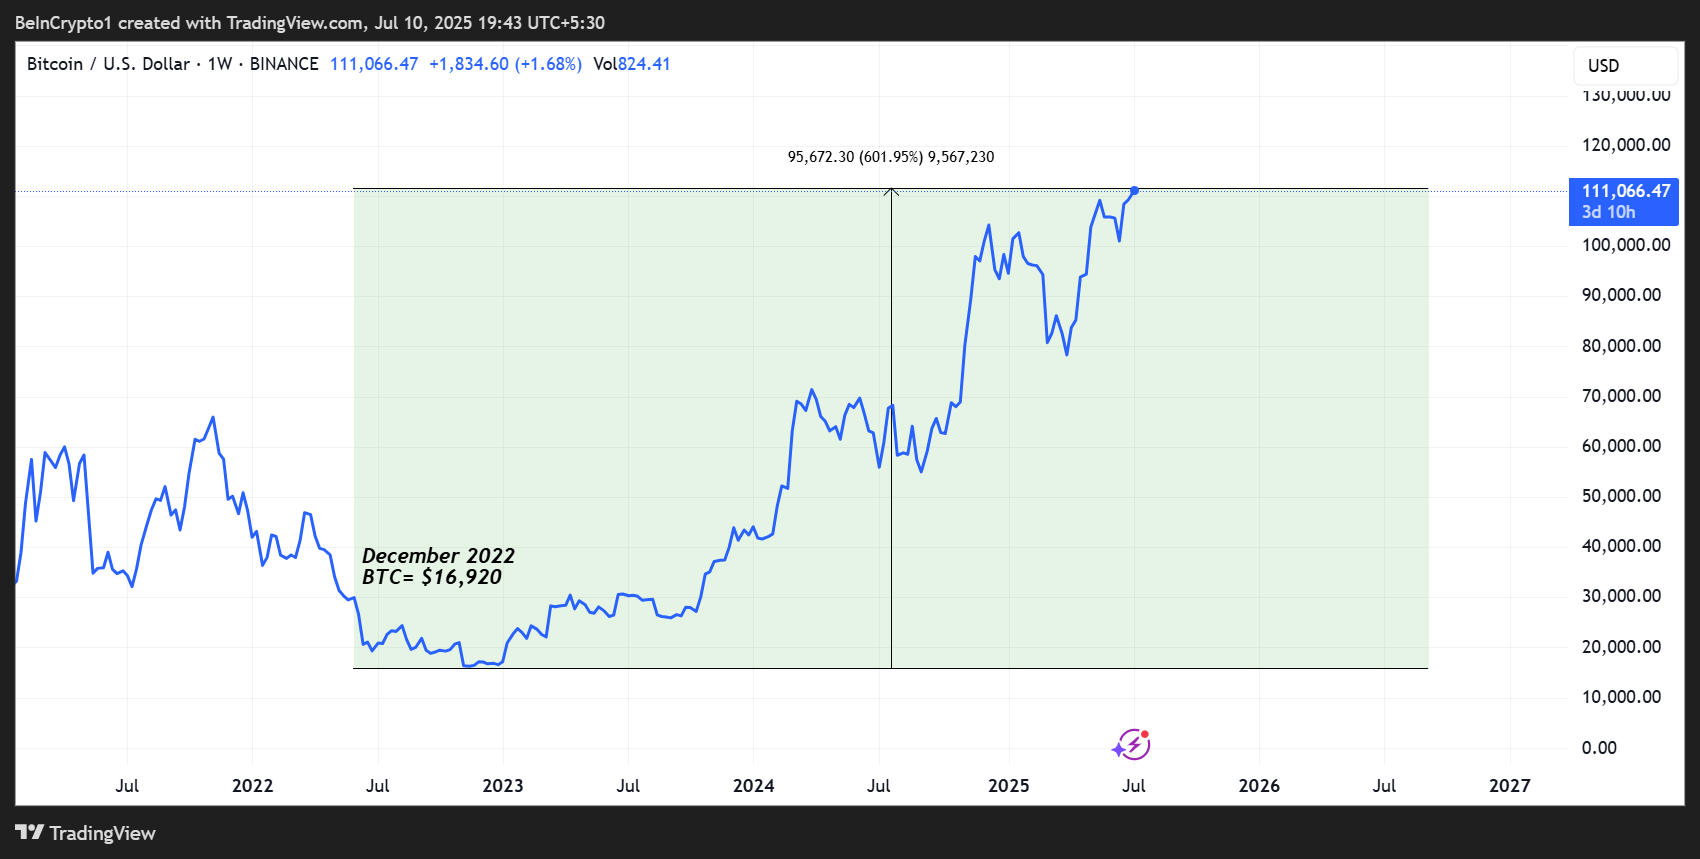
The Bitcoin maxi referenced a 2022 interview where he had also forecasted a Bitcoin rally to $220,000.
Bitcoin up 700% since this interview 2 years ago (and $220,000 in 2025 looks likely).
Despite skepticism for his 2022 predictions, the pioneer crypto’s value has grown by nearly 600% from the depths of $16,000. This traction lends credibility to the forecast despite the volatility characteristic of the industry.
Beyond fundamentals, technicals also align with John Bollinger, inventor of the Bollinger indicator, who predicted a Bitcoin price breakout, as reported in another US Crypto News publication.
“Bitcoin looks to be setting up for an upside breakout as the week gets going,” Bollinger wrote in a post.
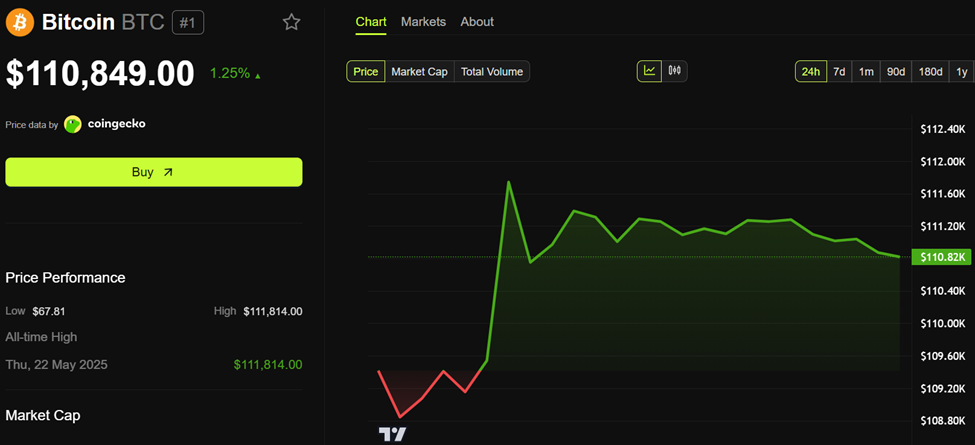
While optimism still abounds, Bitcoin price nicked a new all-time high (ATH), topping out at $111,999 on Binance. As of this writing, BTC was trading for $110,849, up 1.25% in the last 24 hours.
With prospects for further upside, Max Keiser declined to give the date he expects Bitcoin to hit $220,000, citing a need to keep markets calm.
“If I gave you both the price and date most of you would be scared,” Keiser added.
Like Keiser, Standard Chartered also forecasted a rally for Bitcoin, citing $135,000 in Q3 and $200,000 by Q4. Meanwhile, others like BitMEX co-founder Arthur Hayes are even more optimistic, anticipating a $250,000 per BTC target for Bitcoin this year.
However, Hayes’ forecast is contingent on the Federal Reserve (Fed) shifting to quantitative easing (QE).
Nearly $7.4 Trillion Parked in Money Market Funds
Meanwhile, data according to Barchart shows up to $7.397 in money market funds (MMFs). This marks a modest surge from a month ago, when BeInCrypto reported $7.24 trillion in these investment vehicles.
A staggering $7.4 Trillion is now sitting in Money Market Funds, a new all-time high pic.twitter.com/AQVGlBYpwv
This marks a new all-time high (ATH) for assets in MMFs, suggesting investors may be seeking safety amid economic uncertainty. MMFs are low-risk investments offering liquidity and yields.
With this capital signaling sidelined liquidity, some analysts view this cash buildup as a signal of market hesitation that could pivot bullish. If the capital is channeled toward Bitcoin, it could catalyze a breakout amid rising global liquidity, as indicated in a recent US Crypto News publication.
“It [money parked in MMFs] is capital that doesn’t trust the system…The moment Bitcoin confirms itself as the reserve-grade escape valve, even a 5% rotation from that $7T pile would obliterate supply and launch BTC into a new monetary regime,” Crypto strategist SightBringer said recently.
However, other analysts hold a more measured opinion, saying that capital held in MMFs must be viewed in proportion to total market capitalization.
Macro analysts argue that despite trillions held in money market funds, investors could have less dry powder than many believe relative to the equity market size.
“I’ve noticed a common narrative suggesting that the surge in money market funds means there’s a large amount of cash sitting on the sidelines. That couldn’t be further from the truth, in my view,” macro analyst Otavio Costa challenged.
Ethereum (ETH) shows signs of strength and caution after a sharp 49% rally in the past week. While its market cap has returned above $300 billion and EMA indicators remain bullish, momentum indicators are starting to cool.
The ADX has dropped from 61 to 47.99, and RSI has fallen from 86 to 63, suggesting the uptrend may be losing steam. However, buyers are still active, and if ETH breaks above key resistance, the next leg higher could take it past $3,000.
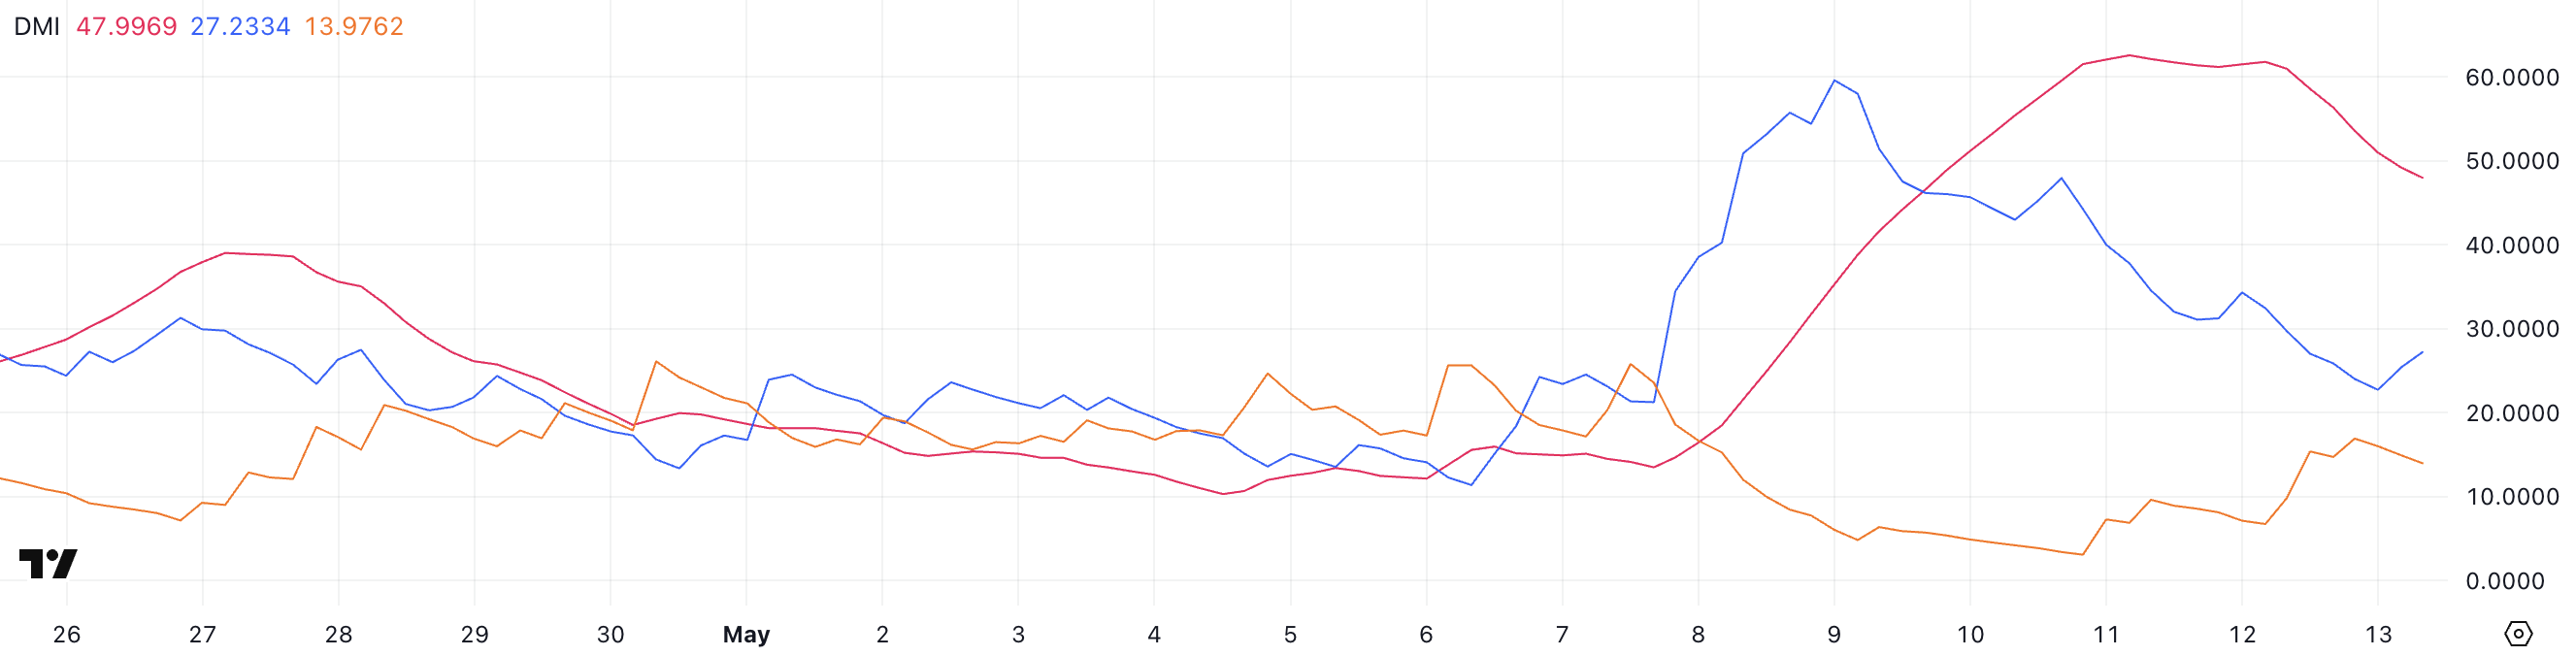
ETH DMI Signals Cooling Rally and Rising Bearish Pressure
Ethereum’s DMI indicator shows that its ADX has dropped from 61 to 47.99, signaling a weakening trend strength.
The ADX (Average Directional Index) measures the intensity of a trend, with values above 25 indicating a strong trend and above 40 suggesting very strong momentum.
The +DI line has fallen sharply from 47.96 to 27.2, showing that bullish momentum has cooled significantly.
Meanwhile, the -DI line has climbed from 3.39 to 13.97, suggesting that bearish pressure is starting to rise.
While the trend still favors the bulls, the gap between +DI and -DI is narrowing, and if this continues, Ethereum could face a short-term pullback or enter a consolidation phase. However, in the last hours +DI went up and -DI went down, suggesting ETH buyers are trying to maintain their control.
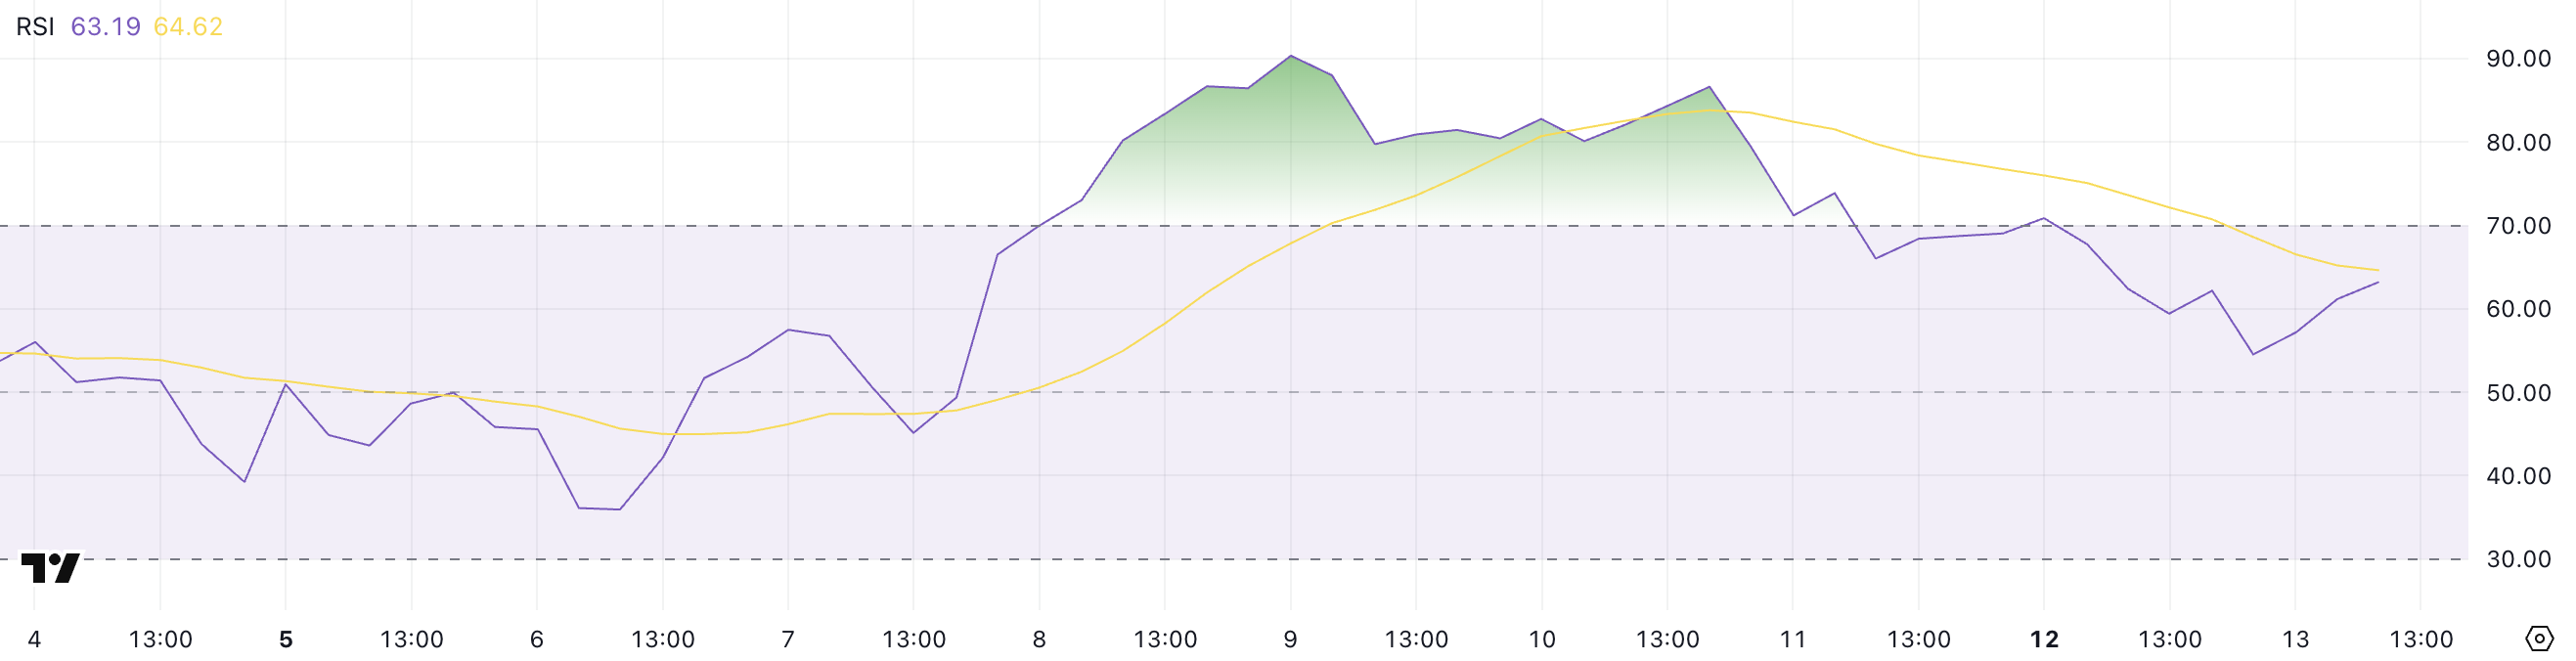
Ethereum RSI Cools From Overbought Zone but Remains Bullish
Ethereum’s RSI has dropped to 63 from a high of 86 three days ago, after holding above the overbought threshold of 70 for three straight days.
Interestingly, despite the recent dip, RSI has bounced from 54 just a few hours ago, suggesting some renewed buying interest in the short term.
RSI (Relative Strength Index) is a momentum indicator that ranges from 0 to 100. Readings above 70 typically indicate overbought conditions and potential for a pullback, while readings below 30 suggest oversold conditions and a possible bounce. Values between 50 and 70 generally point to moderate bullish momentum.
At 63, Ethereum’s RSI shows that the asset has cooled off from recent overbought levels but still maintains underlying bullish strength. This could mean the market is resetting after a strong rally, allowing room for another leg up if buying continues.
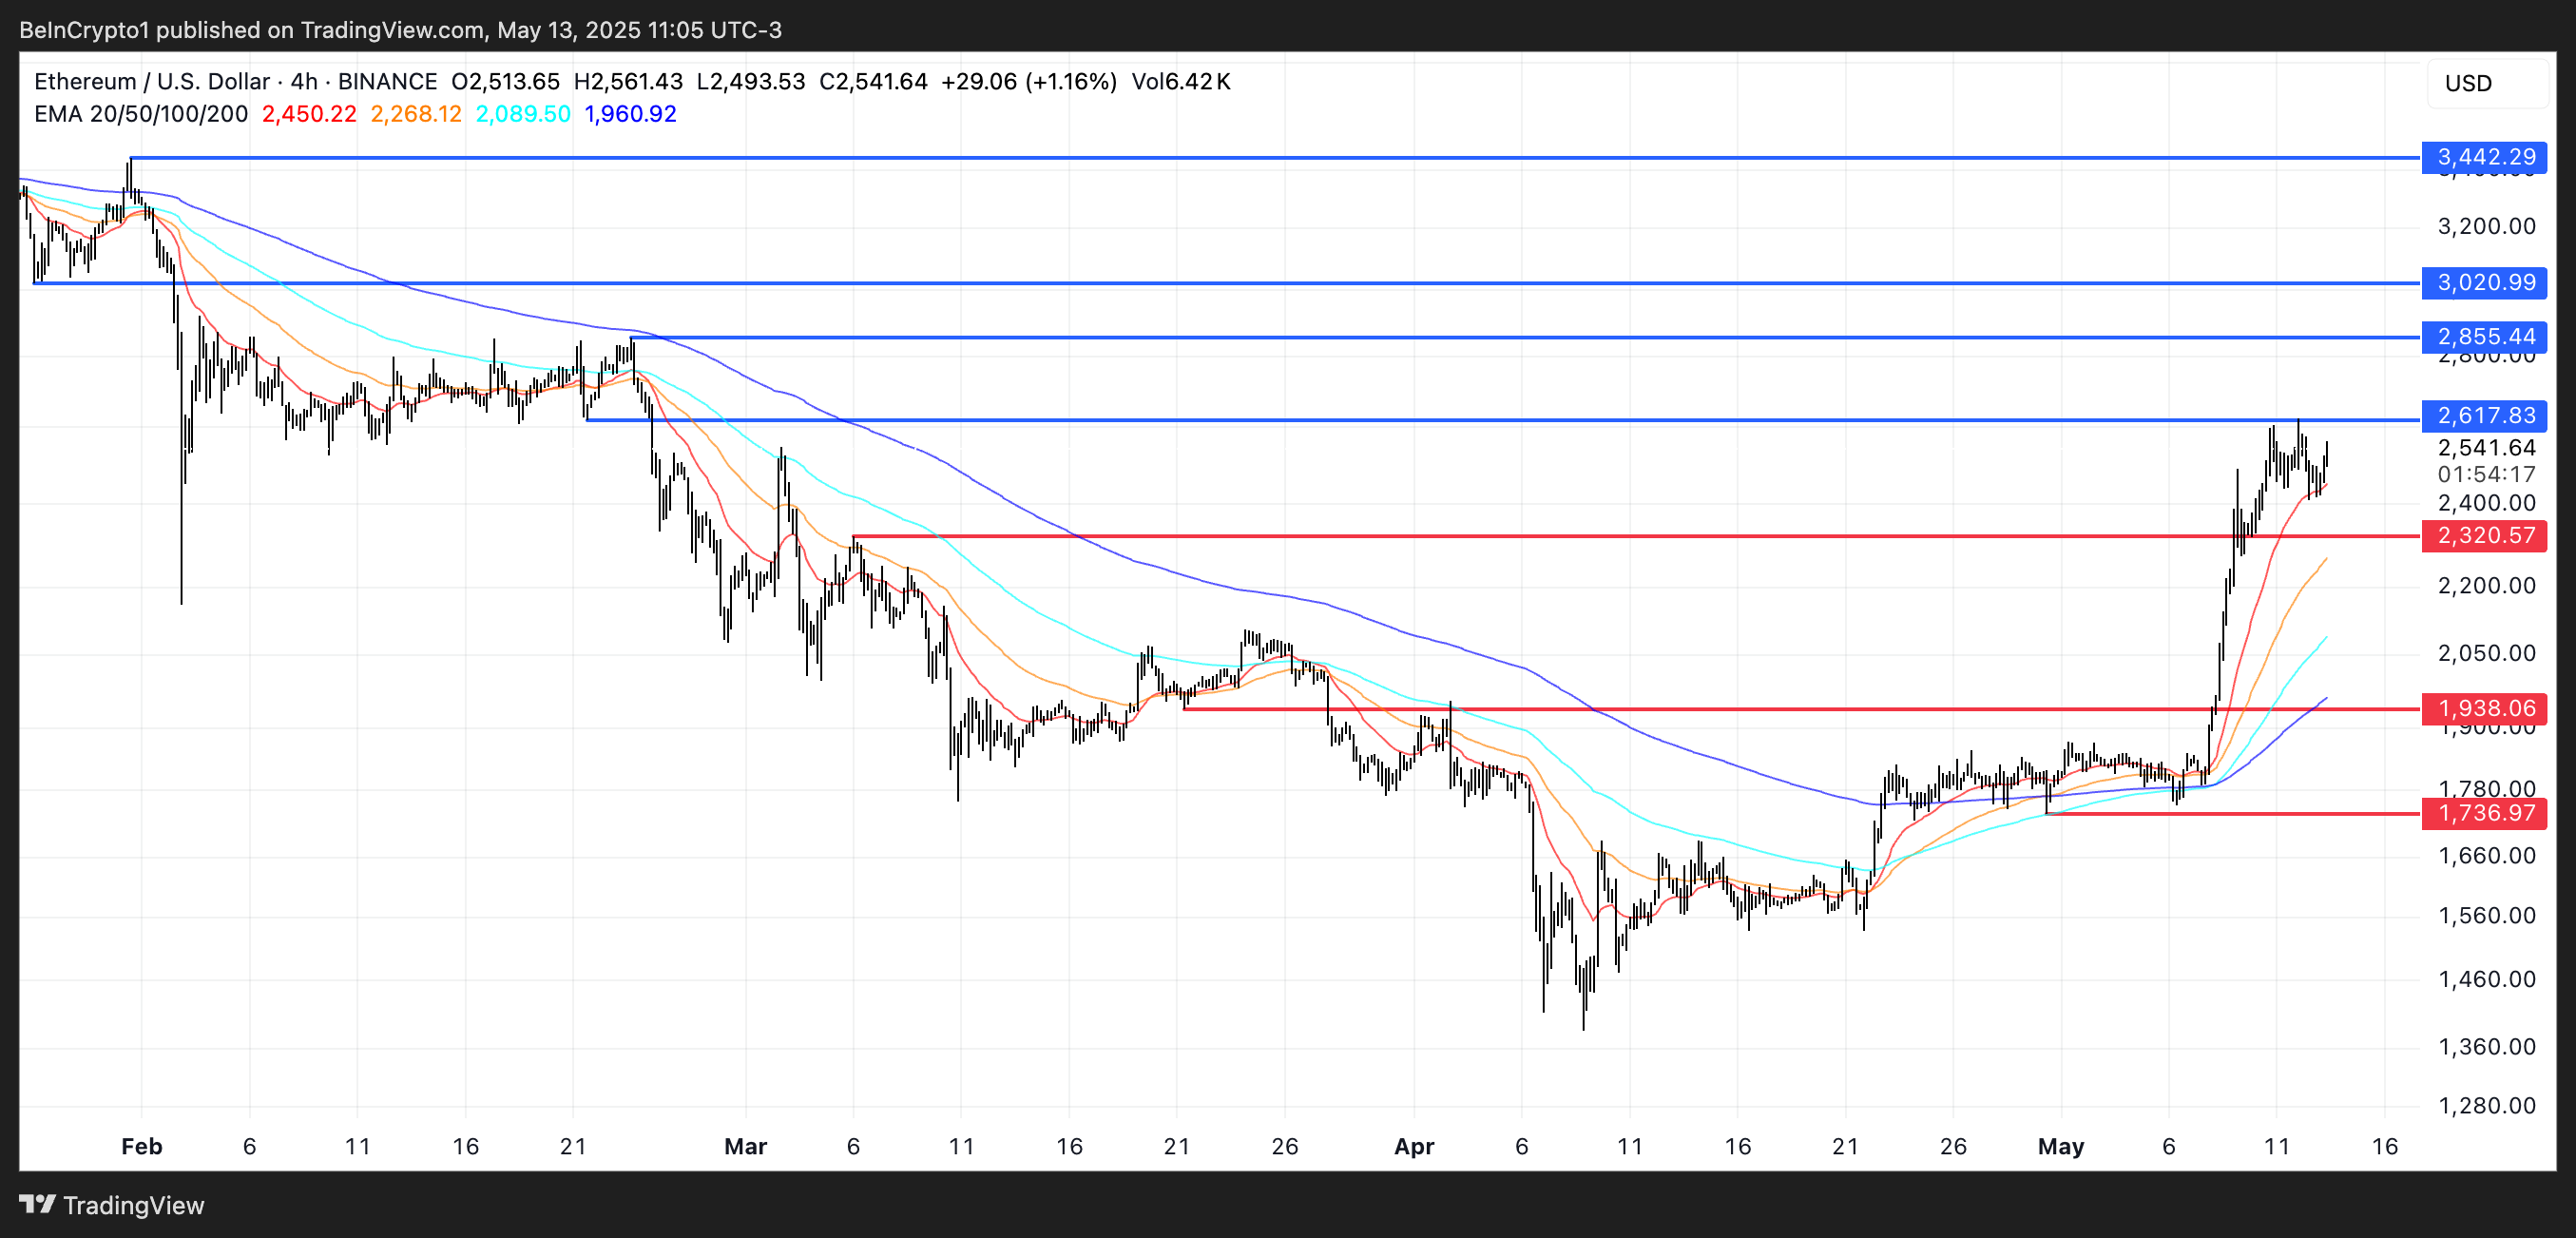
Ethereum Eyes $3,000 After 43% Weekly Surge, But Key Resistance Holds
Ethereum price is up 43.5% over the past seven days, with its market cap climbing back above $300 billion. Its EMA lines continue to show a strong bullish structure, reinforcing the current uptrend.
However, ETH recently tested the $2,617 resistance and failed to break through.
A successful breakout above that level could open the path toward $2,855 and even $3,000 for the first time since early February, with a possible extension to $3,442 if momentum accelerates.
On the downside, the $2,320 support is key. If ETH tests and loses that level, the price could slide to $1,938. A stronger bearish move might push it further down to $1,736.