The 2022 crypto winter was arguably the darkest period in crypto history. Billions of dollars in market value evaporated while the entire industry’s future hung by a thread.
Today, many players who contributed to the severe downturn remain imprisoned, await sentencing, or continue to repay their debts.
A Teeth-Chattering Winter
The infamous crypto winter broke loose due to many factors that began to unfold in early 2022 and intensified throughout the year.
Still reeling from the COVID-19 pandemic, the global economy faced significant challenges, including soaring inflation, rising interest rates, and widespread recession fears. These economic headwinds created a challenging environment for the cryptocurrency market, contributing to its downturn.
Beyond these broader economic pressures, specific events within the crypto market intensified the downturn, leading to a widespread crisis across the entire industry. Among the most notable events were the collapse of FTX and Terra-Luna, the Three Arrows Capital default, and the bankruptcy of leading crypto lending platforms.
These prominent failures and alleged frauds permanently linked several individuals, such as Sam Bankman-Fried, Caroline Ellison, Do Kwon, and Alex Mashinsky, to name a few, with the crypto winter.
Three years later, the crypto industry has achieved a significant recovery, perhaps viewing that challenging era as firmly in the past. Yet, those responsible are still dealing with the repercussions. Where are they now?
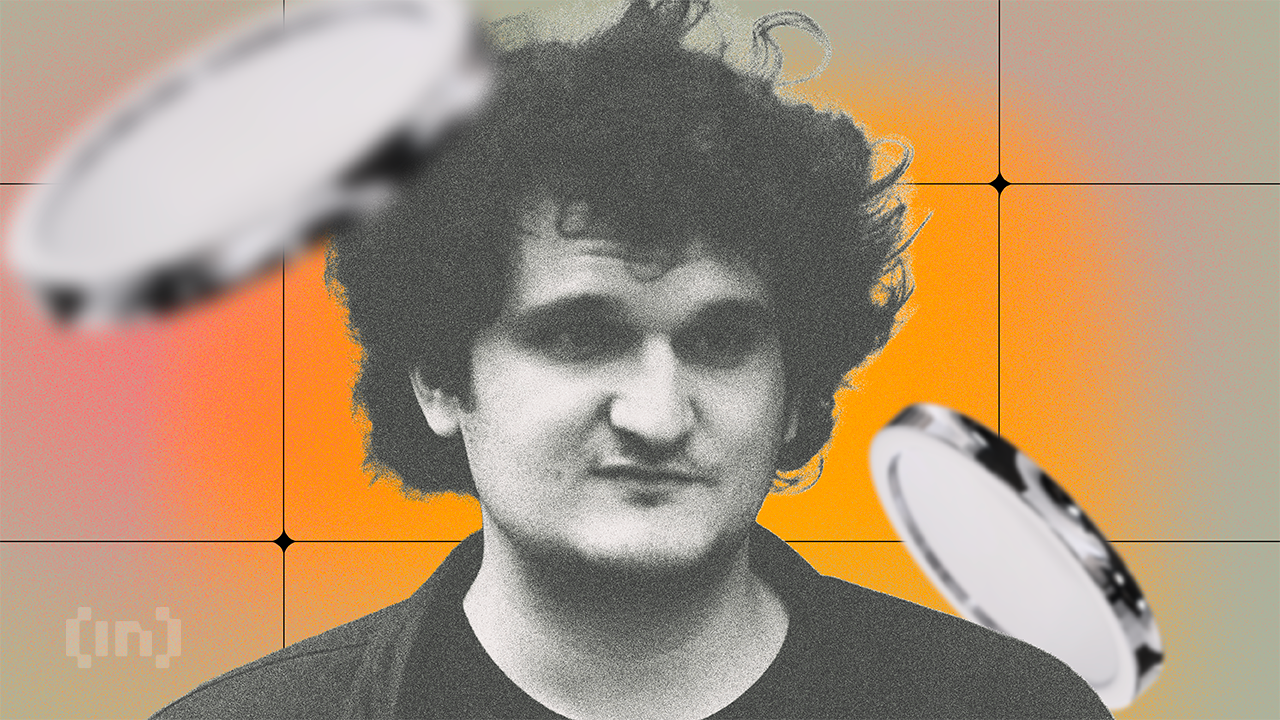
Sam Bankman-Fried (FTX Exchange)
Sam Bankman-Fried (SBF), the founder and former CEO of the FTX exchange, is serving a 25-year sentence in a federal prison in California. According to recent reports, SBF may get a reduced sentence by over four years due to credits for good conduct and potential participation in prison programs. If that happens, he will be released by 2044.
In late 2023, SBF was convicted of fraud and conspiracy for orchestrating a scheme that misused billions of dollars in FTX customer funds.
FTX, which filed for Chapter 11 bankruptcy in 2022, is nearing its conclusion. The process proved surprisingly successful, recovering over $14.5 billion in assets. In May, FTX announced that it anticipates being able to repay 100% of the bankruptcy claim amounts plus interest to non-governmental creditors.
Caroline Ellison (Alameda Research)
Caroline Ellison was the CEO of Alameda Research, a quantitative crypto trading firm founded by SBF that became inextricably linked to FTX. She is currently serving a two-year prison sentence for her role in the fraud.
Ellison started her sentence at a low-security federal prison in Connecticut in early November 2024. She received a significantly reduced sentence because she cooperated extensively with authorities, including testifying against Sam Bankman-Fried at his trial. Like Bankman-Fried, her sentence was recently shortened by a few months for good behavior.
Alameda Research was the main destination for the misused FTX customer funds. FTX reportedly channeled billions of dollars to the trading firm to cover its debts and fund its activities. Like FTX, Alameda Research filed for bankruptcy in 2022 and is no longer an active trading firm.
Its remaining assets are now part of the larger FTX bankruptcy proceedings.
Do Kwon (Terraform Labs)
Do Kwon, co-founder of Terraform Labs, is still awaiting trial for the catastrophic collapse of his company’s stablecoin TerraUSD and sister token Luna in May 2022. Within days, this event wiped an estimated $40 billion to $60 billion in market capitalization from the crypto ecosystem.
Officials arrested him in Montenegro in March 2023 for using falsified travel documents. After numerous legal battles, Do Kwon was extradited to the United States in December 2024 to face federal criminal charges.
Once in the US, a federal grand jury indicted him on multiple felony counts, including securities, commodities, wire fraud, conspiracy, and money laundering. Do Kwon has pleaded not guilty to all charges. His criminal trial in a New York District Court is scheduled to begin in January 2026.
Last year, the US Securities and Exchange Commission (SEC) found Do Kwon and Terraform Labs liable for civil fraud. They tentatively agreed to a settlement with the SEC, which included substantial financial penalties. This settlement effectively banned Kwon and Terraform from the securities industry.
Meanwhile, Terraform Labs filed for bankruptcy in January 2024 and is currently undergoing liquidation. This process involves selling off its remaining assets to fulfill its financial obligations and resolve outstanding claims.
Alex Mashinsky (Celsius)
Alex Mashinsky, former CEO of Celsius Network, is serving a 12-year federal prison sentence after pleading guilty to commodities and securities fraud. Sentenced last May, he also faces three years of supervised release, a $50,000 fine, and forfeiture of $48.4 million in illegal proceeds.
Celsius Network promised high interest rates on crypto deposits, but Mashinsky’s safety assurances proved false. The platform engaged in risky, undisclosed investments, including uncollateralized loans. Mashinsky was also accused of inflating Celsius’s token (CEL) price and profiting personally from its sale.
As the crypto market faltered in mid-2022, Celsius froze all customer withdrawals on June 12, trapping billions. It filed for Chapter 11 bankruptcy a month later, deepening the crypto winter’s impact.
Celsius has since emerged from bankruptcy, restructuring its operations. It has begun distributing over $3 billion to creditors, who now jointly own a new Bitcoin mining company, Ionic Digital, Inc. Celsius is also pursuing a $4 billion lawsuit against Tether for alleged improper liquidation of Bitcoin collateral during its collapse.
Su Zhu and Kyle Davies (Three Arrows Capital)
Su Zhu and Kyle Davies, co-founders of the once-prominent crypto hedge fund Three Arrows Capital (3AC), are still largely embroiled in legal disputes.
Zhu was arrested in Singapore in September 2023 for contempt of court, served a four-month prison sentence, and has since been released, though appeals against court summonses continue. Davies has largely evaded liquidators. Both founders face nine-year bans from Singapore’s financial regulator.
3AC’s aggressive, highly leveraged trading strategies and significant exposure to the Terra ecosystem proved disastrous. When TerraUSD de-pegged, and Luna crashed in May 2022, 3AC suffered massive losses and failed margin calls from numerous lenders.
This insolvency and subsequent liquidation in June 2022 created a significant contagion effect, causing major distress for crypto lending platforms that had lent heavily to 3AC, cementing its role as a primary catalyst for the 2022 crypto winter.
3AC remains under liquidation and is managed by court-appointed liquidators. They aim to recover assets for creditors who collectively filed over $3.5 billion in claims.
The post Where Are They Now? The Crypto Winter Villains Who Shook the Industry appeared first on BeInCrypto.


 △ (@AlexMasonCrypto)