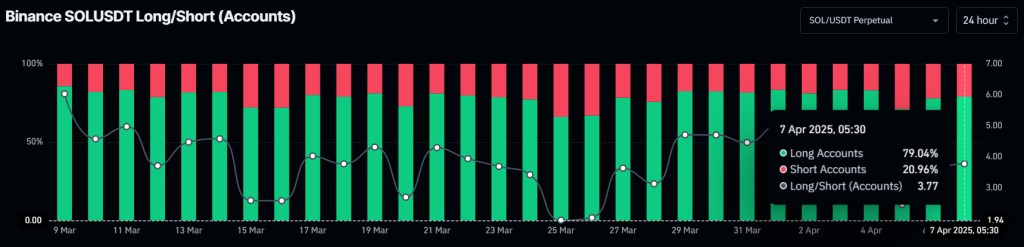
Solana (SOL), the world’s sixth-largest cryptocurrency by market cap, is gaining massive attention from Binance traders. Recently, data from the on-chain analytics firm Coinglass revealed that 79% of top traders on Binance are going long on SOL, despite the bearish market sentiment.
Source: Coinglass
Solana (SOL) Price Action and Upcoming Levels
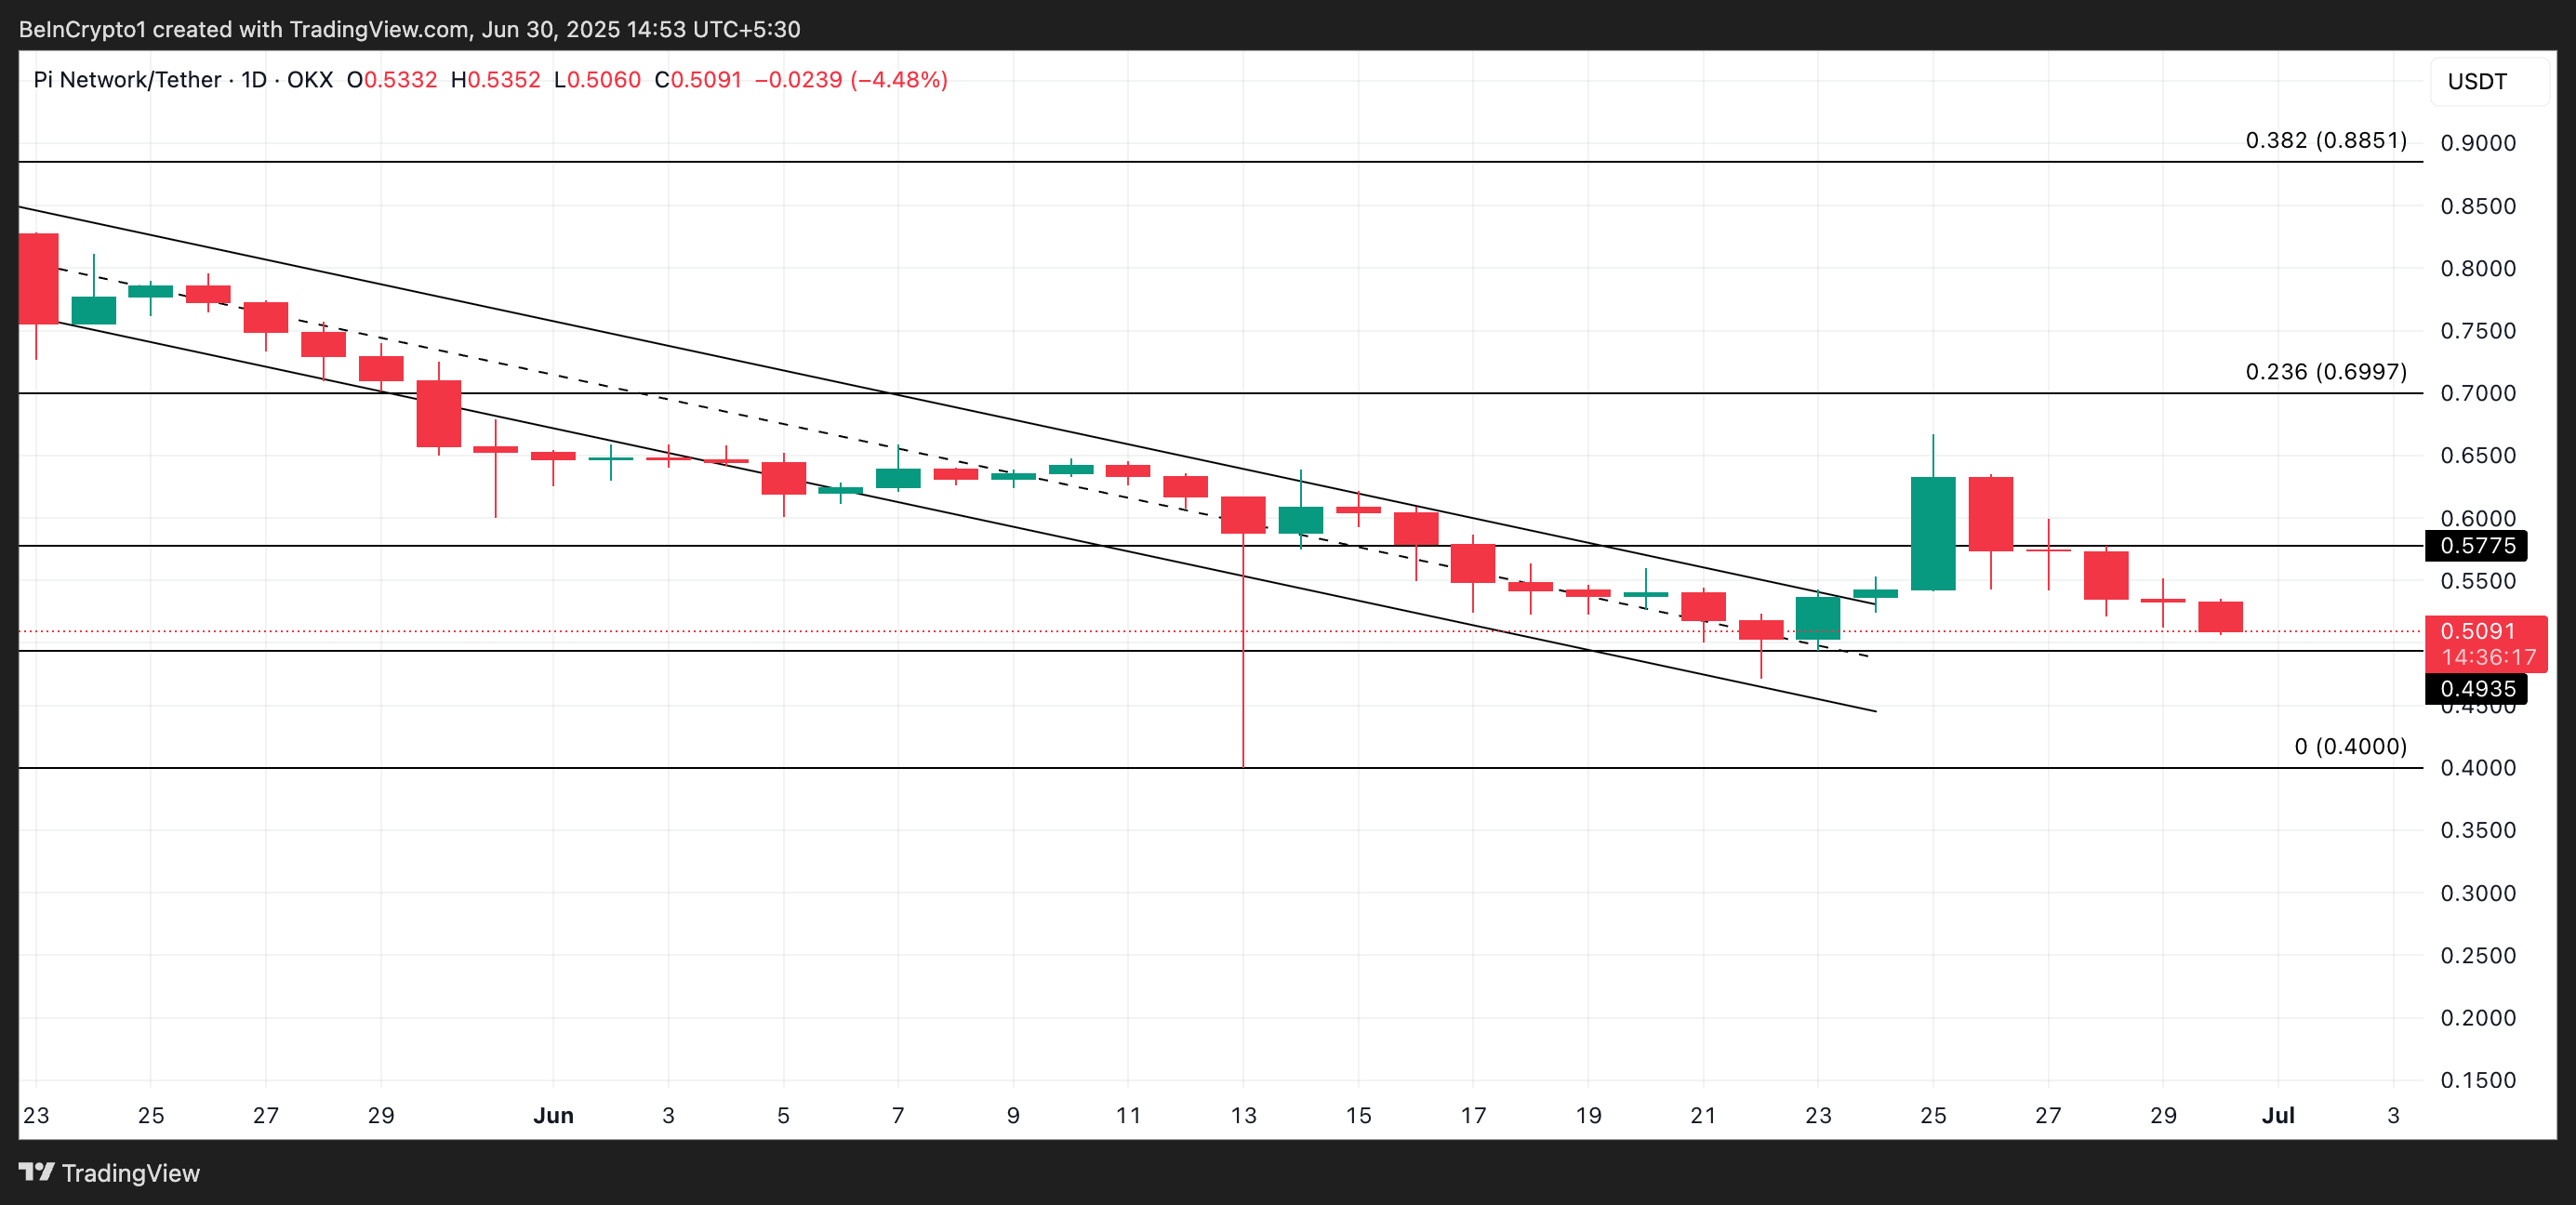
According to expert technical analysis, SOL appears bearish despite the ongoing price recovery. On April 6, 2025, SOL broke down from its prolonged key support level of $115 and also closed a daily candle below that level, a level it had held since March 2024.
Source: Trading View
This breakdown has pushed SOL into an extremely bearish phase. However, the ongoing price recovery appears to be a retest of the breakdown level.
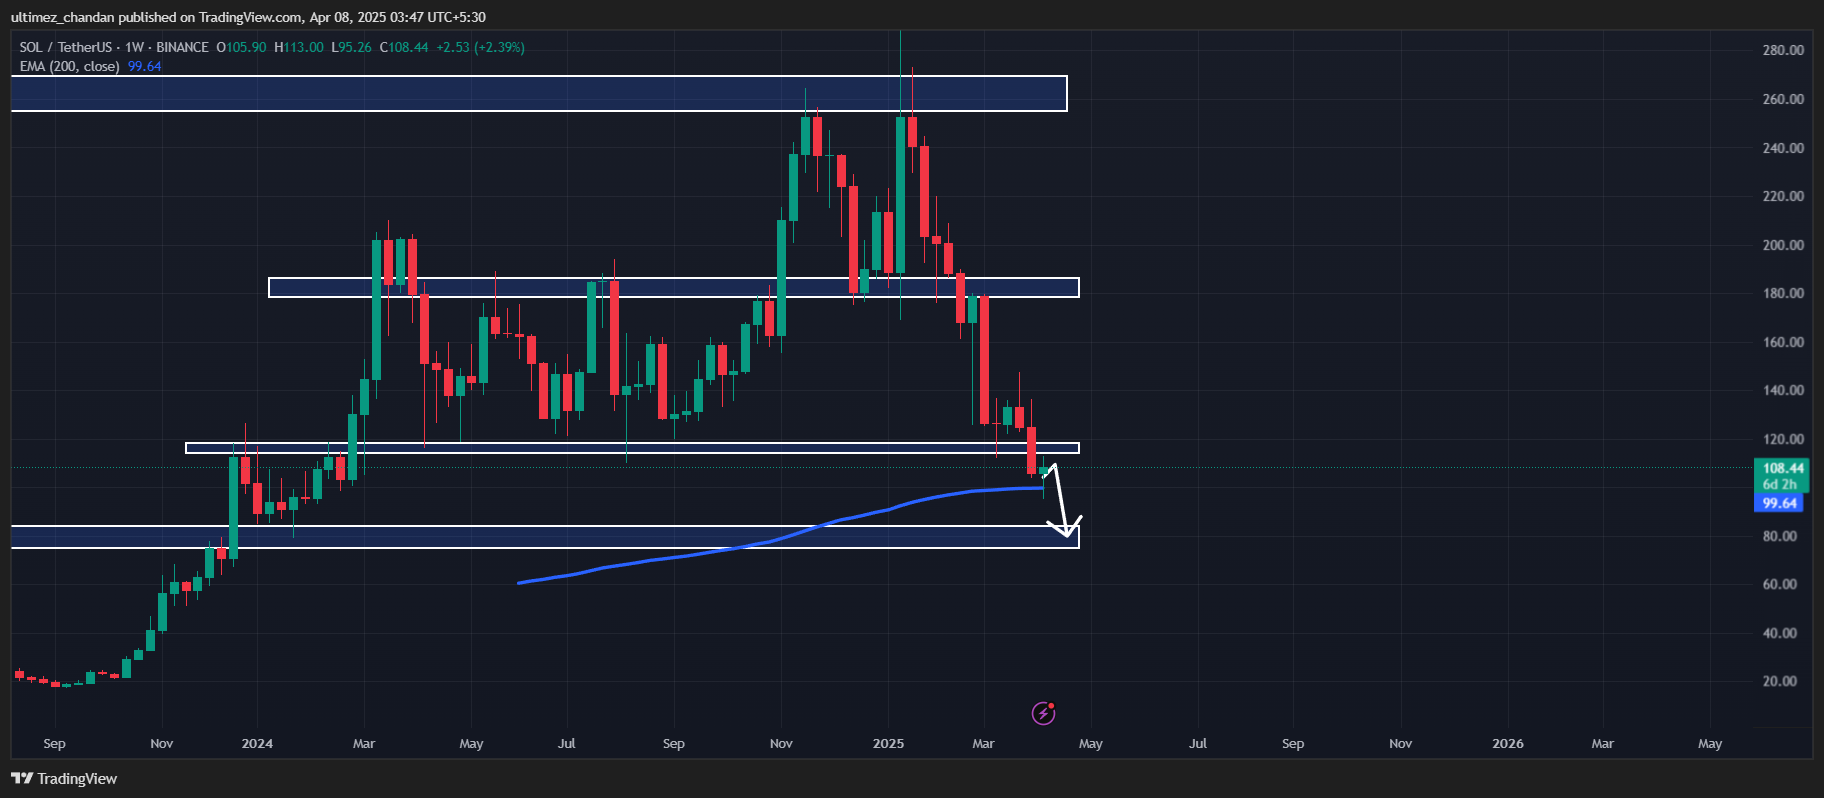
Based on the recent price action and historical momentum, if SOL remains below the $115 level, there is a strong possibility it could decline by 30% and reach the $77 level in the near future.
Source: Trading View
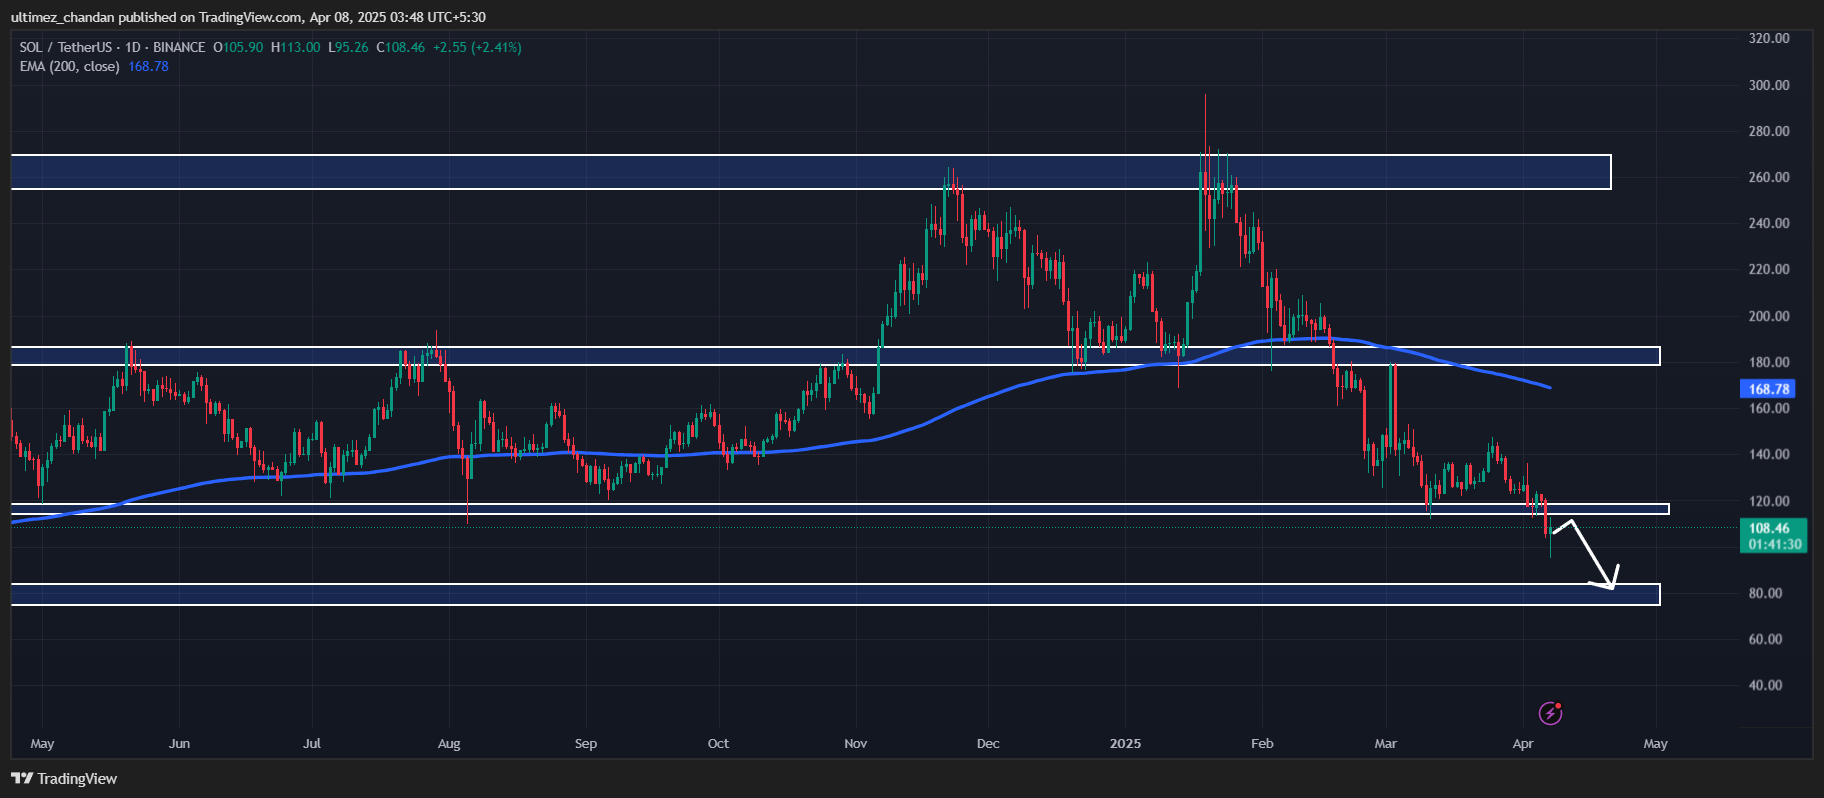
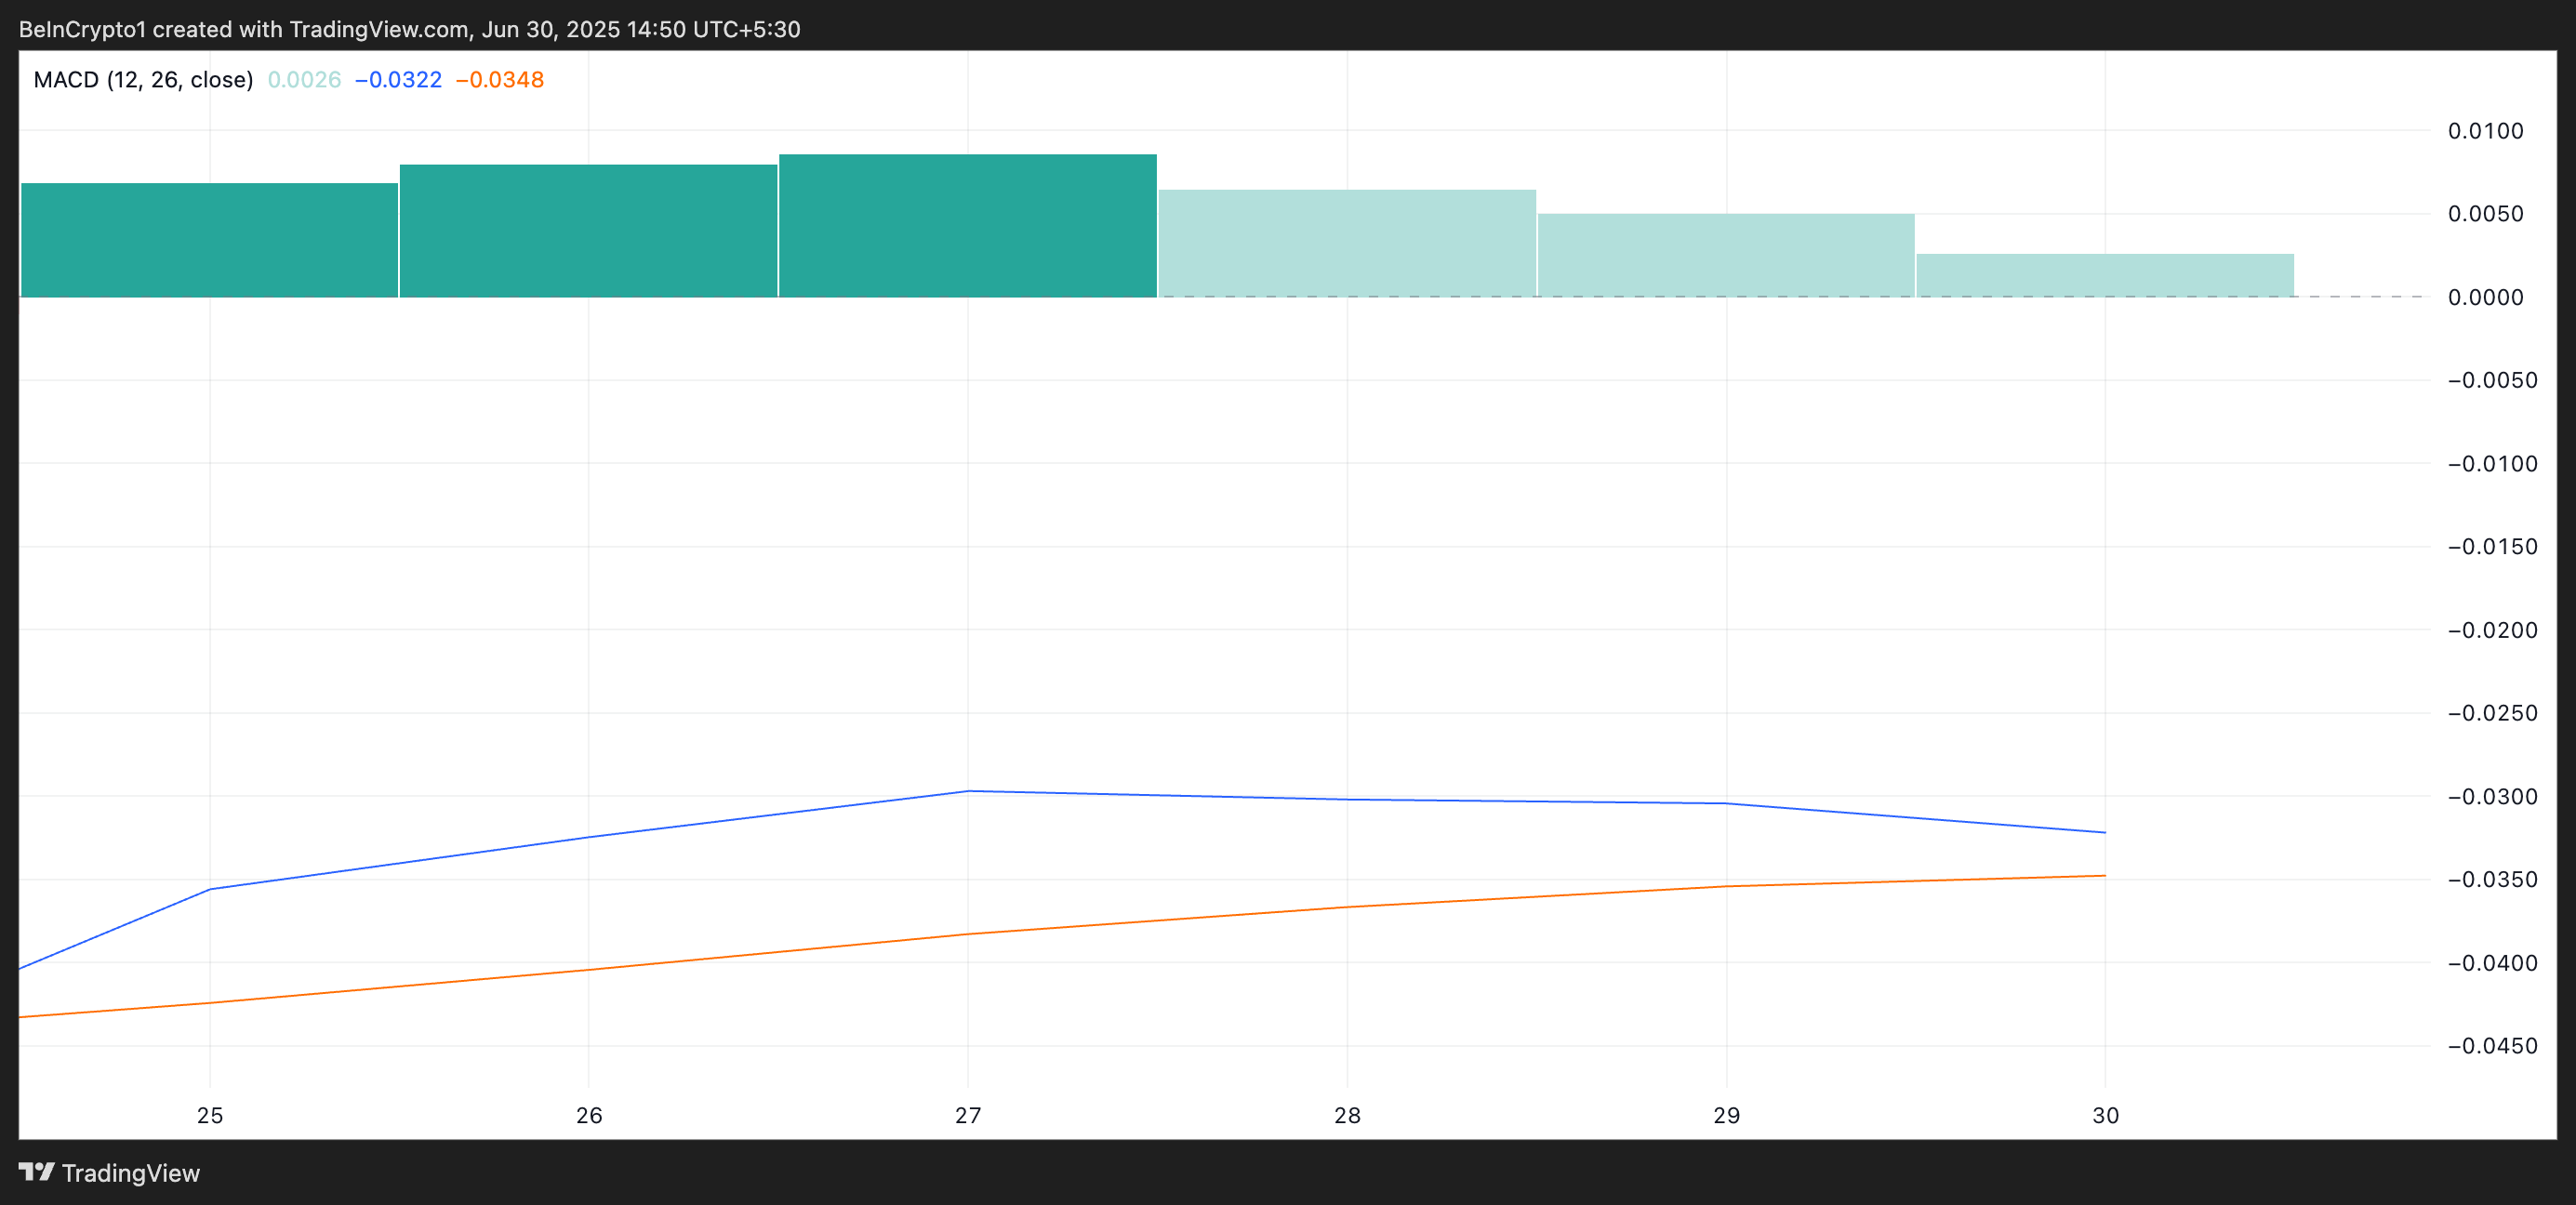
This bearish outlook is strongly supported by momentum indicators such as the Relative Strength Index (RSI) and the 200-day Exponential Moving Average (EMA) on the daily time frame.
Current Price Momentum
As of writing, SOL was trading near $107 and had registered a price drop of over 1% in the past 24 hours. Meanwhile, the asset showed a strong recovery, having hit a low of $95.6 during the Asian market session. Amid this significant price fluctuation and market volatility, SOL’s trading volume has skyrocketed by 185% during the same period.
$140 Million Worth of SOL Outflow
While examining the on-chain metrics, it appears that whales, investors, and long-term holders have seized the opportunity to accumulate SOL at the current price level, according to the on-chain analytics firm Coinglass.
Source: Coinglass
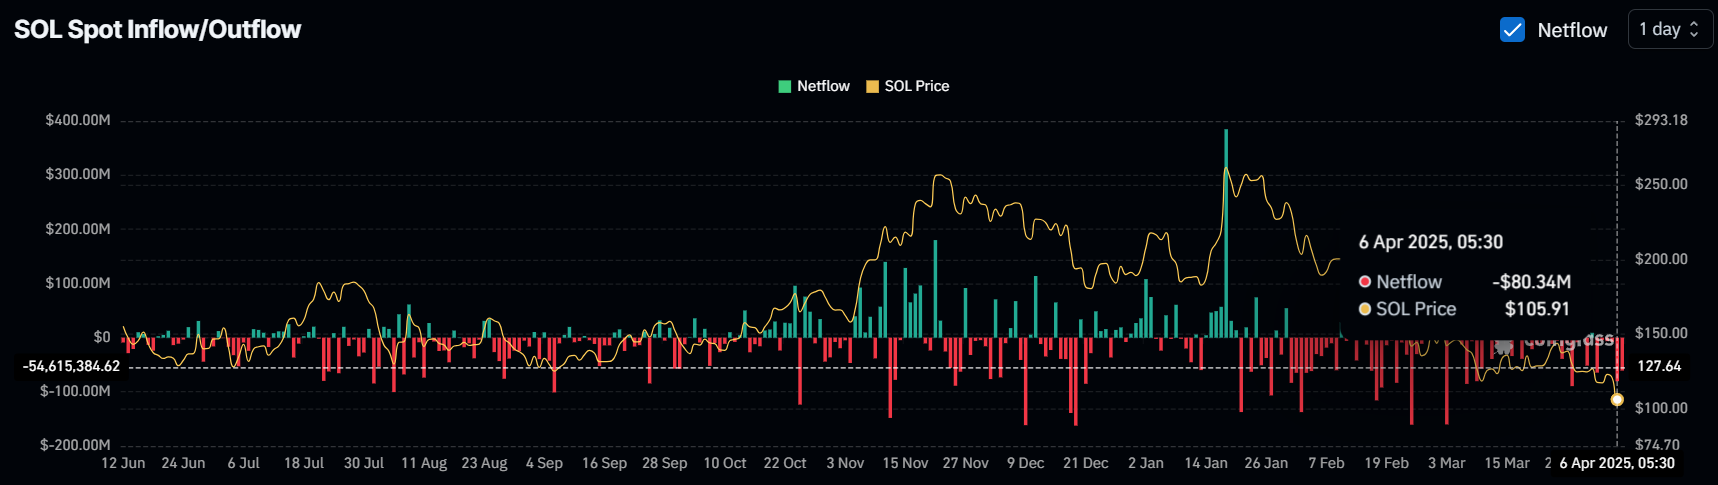
Data from spot inflow/outflow reveals that exchanges have seen an outflow of approximately $140 million worth of SOL over the past 24 hours. This substantial outflow suggests potential accumulation and could lead to buying pressure.
However, due to the prevailing bearish sentiment, a strong upside rally may be difficult to achieve.
US-based Coinbase has reportedly agreed to purchase the largest crypto options firm in the world, Deribit. The deal, valued at $2.9 billion, will see Coinbase expand its reach toward crypto derivatives, but parties will have to sidestep a few regulatory hurdles.
Coinbase Moves To Acquire Deribit For $2.9 Billion
After months of horse-trading, Coinbase has inked a deal to acquire crypto options platform Deribit for $2.9 billion. According to a report by the Wall Street Journal (WSJ), the deal will see Coinbase expand the scope of its offerings to include spot, futures, and options.
Joining forces with Deribit will send Coinbase to the top of the rankings for crypto derivatives by options volume and open interest. Deribit holds $30 billion in open interest and trading volumes surpassing $1 billion, with pundits describing the deal as a “steal” for the US-based exchange.
“This is a global step in our global expansion strategy,” said Coinbase in a statement. “With Deribit’s strong international presence and Coinbase’s regulated US and international operations, we’re set to offer unparalleled access to crypto derivatives around the world.”
Bitcoin (BTC) enters May 2025 with renewed momentum, gaining over 14% in the past 30 days and trading just 6.3% below the key $100,000 mark. Behind the price action, Bitcoin’s apparent demand has turned positive for the first time since late February, signaling a shift in on-chain behavior.
However, fresh inflows—especially from US-based ETFs—remain subdued compared to 2024 levels, suggesting institutional conviction has yet to fully return. According to MEXC COO Tracy Jin, if current conditions hold, a summer rally toward $150,000 is plausible, with sentiment turning increasingly bullish.
Bitcoin Apparent Demand Turns Positive, But Fresh Inflows Still Lacking
Bitcoin’s apparent demand has shown clear signs of recovery recently, rising to 65,000 BTC over the past 30 days. This marks a sharp rebound from the trough on March 27, when apparent demand—defined as the net 30-day change in holdings across all investor cohorts—reached a deeply negative level of -311,000 BTC.
Apparent demand reflects the aggregated balance shifts across wallets and provides insight into whether capital is entering or exiting the Bitcoin network.
While the current demand level is still well below earlier peaks in 2024, a meaningful inflection point occurred on April 24: Bitcoin’s apparent demand turned positive and has remained positive for six consecutive days after nearly two months of sustained outflows.
Despite this improvement, broader demand momentum remains weak.
The continued lack of significant new inflows suggests that most of the recent accumulation may be driven by existing holders rather than fresh capital entering the market.
For Bitcoin to mount a sustainable rally, both apparent demand and demand momentum must show consistent and synchronized growth. Until that alignment occurs, the current stabilization may not support a strong or prolonged price breakout.
US Spot Bitcoin ETF Inflows Still Far Below 2024 Levels
Bitcoin purchases from U.S.-based ETFs have remained largely flat since late March, fluctuating between daily net flows of -5,000 to +3,000 BTC.
This activity level sharply contrasts with the strong inflows seen in late 2024, when daily purchases frequently exceeded 8,000 BTC and contributed to Bitcoin’s initial rally toward $100,000.
So far in 2025, BTC ETFs have collectively accumulated a net total of 28,000 BTC, well below the more than 200,000 BTC they had purchased by this point last year.
This decline shows a slowdown in institutional demand, which has historically been key in driving major price movements.
Bitcoin: Net Cumulative Inflows to US Spot ETFs by Year. Source: CryptoQuant.
There are early signs of a modest rebound, with ETF inflows beginning to tick higher recently. However, current levels remain insufficient to fuel a sustained uptrend.
ETF activity is often viewed as a proxy for institutional conviction, and a notable increase in purchases would likely signal renewed confidence in Bitcoin’s medium-term trajectory.
Until those inflows return in force, the broader market may struggle to generate the momentum needed for a prolonged rally.
Bitcoin Nears $100,000 as Momentum Builds Despite Macro Pressure
Bitcoin price has gained over 14% in the past 30 days, rebounding strongly after dipping below $75,000 in April.
This renewed momentum comes as BTC shows relative resilience amid broader macroeconomic volatility and policy-driven pressures, including Trump’s tariff measures that have weighed on risk assets.
While the entire crypto market has felt the impact, Bitcoin appears to be detaching slightly, showing less sensitivity to these external shocks than other digital assets.
BTC now sits just 6.3% below the $100,000 mark and remains under 17% from a potential move toward $110,000. According to Tracy Jin, COO of MEXC, sentiment is turning positive again:
“Beyond immediate price action, the growing institutional appetite and shrinking supply mechanisms against the macroeconomic uncertainty backdrop point to a structural shift in Bitcoin’s role within the global financial market. BTC is used to hedging against inflation and the fiat-based financial model. Its liquidity, scalability, programmability, and global accessibility offer a reliable modern alternative to traditional financial instruments for many corporations,” Jin said.
According to Jin, a summer rally towards $150,000 is plausible. She stressed that the $95,000 range will likely become a launch point for the brewing decisive breakout above $100,000 in the coming days.
” Should global trade tensions stabilize further and institutional accumulation continues, a summer rally towards $150,000 is plausible, potentially extending towards $200,000 by 2026. Overall, the external background remains favorable for the continuation of the upward movement, especially given the growth of stock indices on Friday, which could support Bitcoin over the weekend.”
SUI blockchain has been gaining traction in recent weeks, and its market cap is now approaching $7 billion. Fueled by meme coin activity and rising DeFi engagement, the network has seen a notable jump in DEX volume and technical momentum.
While indicators like RSI and EMA lines show early signs of a potential trend shift, overall strength remains mixed. SUI sits at a key crossroads—supported by short-term excitement but still needing stronger confirmation to challenge top-tier chains.
SUI Surges to 5th in DEX Volume, But Still Trails Top Chains
SUI’s recent surge in DEX activity has grabbed attention, largely fueled by growing interest in meme coins and speculative trading on its ecosystem. Over the past seven days, SUI’s DEX volume hit $2.1 billion, marking a 4.49% increase and continuing its steady upward trend.
This momentum has helped SUI outperform other ecosystems, most notably surpassing Arbitrum in the past 24 hours to become the fifth-largest chain by DEX volume.
However, despite the short-term gains, SUI still trails well behind top-tier networks like Base, BNB Chain, Ethereum, and Solana in total DEX activity.
Chains Sorted By DEX Volume In The Last 24 Hours. Source: DeFiLlama.
These established ecosystems continue to dominate in terms of liquidity, user base, and overall transaction volume.
While SUI’s rise is notable, especially given its relatively new position in the DeFi ecosystem, it will need to sustain this growth and diversify beyond meme coin hype to truly challenge the leading players.
For now, it remains an exciting underdog with momentum—but not yet a major contender.
SUI Momentum Rebuilds, But Trend Remains Weak
SUI’s RSI is now at 51.86, up from 35.22 just three days ago. This suggests buying pressure has returned after a short-term dip, helping stabilize price action.
The Relative Strength Index (RSI) measures momentum on a scale from 0 to 100. Readings above 70 are considered overbought, while those below 30 indicate oversold conditions.
Sitting near the midpoint, SUI’s RSI points to neutral momentum. It hasn’t crossed above 70 in almost a month, showing that bullish strength has remained limited.
Meanwhile, SUI’s DMI (Directional Movement Index) shows that its ADX is down to 9 from 14.79 just two days ago. The ADX measures trend strength, and anything below 20 signals a weak or nonexistent trend.
The +DI is at 15.83 while the -DI is at 13.15, meaning buyers have a slight edge—but the low ADX suggests that edge isn’t strong. There’s no clear trend dominating the market right now.
Together, the RSI and DMI suggest that SUI is in a consolidation phase. Buyers are showing some activity, but not enough to build a strong, sustained trend—at least for now.
EMA Setup Still Bearish, But SUI Bulls Show Signs of Life
SUI’s EMA lines are still showing a bearish setup, with short-term averages sitting below the long-term ones. However, the gap between them has narrowed, and a potential golden cross may be forming.
A golden cross occurs when a short-term EMA crosses above a long-term one, often seen as a bullish signal. If this plays out, SUI could gain momentum and push toward the $2.28 resistance level.
Breaking above that could open the path toward $2.41 and $2.54. If bullish momentum builds further, SUI blockchain could even test the $2.83 level—its highest since early March.
But if the market fails to hold current levels and selling pressure returns, a correction could begin. In that case, it might fall back to test the $2.02 support.
Losing that support could bring deeper downside, potentially pushing SUI toward $1.71. For now, price action is at a critical point, with both breakout and breakdown scenarios on the table.