Solana price today appears to be gaining bullish traction, with the SOL price rebounding strongly from the $120 support zone. Over the past 30 days, the altcoin has gained 8.9%, including a 6.3% rise in the last week.
After plunging to $95.19 on April 7, SOL witnessed a surge in buying pressure. By April 11, the token reclaimed the $120 level, which has since acted as solid support. This price recovery has been underpinned by positive technical signals.
Solana Price Analysis
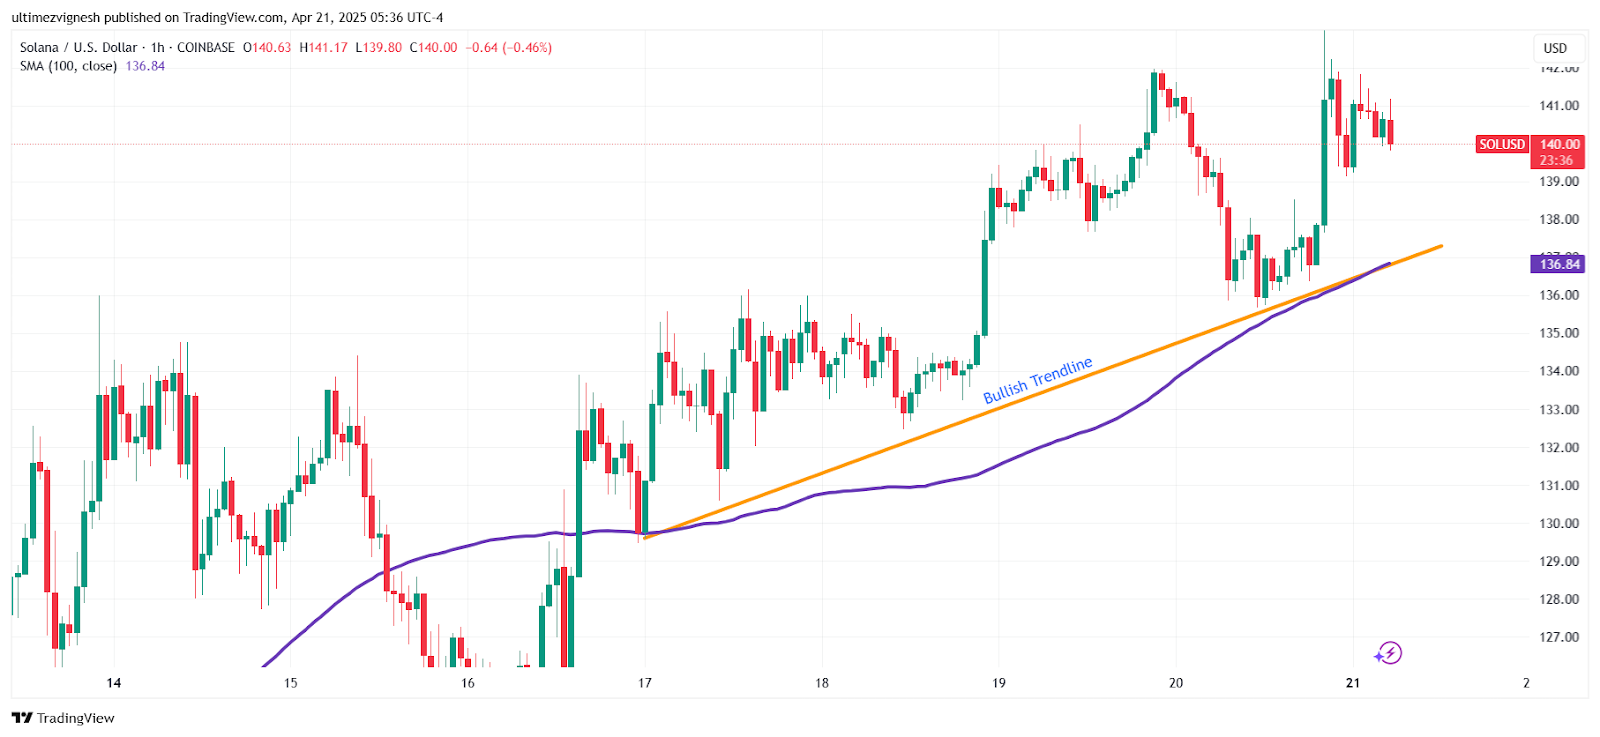
Solana is now trading above the 100-day Simple Moving Average (SMA) at $136.85, which has flipped into support. A bullish trendline has also formed on the hourly chart, with an additional support zone around $137–$138.50.
On the daily chart, the Relative Strength Index (RSI) is at 58.89—indicative of bullish momentum. The MACD indicator further confirms the upward trend.
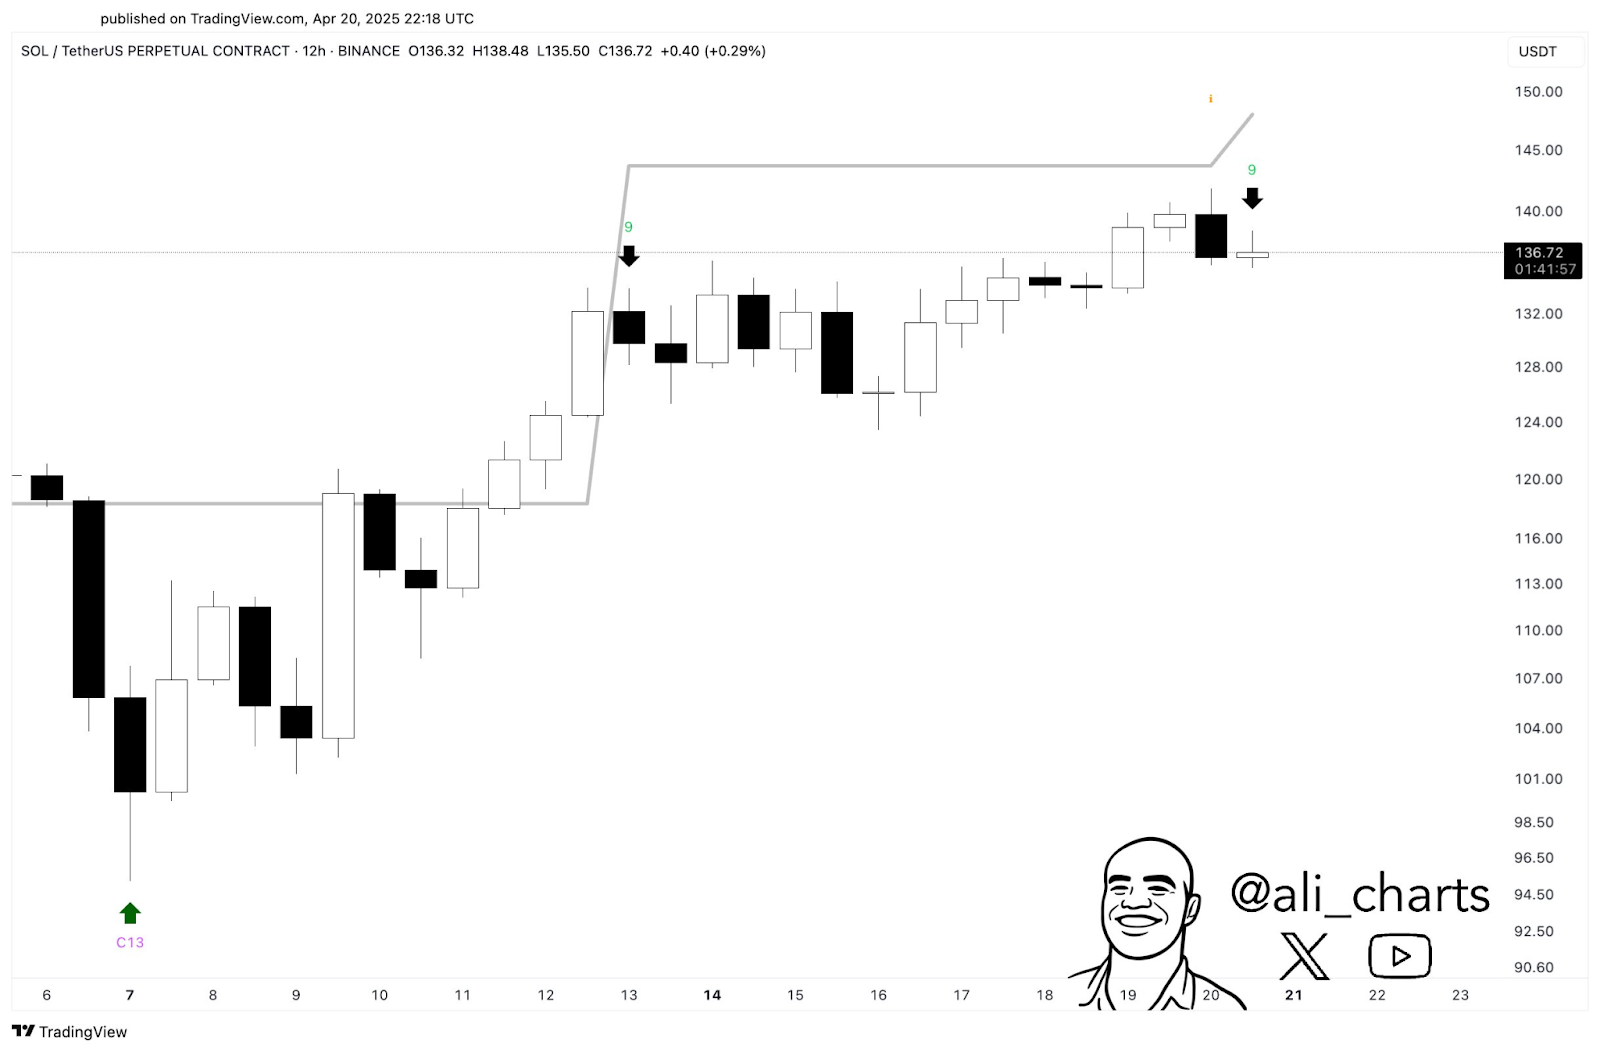
Despite the strong recovery, crypto analyst Ali has flagged a short-term bearish signal using the TD Sequential indicator on the 12-hour chart. The indicator has flashed a “sell” signal, suggesting the possibility of a brief pullback before the next leg higher.
If SOL dips below the $137 support level, a move down to $132 could follow. However, if bulls manage to push past the $145 resistance and sustain above $150, Solana may target $155 and even $165 in the short term.
Never Miss a Beat in the Crypto World!
Stay ahead with breaking news, expert analysis, and real-time updates on the latest trends in Bitcoin, altcoins, DeFi, NFTs, and more.
Shiba Inu price looks prime for a parabolic rally amid a looming supply crunch and a recovery across the meme coin sector. In the last seven days, the total meme coin market cap has gained nearly 10% from $48 billion to $52 billion at press time. Amid these bullish tailwinds, can SHIB price reach the highly anticipated psychological level of $0.001?
Shiba Inu Price in Focus Amid Mysterious 1B SHIB Burn
The Shiba Inu burn rate skyrocketed recently after an unknown user burned 1,000,000,000 SHIB tokens. Data from Shibburn shows that this user sent these tokens to the burn address in a single transaction. Yesterday, another address also sent 23M SHIB to the burn address.
SHIB Burn
One of the main factors contributing to the high burn rate is a spike in activity on the Shibarium network. DeFi tracking tool DeFiLlama shows that in just one week, Shibarium’s TVL has increased by over $1M and recently reached its highest level since late January.
Shiba Inu DeFi TVL
As Shibarium records an uptick in activity, the burn rate will continue to surge and bring down SHIB’s supply. This will bode well for Shiba Inu price.
SHIB Supply Crunch Looms
Besides the token burns, Shiba Inu supply on exchanges has also reached its lowest level in four years. According to Santiment, SHIB’s exchange experienced a sharp decline earlier this year, and only 100.42 trillion tokens, valued at around $1.3 billion are available on exchanges.
Shiba Inu Supply on Exchanges
The amount of SHIB held on exchanges is only 16% of the meme coin’s circulating supply of 589 trillion tokens. This decline indicates that many SHIB holders are not holding their tokens on exchanges, which highlights a lack of intent to sell.
As this supply continues to fall, it might cause a supply crunch where demand outpaces the supply. This could spark a parabolic rally for Shiba Inu price.
Can Shiba Inu Reach $0.001?
The $0.001 price target is realistic for Shiba Inu as that would give it a $589B market cap. One of the factors that could aid such a rally is a gradual increase in the SHIB burn rate.
Additionally, increased activity on Shibarium could sustain a long-term uptrend. Early Bitcoin advocate Davinci Jeremie previously stated that Shibarium will unlock SHIB’s potential.
The possible launch of a spot SHIB ETF as highlighted by SHIB marketing executive LUCIE could also drive a price rally to $0.001. If Shiba Inu outperforms the rest of the crypto market and attains this price target, it will not only be the largest meme coin but also the largest altcoin.
Shiba Inu Price Analysis
Shiba Inu price today trades at $0.0000135 with a 2.5% gain in 24 hours, The meme coin is on the verge of a breakout after breaking above the upper trendline of a descending parallel channel, indicating that bears are losing control as buying pressure rises.
The rising RSI line also supports this bullish Shiba Inu price prediction. This indicator stands at 51, which is a neutral level. However, the making of higher lows shows that selling pressure is easing.
Shiba Inu faces two key resistance levels which, if breached, will confirm a bullish reversal. One of these levels is the 50-day SMA of $0.0000141. If the meme coin flips this resistance, it could trigger a 36% surge to the 200-day SMA of $0.000019.
SHIB/USDT: 4-hour Chart
In summary, Shiba Inu price is likely to break crucial resistance at the 50-day SMA, which will confirm a reversal from bearish to bullish trends. The increasing burn rate caused by an uptick in activity on Shibarium as well as the falling supply on exchange could trigger a supply crunch. This could precede a parabolic rally for SHIB.
The crypto market sentiment has bounced from fear to neutral as Bitcoin and most altcoins recover. Amid this recovery, traders are frantically looking for the best crypto to buy to secure significant returns and possibly make 10x gains within weeks. In this article, we explore the best 3 altcoins with a strong bullish outlook and robust fundamentals that traders can invest in today.
Best Crypto to Buy Right Now For Massive Gains
The best crypto to buy right now for massive gains in the coming weeks are Solana (SOL), Dogecoin (DOGE), and Shiba Inu (SHIB). Besides flashing bullish technical indicators, these top altcoins have some strong fundamentals that can sustain a long-term uptrend, possibly to all-time highs.
Solana (SOL)
Solana is the best crypto to buy now, as the positive market sentiment teases at a price rally to $300. As a recent Coingape article reported, BlackRock has expanded its $1.75B tokenization fund to the Solana blockchain to leverage its fast speeds and low transaction costs. Additionally. Fidelity has filed to have its spot SOL ETF listed on the Cboe exchange.
The rising interest from Wall Street is among the reasons why traders should consider buying the SOL altcoin right now. Meanwhile, the one-day Solana price chart indicates that the momentum is shifting to bullish.
The RSI has risen to 52, its highest level since early February. This indicates that selling pressure is no longer dominating the price action as buyers take control. At the same time, the MACD line is rising while the histogram bars are flashing green, which also shows a bullish Solana price prediction.
SOL/USDT: 1-day Chart
The strong technical outlook and institutional adoption indicate that Solana is the best crypto to buy now as it shows signs of surging to an all-time high near the $300 psychological level.
Dogecoin (DOGE)
Dogecoin has outperformed all the other top-ten largest cryptos by market cap in the last week making it one of the best crypto to buy. This top meme coin trades at $0.20 today with an 8% gain in 24 hours. Dogecoin price is also up by 19% in seven days.
One of the factors driving these gains is whale activity. In the last two weeks, whales have accumulated 200M DOGE, suggesting optimism that the meme coin could lead the broader crypto market recovery.
The derivatives market data also suggests that traders are anticipating a major price move. At press time, derivative trading volumes had surged by 35%, while open interest soared by 13% in 24 hours to $2.16 billion. This marks its highest level in one month.
Dogecoin Open Interest
As open interest rises when the price also increases, it supports a bullish outlook and suggests that DOGE is one of the top altcoins to buy.
Shiba Inu (SHIB)
Shiba Inu is expanding its presence in the decentralized finance (DeFi) industry, making SHIB one of the best crypto to buy. Recently, the SHIB development team revealed that trading volumes on ShibaSwap have surged by 238% in 30 days, making it one of the fastest-growing DEXs.
Shiba Inu marketing lead LUCIE has also teased the launch of Shib Finance, to bolster DeFi activity. This launch will bode well for the Shiba Inu price, which could surge to all-time highs.
The daily chart shows that bulls are now in control. SHIB price has flipped the 50-day EMA confirming a bullish reversal. The RSI has also made a sharp rise to its highest point since December 2024. This setup suggests SHIB could reach the 200-day EMA of $0.0000179 soon, making it a top altcoin to buy.
SHIB/USDT: 1-day chart
Summary of Best Crypto to Buy
The crypto market is showing signs of a bullish recovery as trader sentiment shifts from fear to neutral. Amid this shift, the three crypto to buy to secure significant returns are SOL, DOGE, and SHIB. These coins have some strong fundamentals and a bullish technical setup.
Bitcoin (BTC) is up 9% over the past week and is currently trying to establish support above the key $88,000 level. Momentum indicators like the DMI and Ichimoku Cloud are showing clear bullish signals, with buyers firmly in control.
If this trajectory continues, BTC could soon test higher resistances near $88,000 and potentially aim for $90,000 and beyond. However, analysts warn that renewed uncertainty around Trump’s trade tariffs could disrupt the rally and trigger a pullback toward the $81,000 support zone.
Bitcoin DMI Show Buyers In Full Control
Bitcoin’s DMI chart shows a notable rise in trend strength, with the ADX climbing to 29.54 from 24.07 yesterday.
This increase suggests growing momentum behind the current move, pushing the ADX close to the 30 threshold—widely seen as confirmation of a strong, sustained trend.
A rising ADX doesn’t indicate direction on its own, but when paired with directional indicators, it helps identify the prevailing force in the market.
Looking at those directional indicators, the +DI is currently at 23.47 and has remained steady between 21 and 23 over the past two days.
Meanwhile, the -DI has dropped sharply to 9.45 from 16.65, signaling a significant decline in bearish pressure.
This widening gap between bullish and bearish momentum points to buyers taking control, and if the ADX continues to rise above 30, it could validate a new bullish phase for BTC.
BTC Ichimoku Cloud Shows A Clear Bullish Structure
Bitcoin’s Ichimoku Cloud chart continues to lean bullish, with price holding firmly above both the Tenkan-sen (blue line) and Kijun-sen (red line).
Looking ahead, the Kumo (cloud) is green and steadily rising, which reinforces a positive outlook for the coming sessions. The price is well above the cloud, indicating the trend is bullish and also firmly established.
There’s also a clear gap between the current candle and the cloud, suggesting that the market has room to retrace without shifting the overall structure.
As long as the price stays above the Kijun-sen and the cloud remains green, the bullish trend remains technically intact.
Will Bitcoin Break Above $90,000 Soon?
If Bitcoin price maintains its current momentum, it could soon challenge the resistance at $88,839, with $90,000 as a psychological milestone.
Should the uptrend remain strong, further targets lie at $92,920 and potentially $98,484, marking a continuation of the bullish structure.
However, crypto analyst and Coin Bureau founder Nic Puckrin warns that this momentum could be short-lived. He notes that renewed uncertainty around Trump’s trade tariffs might weigh on BTC:
“The caveat here is that all this positive momentum could disappear in a puff of smoke if there’s any backpedalling on tariffs or an unexpected shock announcement – which we all know is always a possibility. In fact, we continue to have constant back-and-forth on tariffs: exemptions on electronics turned out to be temporary, the details of when tariffs will come in are lacking, and so on,” Puckrin told BeInCrypto.
He also defends that the $81,000 support could be tested again:
“This, perhaps, explains why Bitcoin is, once again, in a “wait and see” pattern, with low liquidations at under $200 million pointing to uncertainty in the market. If we don’t see any external shocks, $88,000-$90,000 is the next range to watch, with liquidity pool clusters at this level suggesting we will see an uptick of volatility here. However, a short-term correction to re-test support at $81,000 would be healthy and, as long as BTC remains above this threshold, would even point to a sustainable price recovery,”
Overall, it looks like the current macroeconomic factors are priced in. Yet, the market is cautious about sudden surprises, as Trump’s recent tariffs went beyond any conventional economic trend and disrupted almost every global financial market.