Solana has seen impressive price gains recently, reaching a two-month high and coming close to breaching the $180 mark.
However, it faces a crucial resistance level that has kept the altcoin from pushing past $200. With market conditions and investor behavior at play, the journey to $200 may be challenging for Solana.
Solana Investors Move To Sell
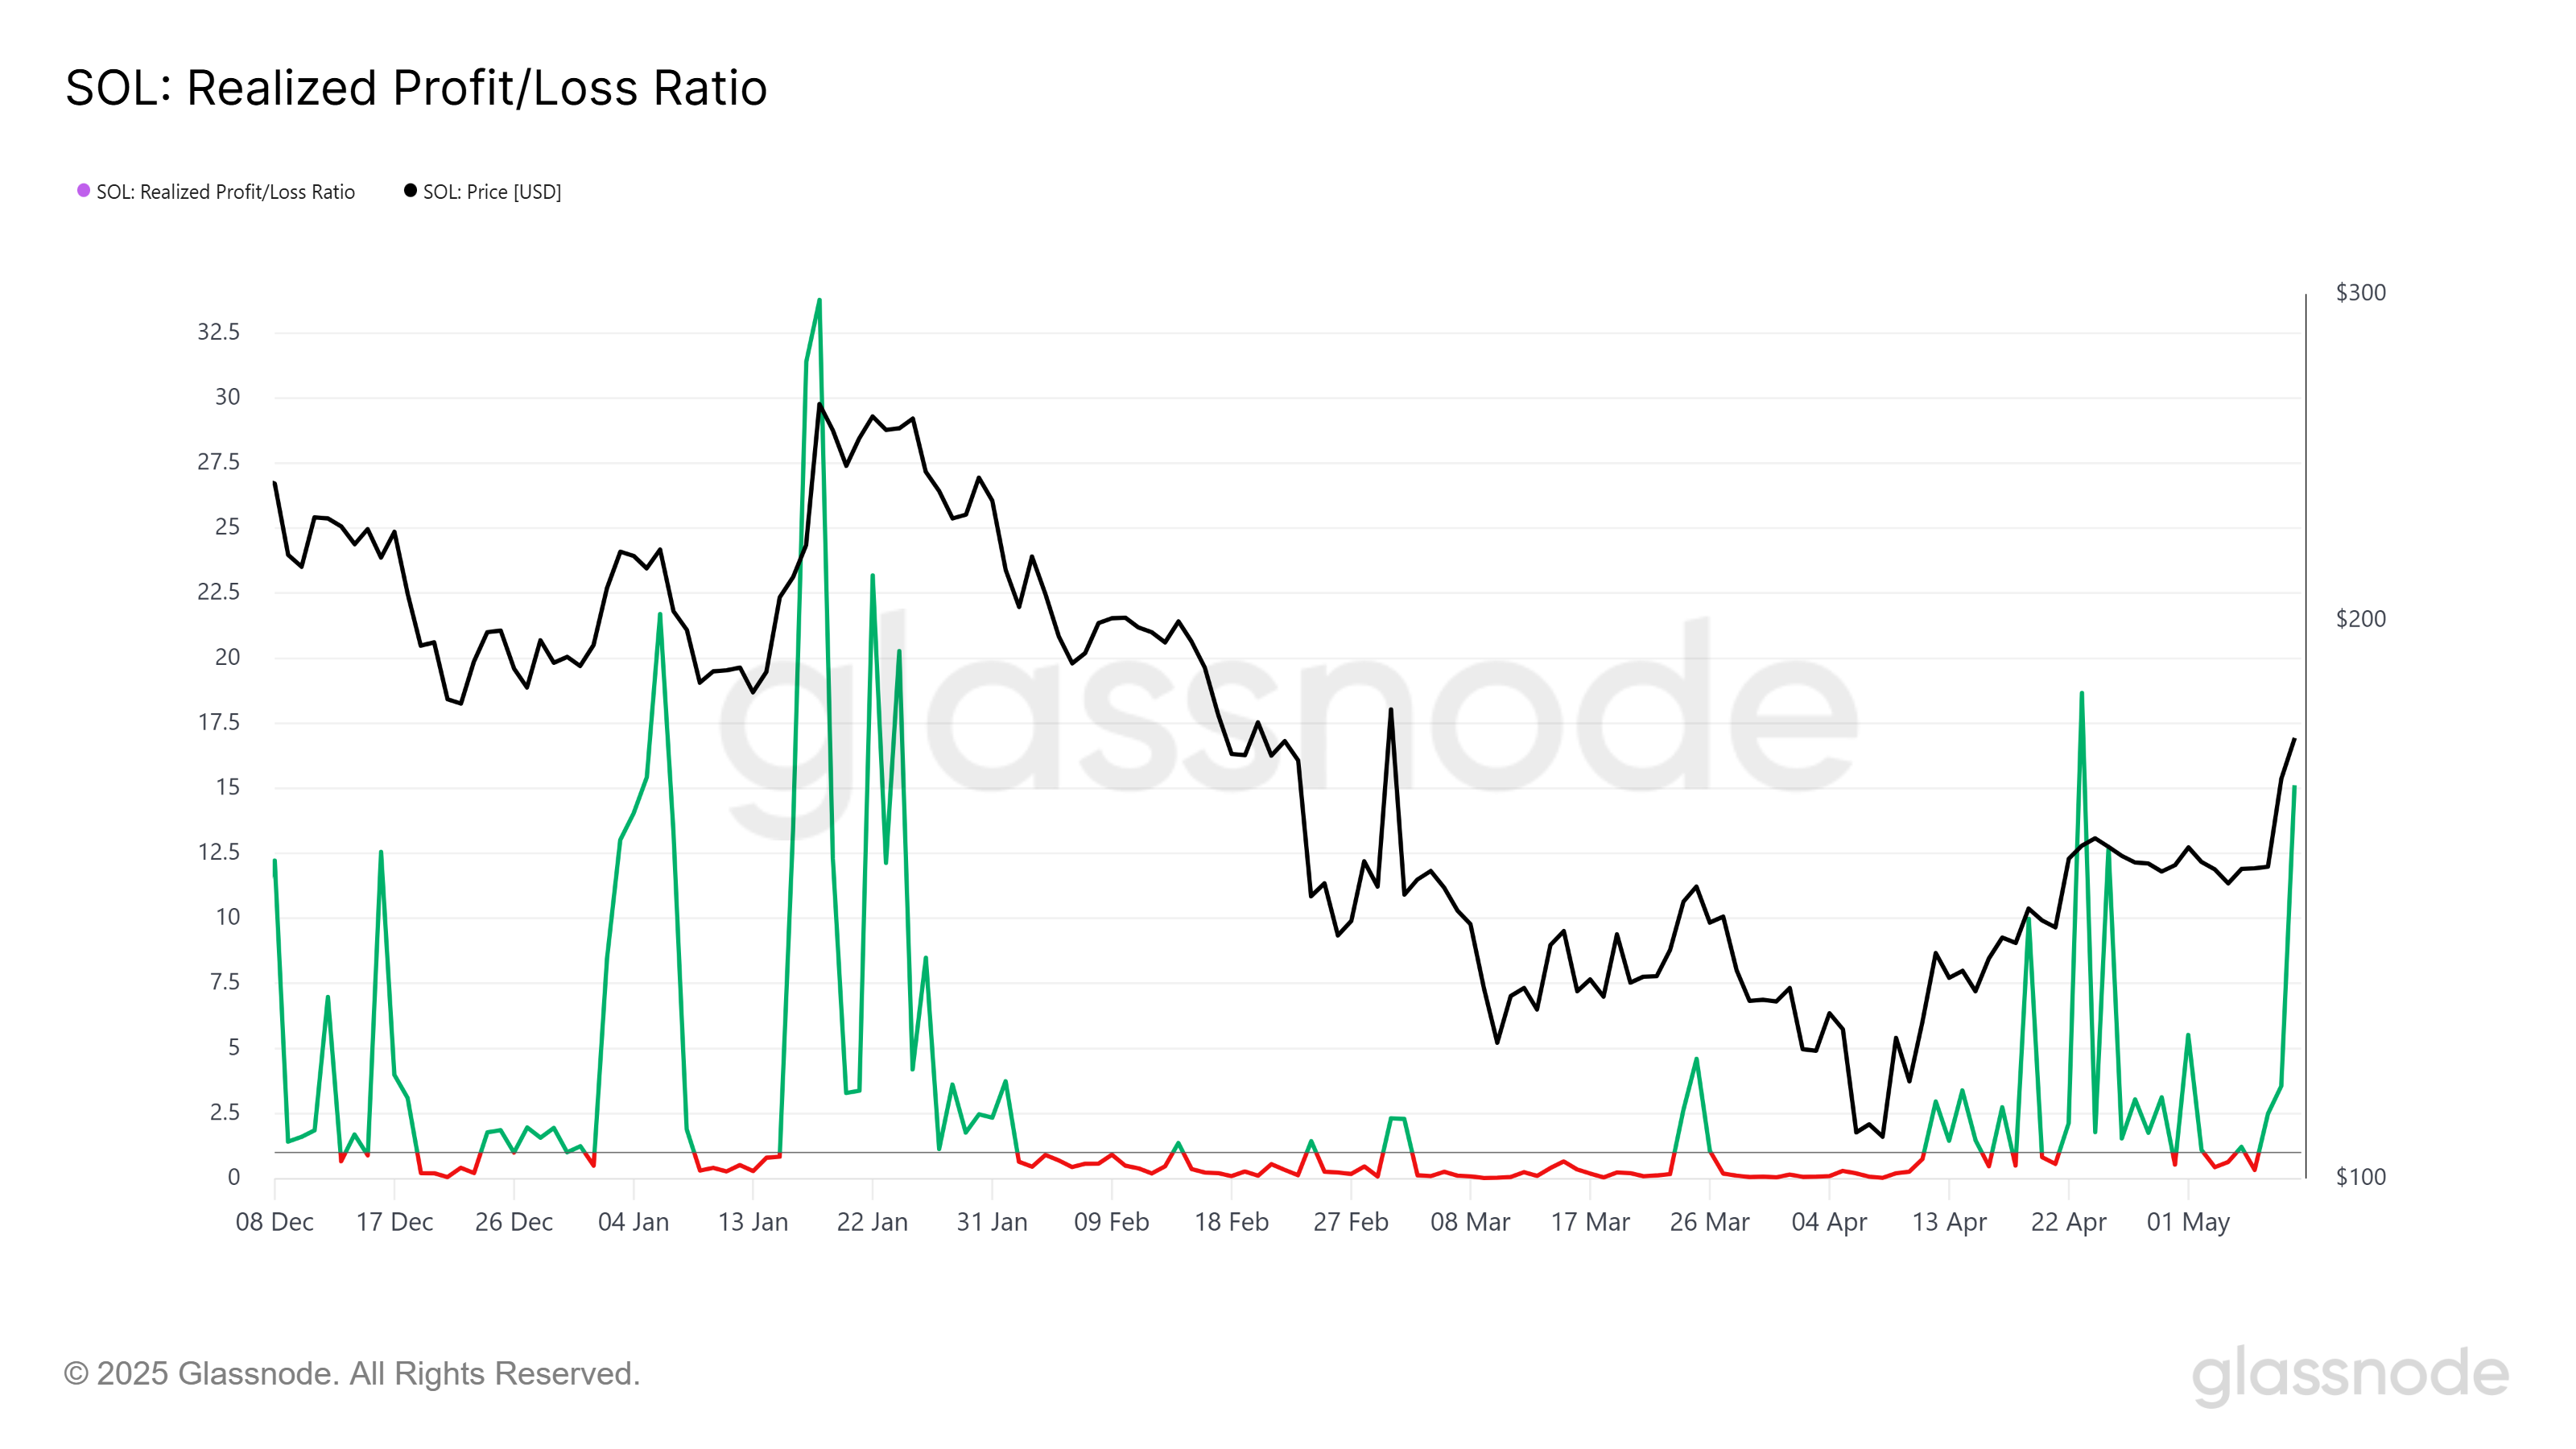
Many Solana (SOL) holders are choosing to book profits, contributing to a rising Realized Profit/Loss ratio. This indicator has surged to 15.0, signaling that excessive selling could be a concern. Historically, when this ratio crosses the 10.0 threshold, it often leads to short-term price corrections.
This profit-taking behavior could also exacerbate market volatility, potentially delaying or halting Solana’s rally. The influx of sales could weigh on the price, even as Solana has managed to make significant gains over the past month.
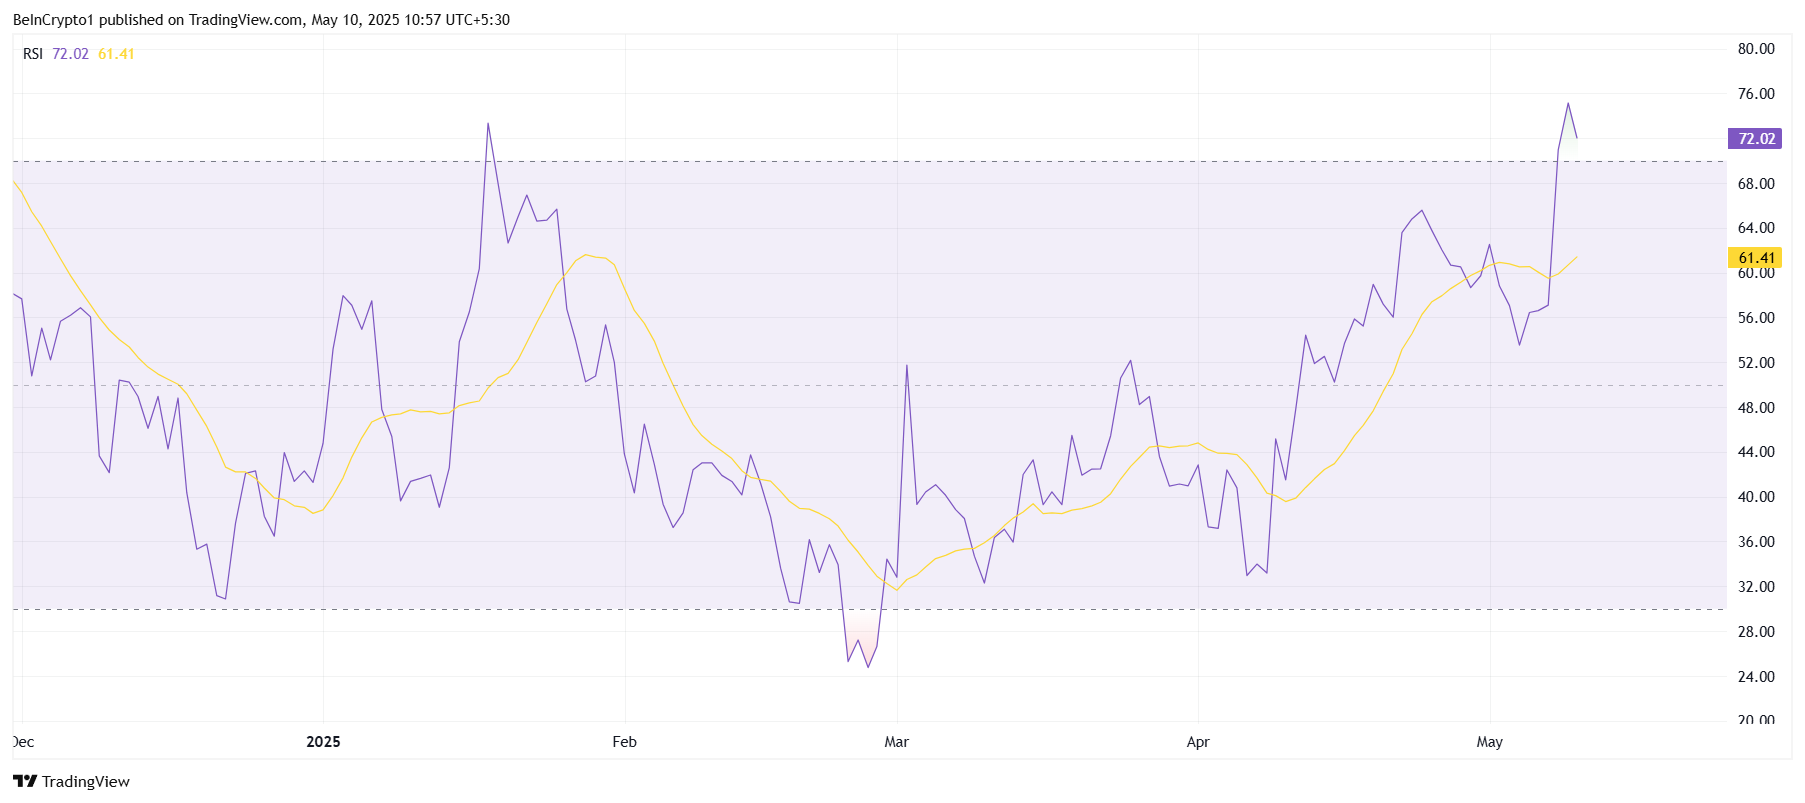
Solana’s technical indicators also suggest that its bullish momentum might be nearing saturation. The Relative Strength Index (RSI) currently sits above 70.0, placing Solana in the overbought zone.
This suggests that the altcoin’s rally could be reaching its peak, similar to what occurred in mid-January 2025, when Solana’s price saw a drop after hitting similar levels. The RSI, combined with investor behavior, signals that Solana’s price may be nearing a short-term decline.
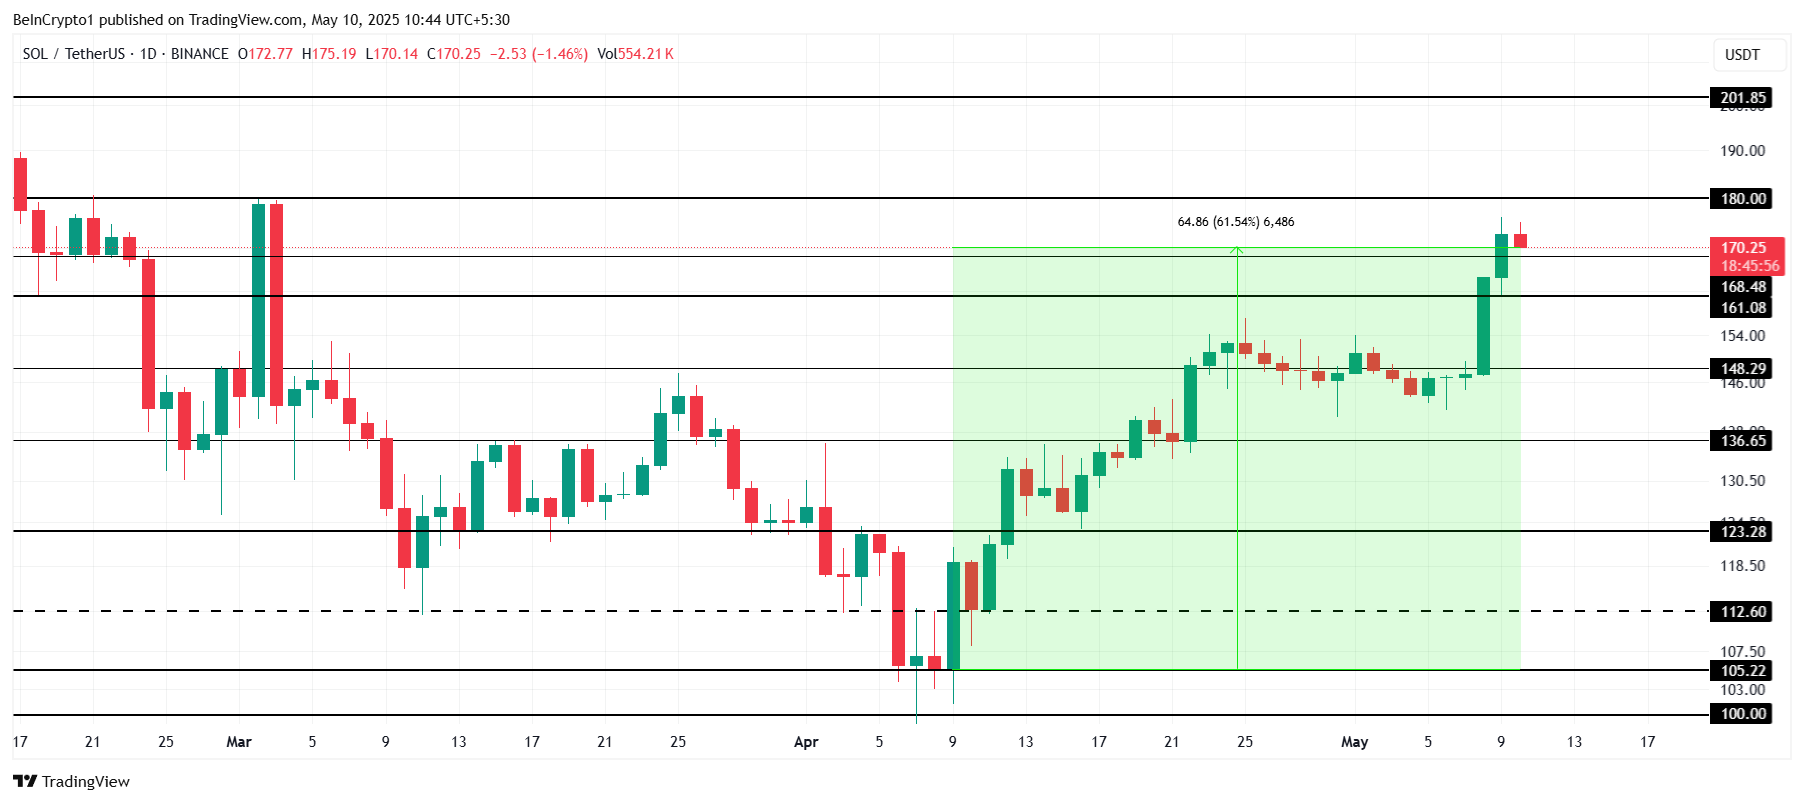
Solana’s price has surged by 61% over the last month, trading at $170 at the time of writing. The altcoin is just under the resistance of $180, not too far from the long-awaited $200 mark.
If the current momentum continues, Solana could break past this resistance and rally towards the $200 milestone, sparking further interest and investment.
However, the factors discussed above may cause concern for Solana’s price. The combination of increased selling pressure and overbought technical indicators could lead to a reversal.
In this case, Solana’s price may fall to $161 or lower, with the $148 level potentially becoming the next key support. This would keep the 3-month barrier of $180 intact, delaying the long-awaited breakthrough.
On the other hand, if the SOL being sold is absorbed by new investors, and the price can hold its gains, Solana may push past the $180 resistance. This would open the path to $200, invalidating the bearish outlook and continuing its bullish trend. Such a move would require sustained market confidence and demand to overcome the current barriers.
According to Wall Street reports, both Amazon and Walmart are evaluating a move into the stablecoin market.
The reports, citing people familiar with the matter, stated that their effort is part of a broader push to improve payment efficiency and reduce processing fees.
Amazon and Walmart Eye Stablecoin
According to the report, the two retail giants are considering multiple options, including issuing their own digital currencies or collaborating within a stablecoin consortium.
These legacy systems often impose high fees and slow settlement times. In contrast, stablecoins promise near-instant transaction finality and significant cost reductions.
Despite the growing interest in these assets, the success of Amazon and Walmart’s stablecoin ambitions may hinge on the evolving US regulatory environment.
The proposed law aims to bring stability to the $251 billion stablecoin market by setting clear rules for issuance, reserve backing, and consumer protection. Its supporters argue that the regulatory clarity would boost public trust and encourage innovation in the emerging industry.
This limitation could pose a significant hurdle for firms like Amazon and Walmart. They would need to secure regulatory exemptions or operate through licensed banking subsidiaries.
Considering this, Alex Thorn, head of research at Galaxy Digital, noted that the retailers would likely need to establish or acquire a regulated financial entity to participate. He added that the process would involve navigating approvals from the Federal Reserve, the FDIC, and the Treasury.
Despite this potential convoluted process, Amazon and Walmart’s interest suggests that major retailers are preparing for a future where stablecoin payments become part of everyday commerce.
Bitcoin (BTC) enters the second week of May trading in a fragile but critical zone, with conflicting technical signals and growing macro uncertainty shaping short-term expectations. While the ADX from the Directional Movement Index is rising, bearish pressure still dominates, and momentum remains weak across multiple indicators.
Although the price continues to hold above the $92,900 support level, weakening EMAs and the looming FOMC meeting leave Bitcoin’s $100,000 recovery path uncertain, but not out of reach.
BTC Trend Strength Rises, but Bears Still in Control
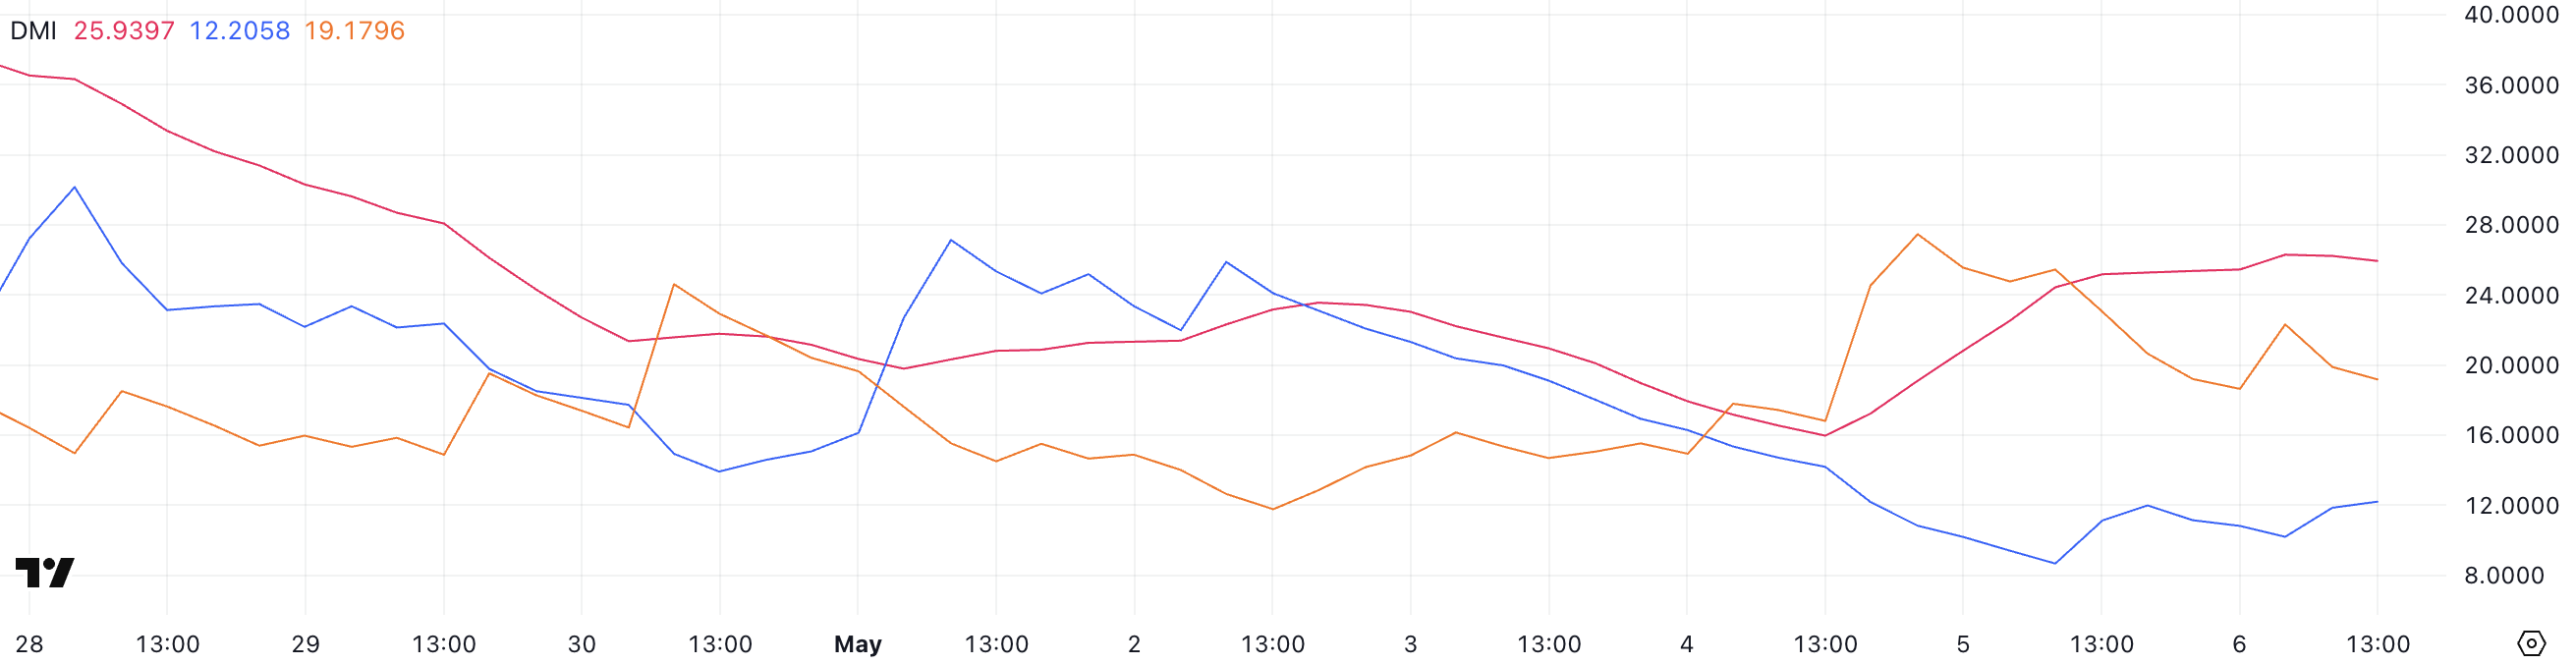
Bitcoin’s Directional Movement Index (DMI) is showing a notable shift.
The ADX, which measures the strength of a trend regardless of direction, has climbed sharply to 25.93, up from 15.97 just two days ago—crossing the key 25 threshold that signals a trend is starting to gain traction.
This rising ADX suggests that volatility is returning and a new directional move may be forming, even if the direction itself is still unclear.
Looking at the components of the DMI, +DI (bullish strength) has bounced to 12.2, up slightly from yesterday’s low of 8.67 but still down significantly from 21.31 three days ago.
Meanwhile, -DI (bearish strength) is at 19.17, slightly off its peak of 25.44 but still higher than three days ago. This indicates that although the recent bearish momentum has cooled somewhat, sellers still have the upper hand.
With ADX rising and -DI leading, Bitcoin could remain under pressure unless +DI recovers sharply in the coming days.
Bitcoin Trapped Below the Cloud as Momentum Stalls
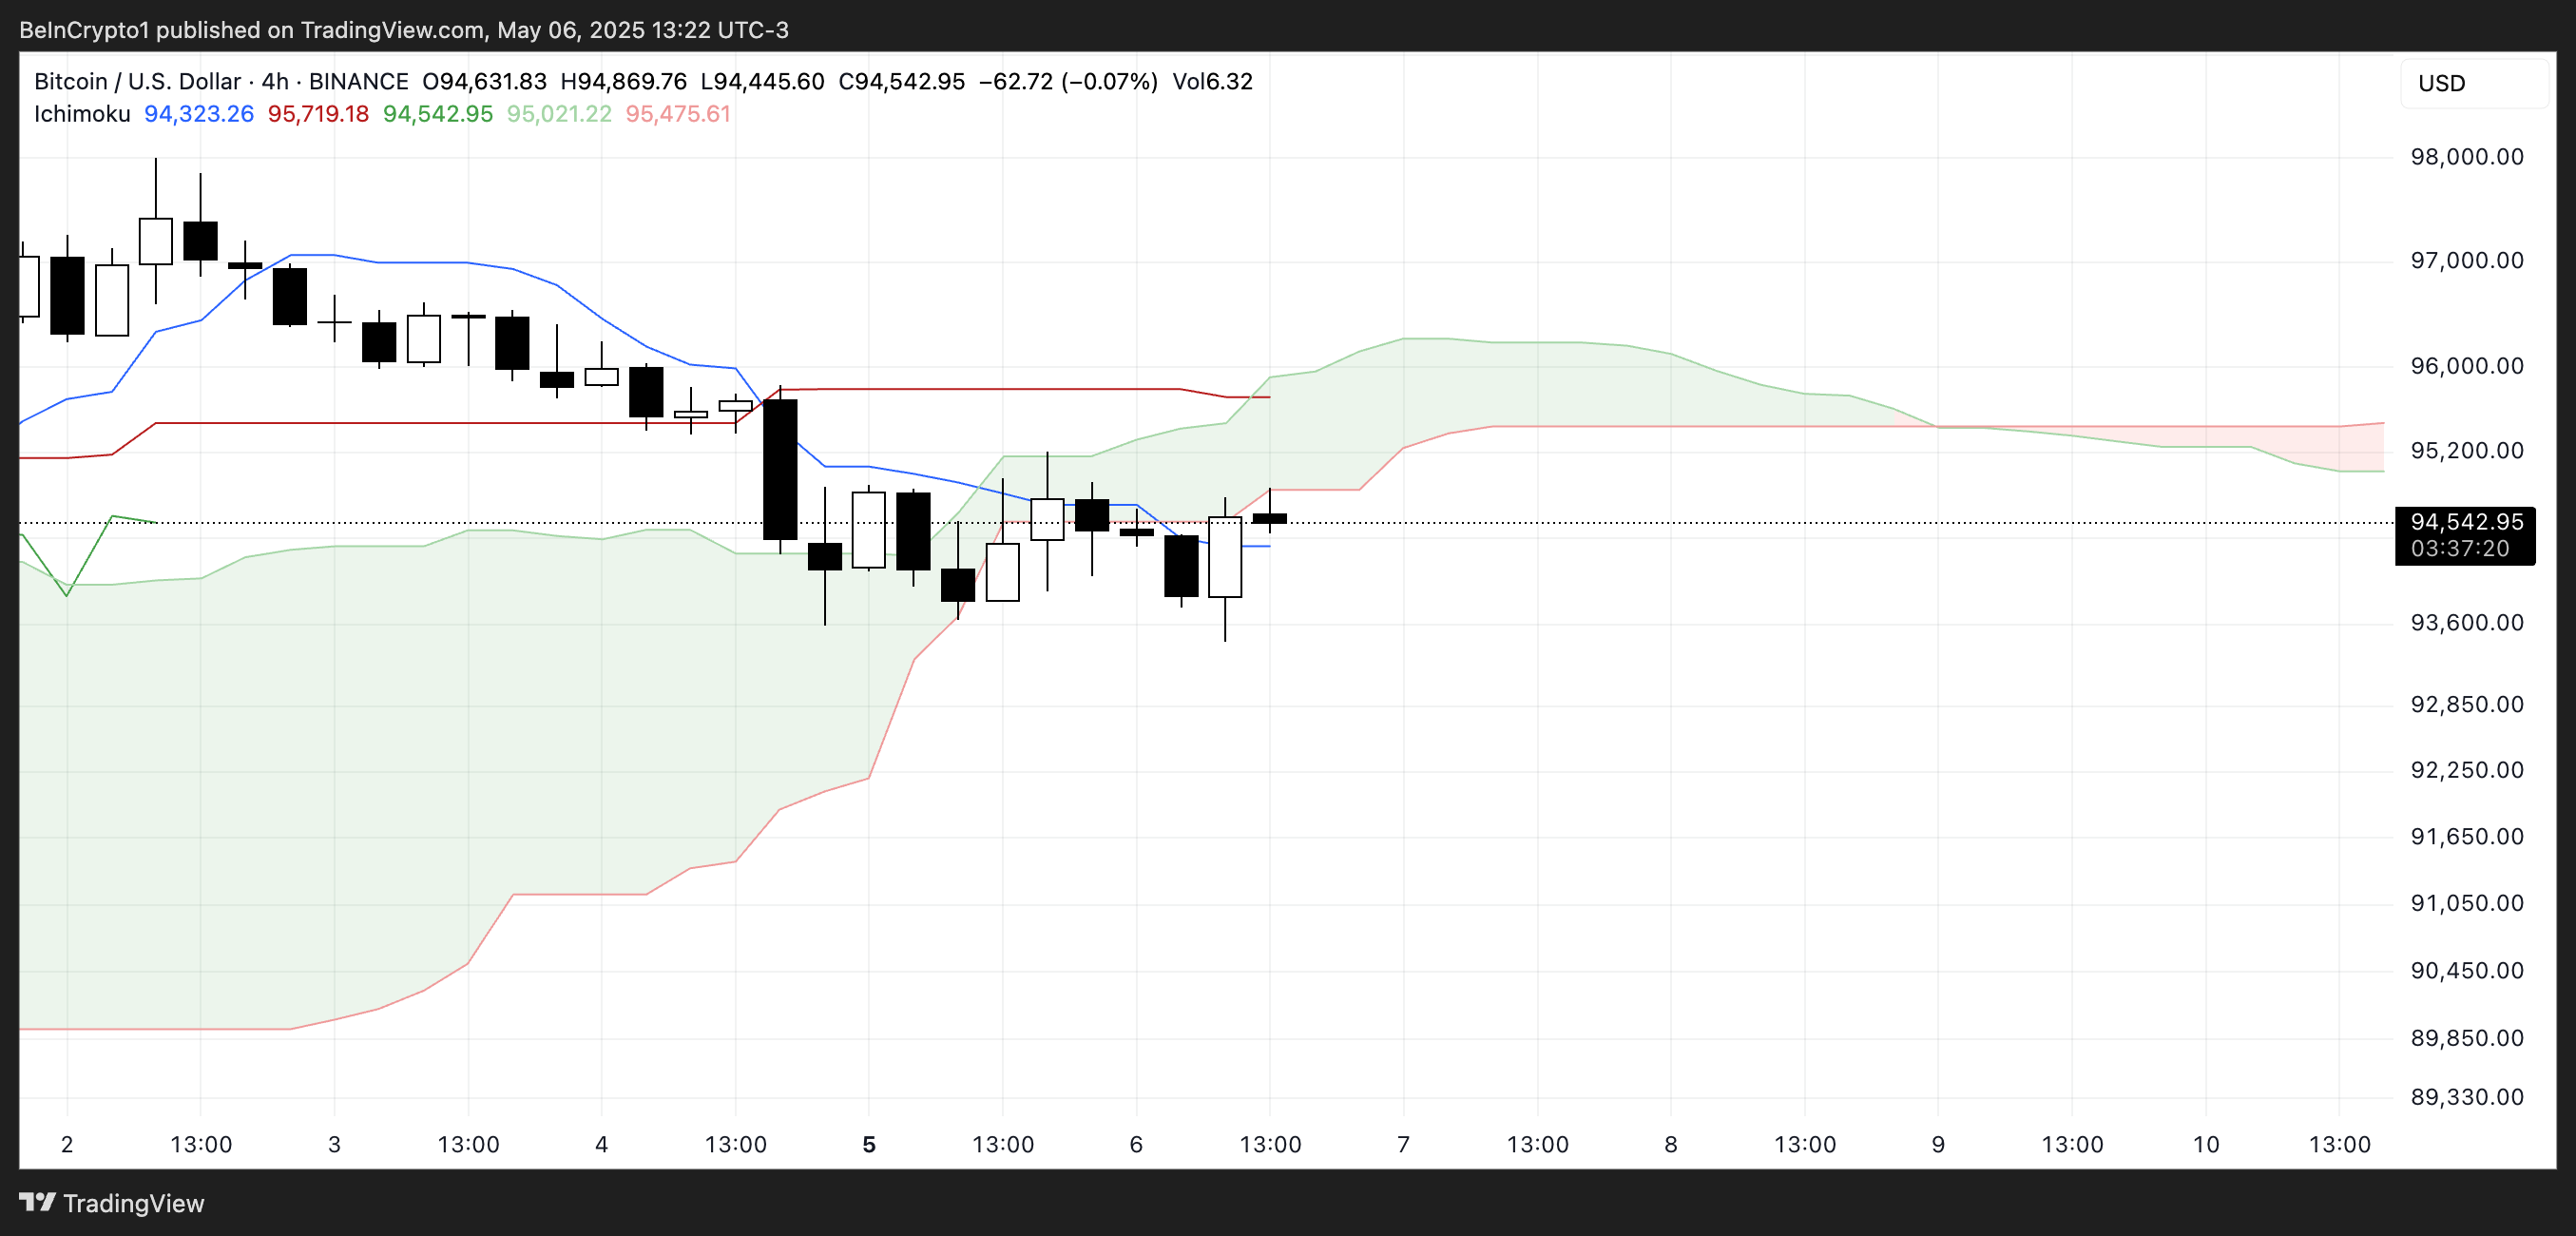
The current Ichimoku Cloud chart for Bitcoin reflects a market in consolidation, with a slight bearish undertone. Price action is sitting very close to the blue Kijun-sen (baseline), which typically represents medium-term trend momentum.
Trading beneath this line suggests that BTC lacks the strength to reclaim bullish momentum in the short term. The white candlesticks hovering near the cloud’s lower boundary indicate indecision among traders, with no clear breakout in sight.
The green Kumo (cloud) itself is relatively thin at this stage, hinting at a fragile support zone that could easily be broken if bearish pressure returns.
Looking ahead, the red Senkou Span B—the top of the projected cloud—is acting as dynamic resistance, capping any upward attempts. For a stronger bullish signal, BTC would need to close decisively above both the Kijun-sen and the entire cloud.
Complicating matters further, the Tenkan-sen (conversion line) is flat and overlapping with the Kijun-sen, signaling weak momentum and a lack of direction. Flat Tenkan and Kijun lines often precede sideways movement or delayed trend development.
Until Bitcoin breaks convincingly above the cloud with rising volume, the current setup leans neutral to bearish, with price trapped in a zone of low conviction and limited momentum.
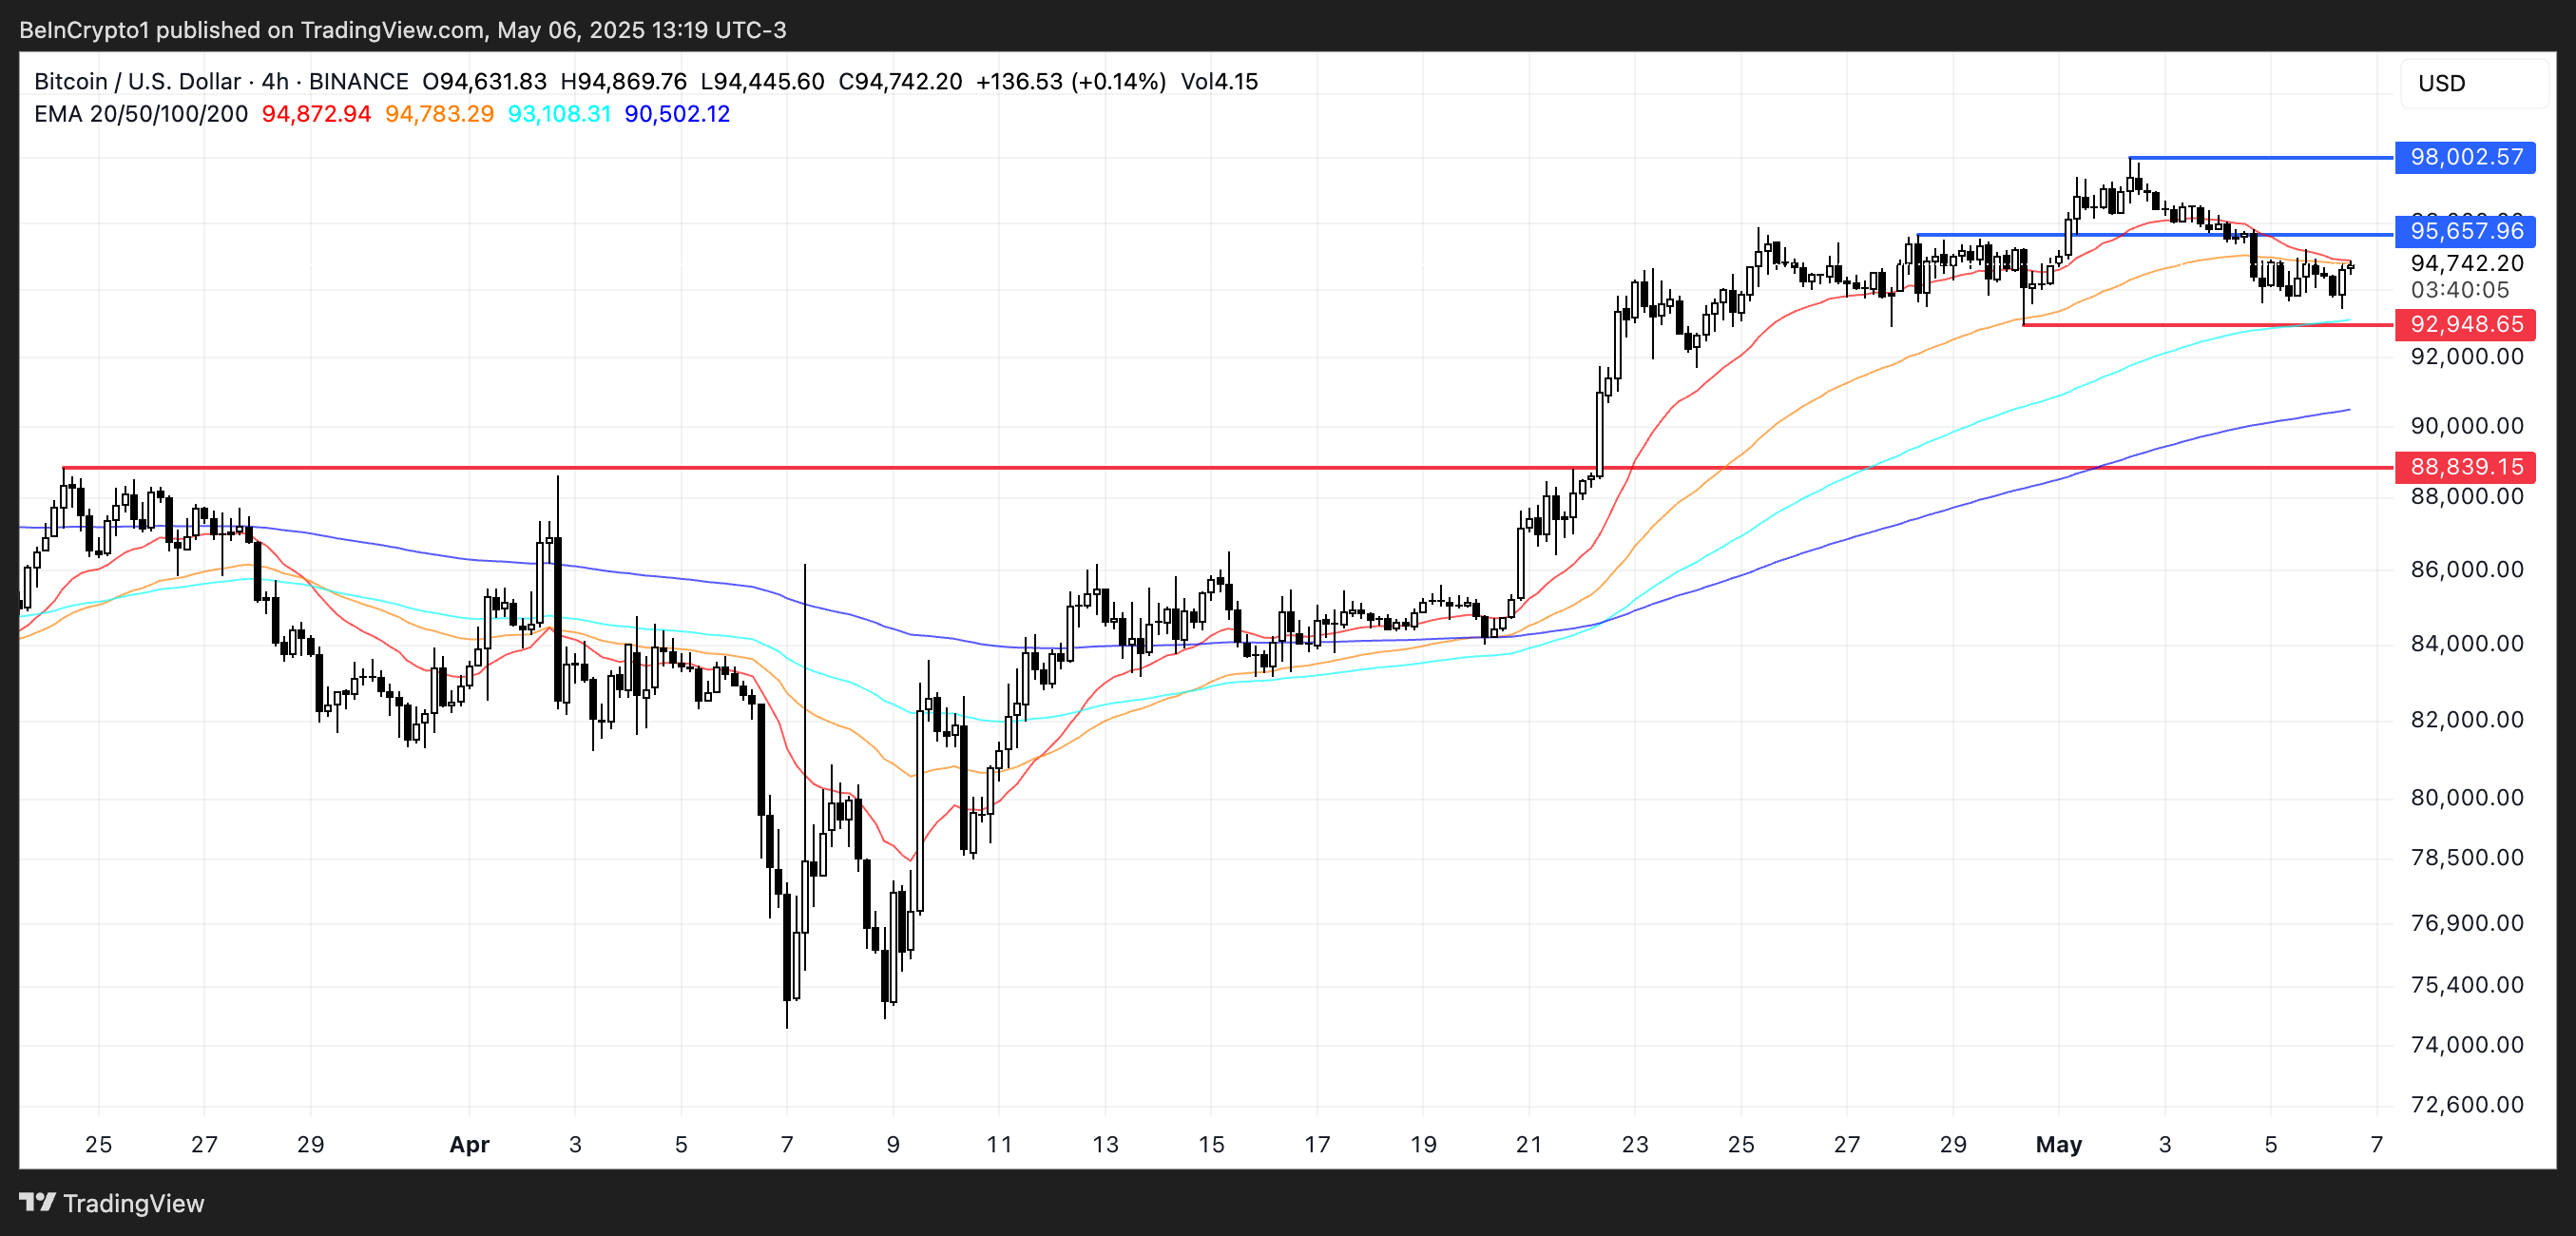
Bitcoin Holds Key Support as $100,000 Reclaim Hangs in the Balance
Bitcoin price has remained resilient above the $90,000 level since April 22, repeatedly holding support near $92,945 despite broader market uncertainty. The exponential moving averages (EMAs) still reflect a bullish structure, with short-term averages positioned above long-term ones.
However, there are early signs of weakening momentum, as the short-term EMAs have begun to slope downward—an indication that buyers may be losing strength soon.
If BTC fails to hold its key support, a drop toward $88,839 could follow, breaking the structure that has held for over two weeks.
Still, some analysts remain confident. Nick Purin, founder of The Coin Bureau, believes Bitcoin is well-positioned to reclaim the $100,000 mark, even as markets brace for volatility surrounding the upcoming FOMC meeting:
“It will be a volatile week. Firstly, we have the FOMC meeting tomorrow. While it’s pretty clear there will be no rate cuts, it’s what Chair Powell says that could move the markets. On top of that, trading volume is low and the long/short ratio is sitting at 50/50, which means that, yet again, BTC can swing in either direction from here. The good news is that there’s a great deal of buying interest around the $90,000-$93,000 range, so a dip to those levels is nothing to be concerned about – it will likely bounce back. And overall, the BTC/USD chart is looking strong as it continues to print higher lows.” – Purin told BeInCrypto.
Nick states how Fed next decisions could influence the market in the next months:
“If the Fed surprises with some dovish tones as well as guidance for rate cuts in June, there’s room for Bitcoin to rally all the way back up to that $100,000 level, which remains a liquidity magnet. But even if Powell strikes a hawkish tone, the impact on BTC will likely be minimal. There’s simply too much positive momentum – spot BTC ETFs are hoovering up assets, corporates are building up BTC treasuries and the correlation between Bitcoin and stocks is breaking down. On top of this, historic data shows that BTC has posted gains during nine out of the last 12 Mays. So, despite the likelihood of heightened volatility, the near future is looking promising. As such, following the old adage of ‘sell in May’ would be madness at this point.” – Purin told BeInCrypto.
A recovery in momentum could first drive BTC to retest resistance at $95,657, with a breakout potentially leading to $98,002 and eventually a challenge of the psychological $100,000 level.
With macro headwinds and technical crossroads converging this week, the next move will likely hinge on how BTC responds to its support zone and how broader market sentiment reacts to Fed commentary.