Solana (SOL) price dipped 2.4% to $176.88 on Saturday, May 24, 2025, after briefly overtaking Binance Coin (BNB) as the 5th-ranked cryptocurrency on Friday. The move above $181 proved short-lived, as memecoin-driven volatility swept bearish headwinds toward SOL markets following a controversial dinner involving U.S. President Donald Trump. Can Solana price reclaim bullish momentum and target $210, or is a deeper correction looming? Solana Tumbles as Trump Memecoin Sparks Market Controversy Solana (SOL) rode a bullish wave to this week to hit news peaks above $185 on Friday, fueled by rising network activity and growing institutional demand. The SOL price breakout to $186 marked a new 60-day high, and lifted its market cap above the $95 billion mark, briefly surpassing Binance Coin (BNB) to securing 5th spot among top ranked crypto assets. Solana Price Action, May 24, 2025 | Source: Coingecko However, the euphoria faded after Trump’s memecoin dinner event… Read More at Coingape.com
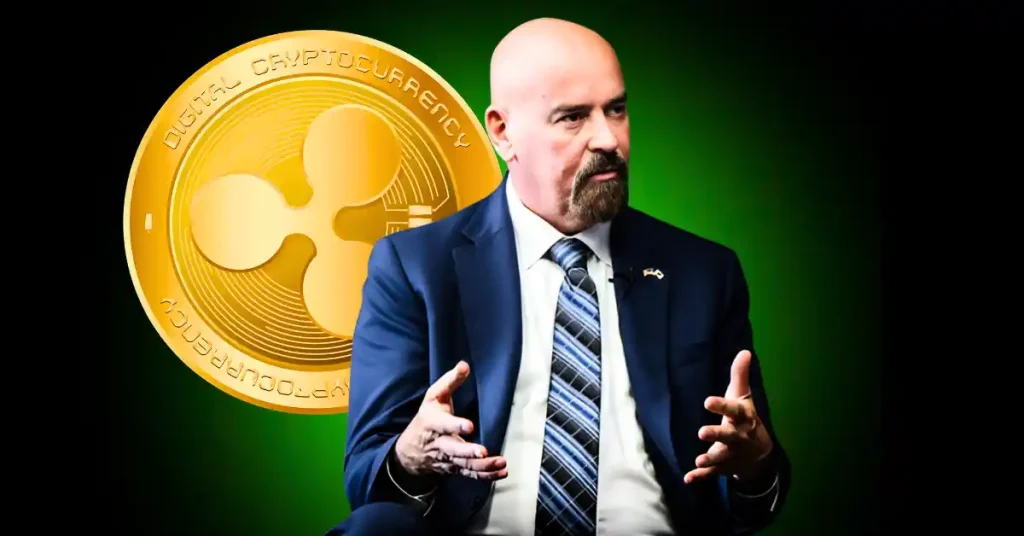
Years ago, when John E Deaton, a well-known crypto advocate and legal voice in the XRP community, predicted that exchange-traded funds (ETFs) and corporate crypto treasuries would expand beyond Bitcoin, many laughed! But today, those predictions are becoming reality—and fast.
Now, again, Deaton says that Wall Street’s greed could make XRP, ETH, and SOL the next big treasury assets.
Deaton’s “Greed Theory” Playing Out
Deaton had one simple theory: Wall Street is too greedy to sit back and let only a few players profit from crypto. Earlier, Deaton said Wall Street would never let Michael Saylor be the only one using Bitcoin as a treasury strategy.
According to Deaton, there are now between 60 and 100 companies that have implemented a Bitcoin treasury strategy.
He believed the same would happen with other tokens too, once Bitcoin’s treasury strategy worked, others wanted in — and not just with Bitcoin. Meanwhile, companies are now adding ETH, XRP, and SOL to their corporate balance sheets to gain an edge.
VivoPower International has raised $121 million for a $100 million XRP treasury plan, with strong backing from Saudi investors and advice from a former SBI Ripple Asia executive.
Worksport Ltd., an American car parts company, set aside $5 million — or 10% of its spare cash — for XRP and Bitcoin.
Hyperscale Data Inc. plans to launch an XRP lending platform by late 2025, listing XRP directly on its accounts.
Webus International Limited, a Chinese company, partnered with Samara Alpha Management to manage a $300 million XRP treasury for cross-border payments.
Wellgistics Health, Inc. uses XRP in its treasury to speed up payments in healthcare and avoid banking delays.
It’s Not Just XRP — ETH and SOL Too
Deaton pointed out that at least two companies now hold ETH as a treasury strategy, including Fundstrat and SharpLink Gaming, which has a $425 million ETH position supported by Consensys, Ethereum’s co-founder, Joseph Lubin’s company.
For Solana, the list is growing too:
Upexi raised $100 million for a Solana treasury.
DeFi Development Corp saw its shares surge 3,000% after announcing SOL purchases.
Sol Strategies has launched as a Solana treasury company, getting support from major firms like Cantor Fitzgerald.
An unnamed EdTech company also plans to raise $500 million to hold SOL.
Wall Street’s Hunger For Profit
Meanwhile, Deaton said that this wasn’t just about XRP, Ethereum, or Solana—it was about understanding human behavior, the hunger for returns, and the inevitability of crypto adoption in corporate finance.
As Deaton puts it, his predictions weren’t about specific cryptocurrencies, but about how people—and especially Wall Street—respond when they smell opportunity.
The post John Deaton Says Wall Street Greed Could Push XRP, ETH & SOL Into Treasuries appeared first on Coinpedia Fintech News
Years ago, when John E Deaton, a well-known crypto advocate and legal voice in the XRP community, predicted that exchange-traded funds (ETFs) and corporate crypto treasuries would expand beyond Bitcoin, many laughed! But today, those predictions are becoming reality—and fast. Now, again, Deaton says that Wall Street’s greed could make XRP, ETH, and SOL the …
Bitcoin (BTC) is down 6% over the past eight days after reaching new all-time highs, and recent technical signals suggest growing uncertainty in the market. Whale activity, which briefly declined, has started to recover, hinting that some large holders may be returning to accumulation.
However, bearish indicators are mounting, with the Ichimoku Cloud showing weakness and BTC trading below key support levels. As price hovers just above $104,584, the threat of another death cross and deeper downside remains unless bulls can reclaim momentum above resistance.
Bitcoin Whale Count Rebounds After Strong Decline
The number of Bitcoin whales—addresses holding between 1,000 and 10,000 BTC—has rebounded slightly to 2,006 after falling to 2,002 earlier this week.
This brief dip followed a sharper decline from 2,021 on May 25, marking a notable short-term reduction in large holders. However, the recovery suggests that some whales may be returning to accumulation.
While the fluctuation was small, such changes are closely monitored, as they often precede shifts in market sentiment or price action.
Monitoring whale behavior is essential due to their outsized influence on Bitcoin’s liquidity and volatility. A decline in whale count can indicate profit-taking or distribution, often signaling caution or a potential market cooldown.
Conversely, a stabilization or rise—like the one observed now—can ease investor concerns and support price resilience at elevated levels.
The number of large holders recovering after a sharp drop may signal renewed confidence among key players, reducing the immediate risk of heavy selling pressure and helping Bitcoin maintain its current range.
Technical Indicators Turn Bearish as BTC Struggles Below Key Levels
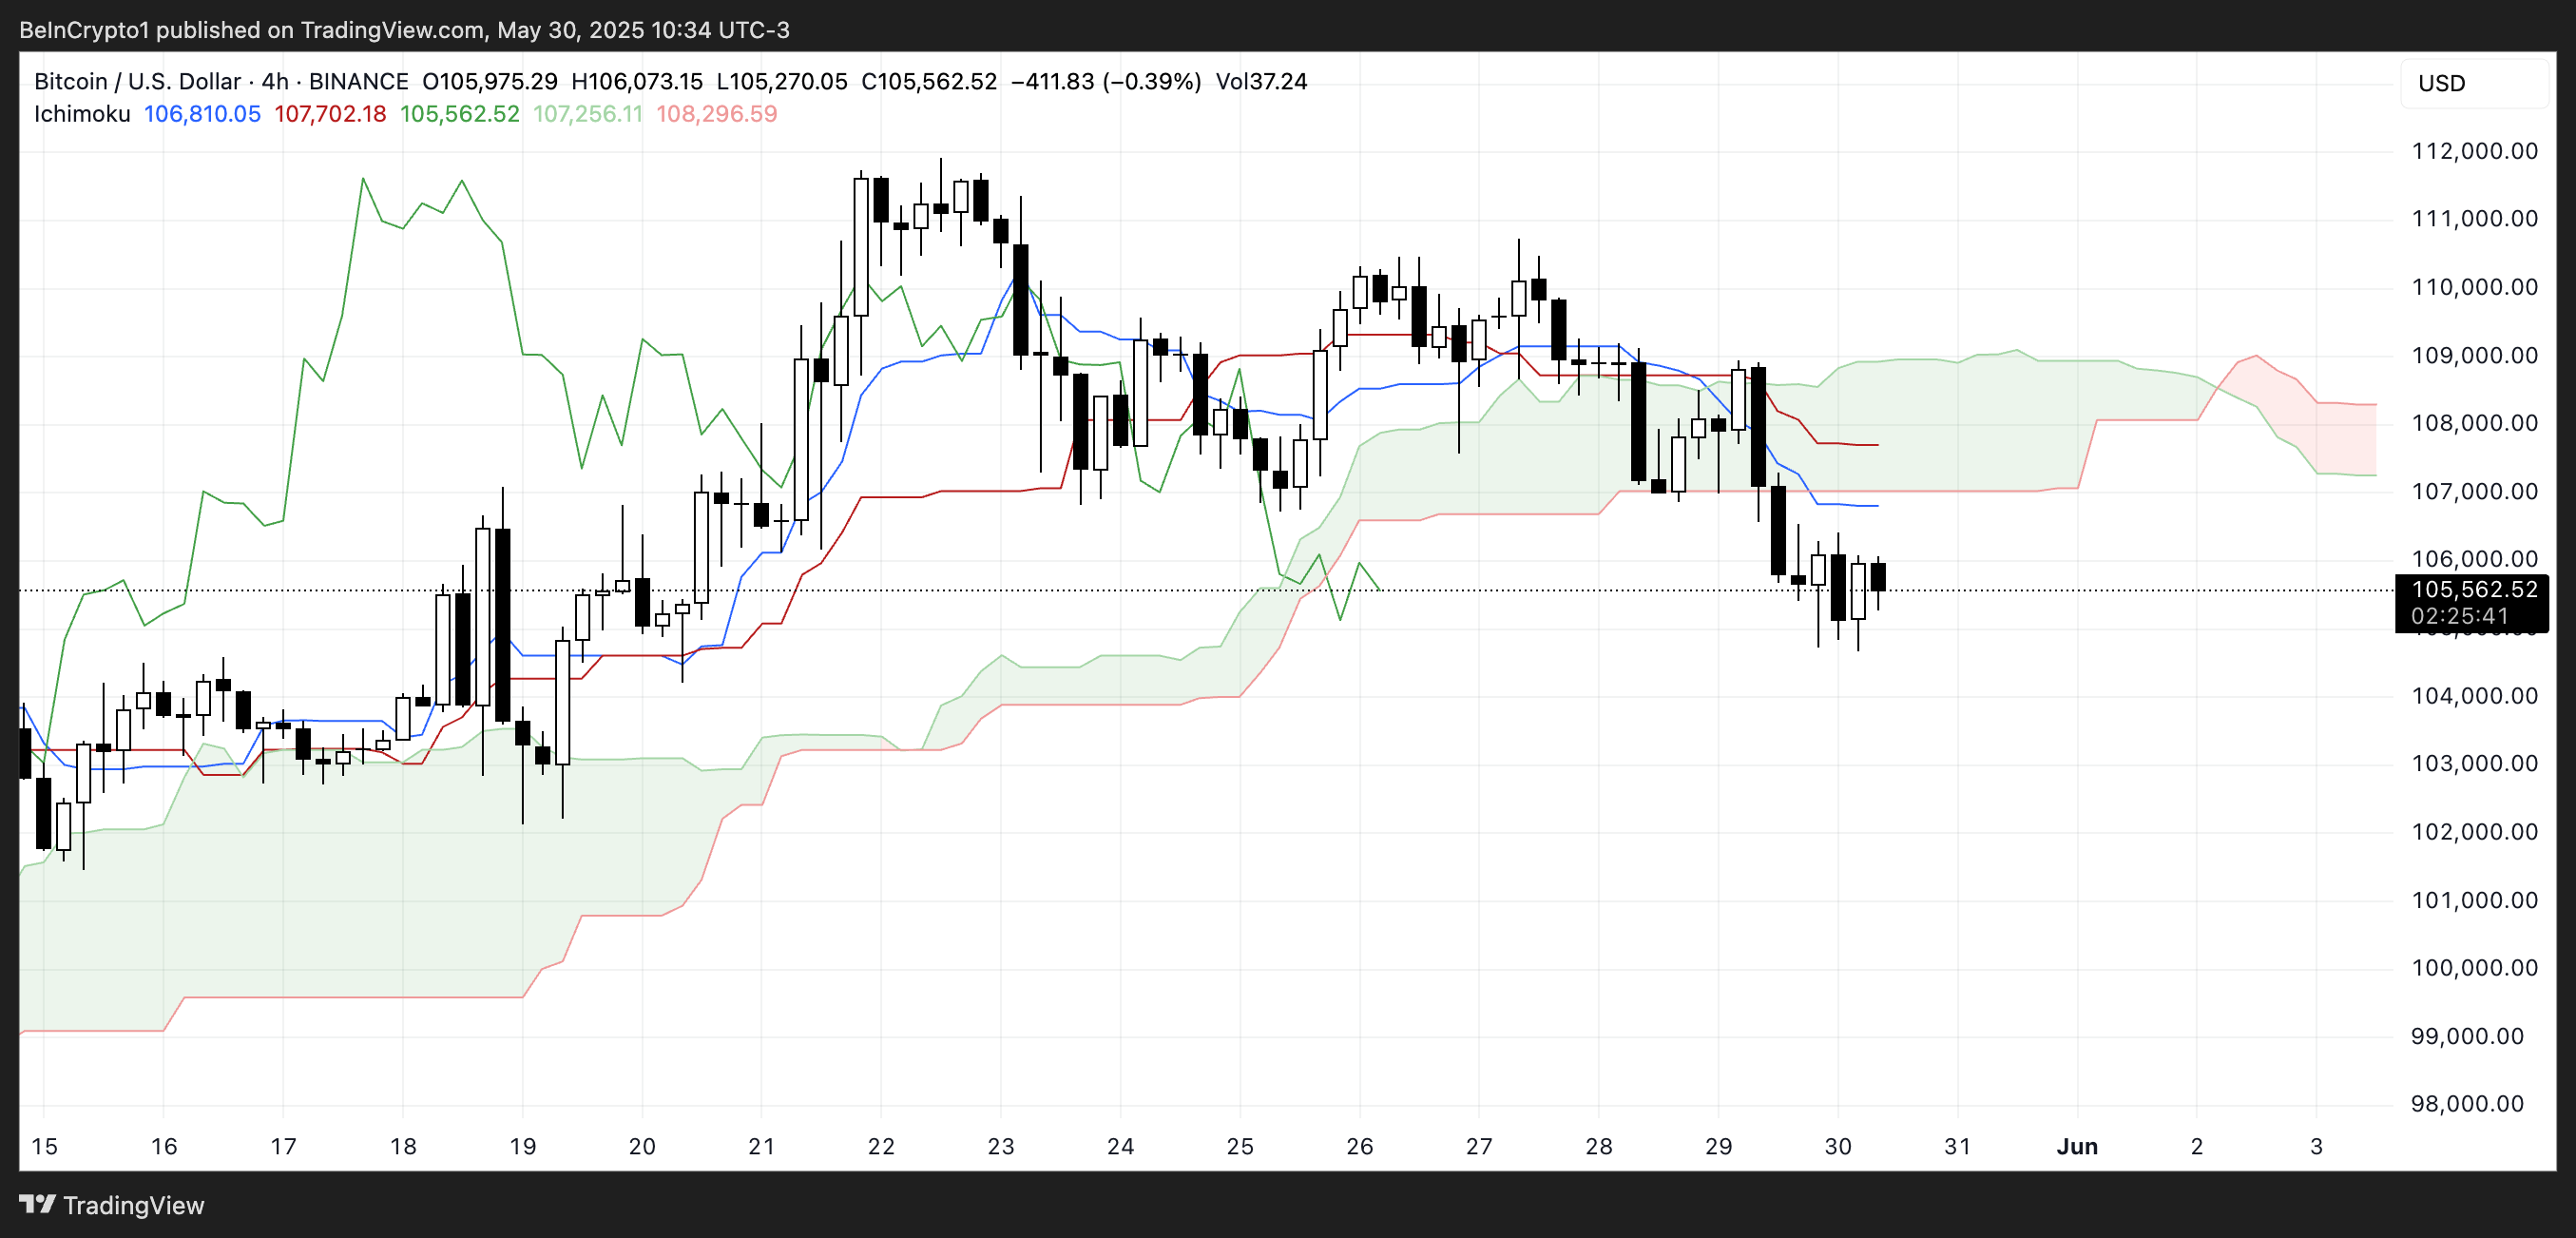
The Ichimoku Cloud chart for Bitcoin shows a short-term bearish structure.
Price action is currently positioned below the Kumo (cloud), which is shaded in green and red—indicating that Bitcoin is trading in a zone of weakness relative to historical and projected momentum.
The cloud ahead is red, suggesting that the trend bias for the near future remains bearish unless a reversal breaks through the upper boundary.
The Tenkan-sen (blue line) is below the Kijun-sen (red line), confirming short-term downward momentum. Both lines are angled downward, another bearish signal.
The Chikou Span (green lagging line) is below both price and the cloud, reinforcing that current momentum lacks bullish confirmation.
The future cloud also narrows, which may hint at a potential equilibrium or a consolidation zone ahead. For now, the Ichimoku components align with a bearish outlook. A bullish shift would require the price to break above the cloud and flip the future Kumo from red to green.
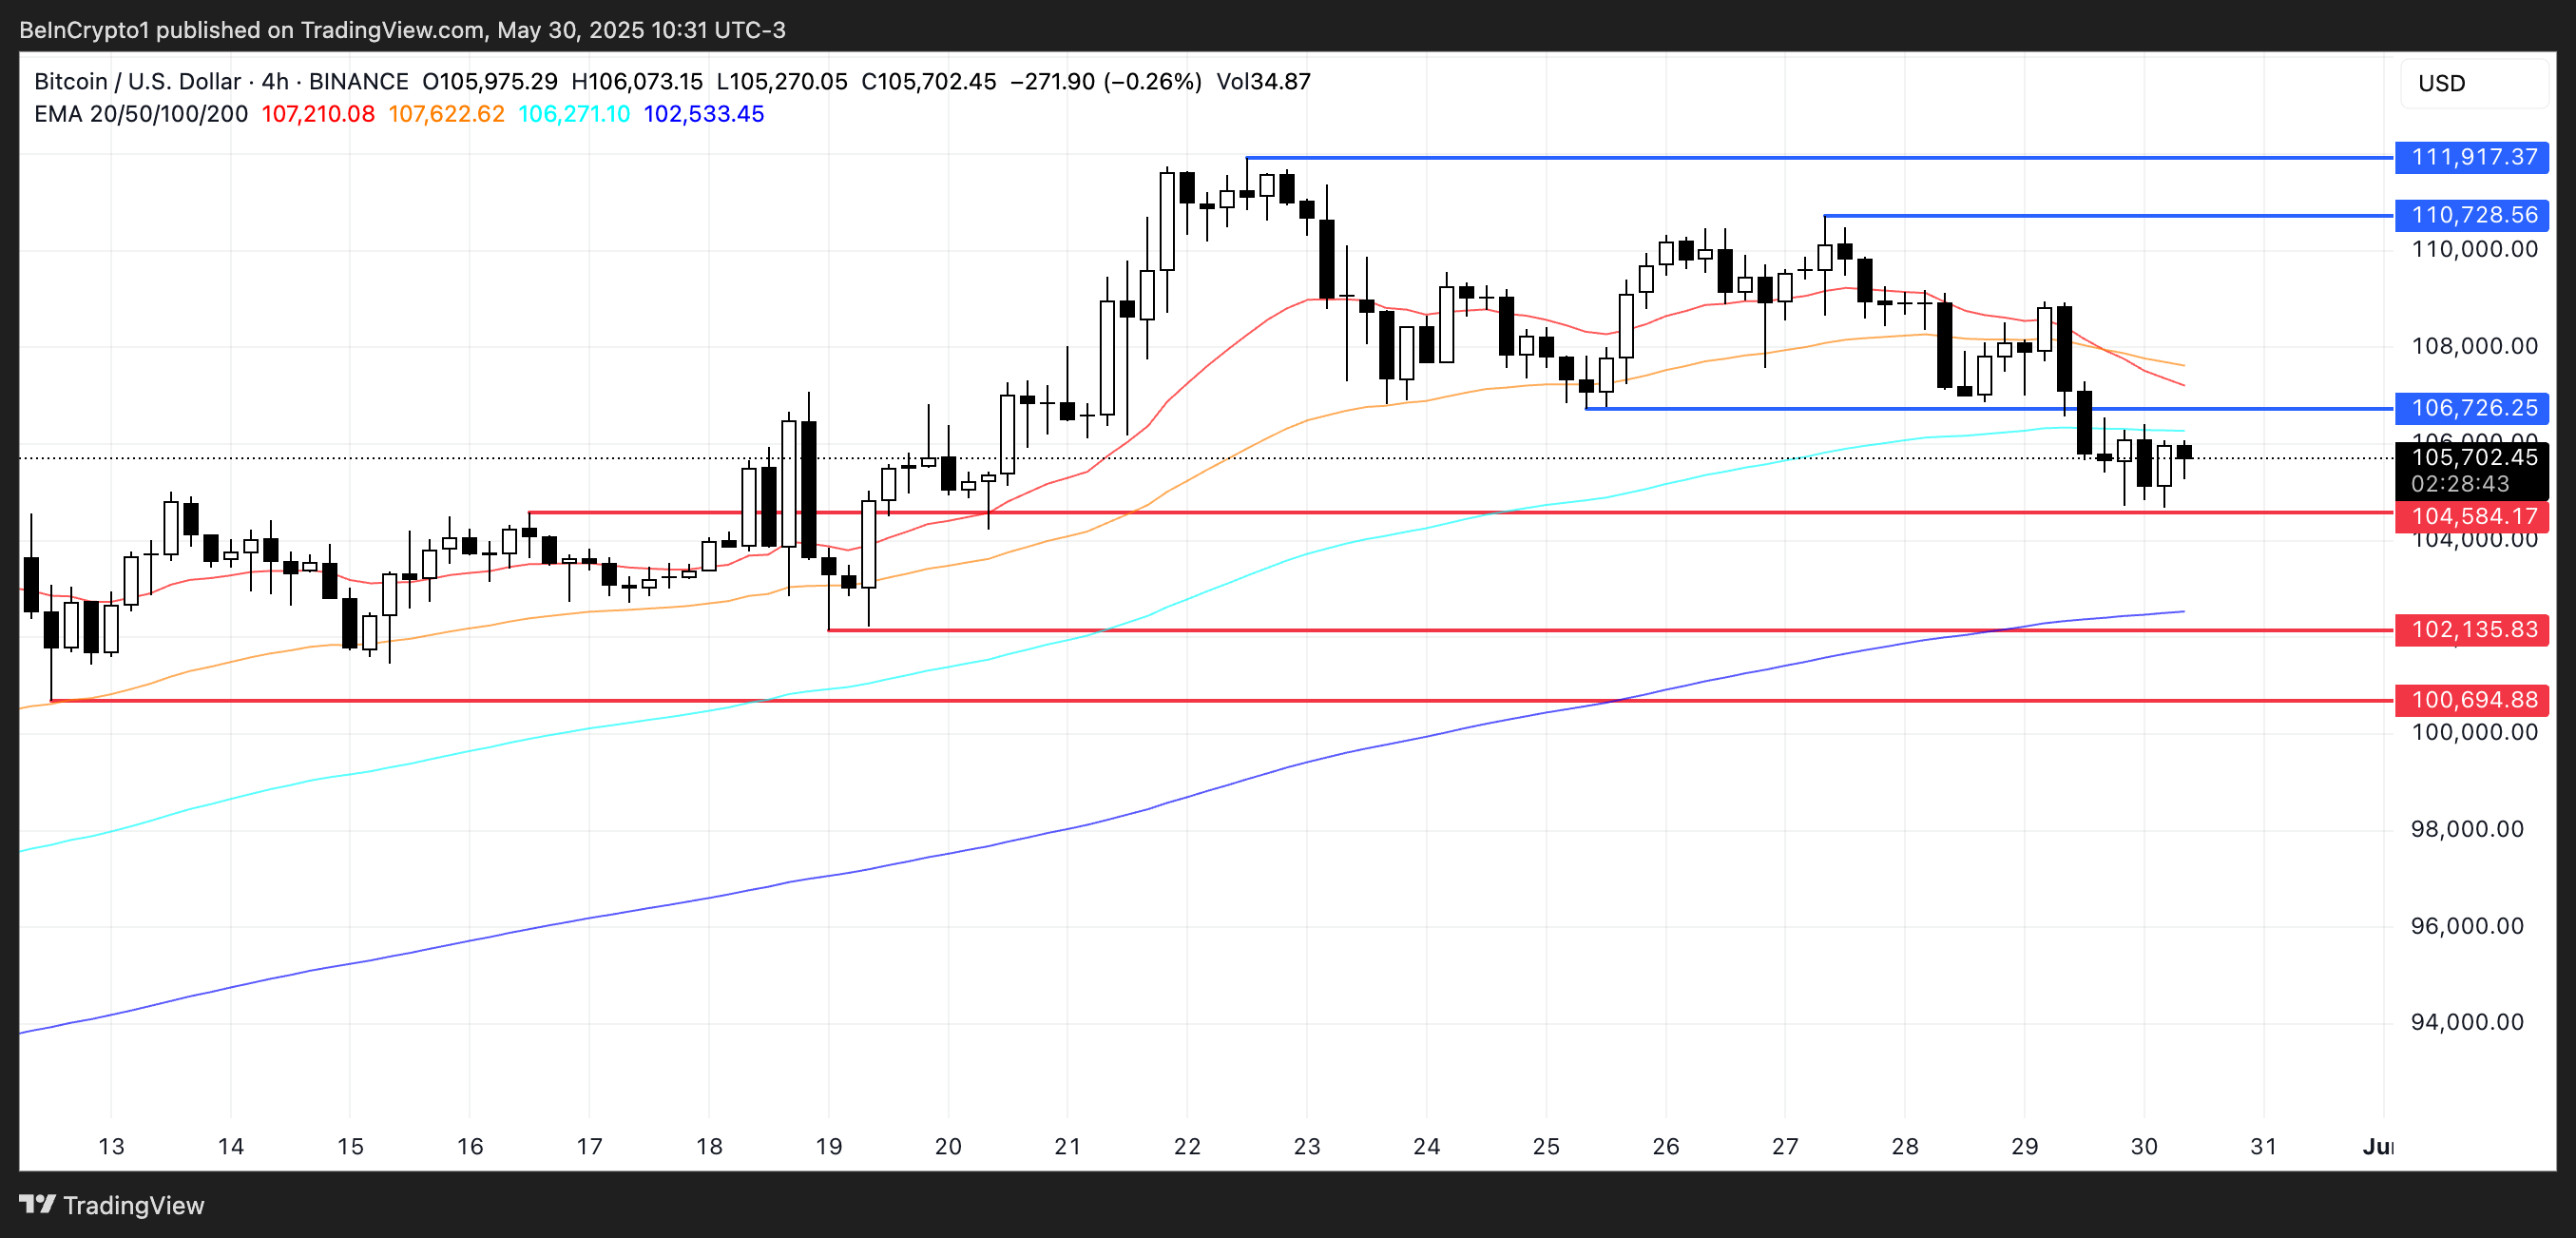
Bitcoin Faces Potential Death Cross
Bitcoin price recently formed a death cross, and technical indicators suggest another one could be on the horizon. Price is currently trading just above critical support at $104,584, which has acted as a short-term floor.
If this support fails, the next downside targets sit at $102,135 and potentially as low as $100,694 if the selling pressure intensifies.
The presence of back-to-back death crosses, combined with weakening price action near these levels, raises the probability of a deeper correction in the short term.
On the bullish side, if Bitcoin can mount a recovery and establish strong momentum, it may retest resistance at $106,726.
A break above this level could trigger a sharper move toward $110,728, with a further upside possibility of reaching $112,000 if the rally accelerates.
Ethereum’s long‑awaited Pectra upgrade is live, activating 11 Ethereum Improvement Proposals on the mainnet.
The network crossed the upgrade slot at 10:05 UTC and reached finality roughly 12 minutes later, clearing the last hurdle after two turbulent testnet runs.
Ethereum’s Pectra Hard Fork Goes Live: What You Need to Know
The headline change, EIP‑7251, raises each validator’s effective balance from 32 ETH to 2,048 ETH, letting large staking providers consolidate thousands of nodes and slash bandwidth costs.
Pectra has gone live and finalized ! Testing of the newly activated EIPs continues.
Pectra Upgrade also debuts EIP‑7702, allowing externally owned accounts to temporarily execute smart‑contract code. The feature unlocks gas‑fee payments in stablecoins, subscription‑style transfers, and native wallet‑recovery tools. Nine additional EIPs target data availability, validator onboarding, and cryptographic efficiency.
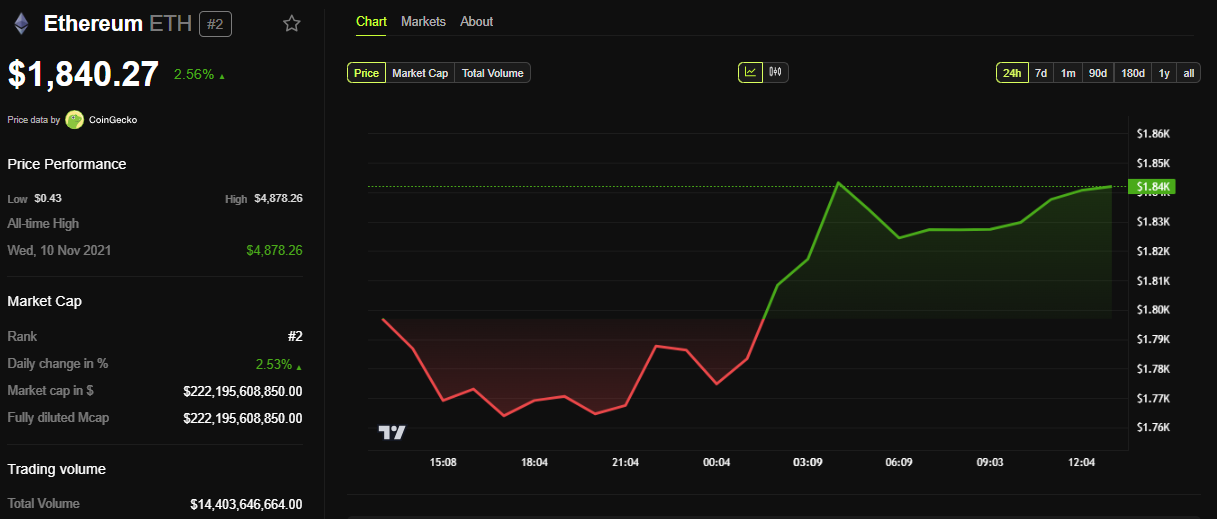
At press time, ETH trades around $1,840, up almost 3% over the last 24 hours, as markets digest the upgrade while bracing for today’s FOMC rate decision.
Core developers will now pivot to the next hard fork, “Fusaka,” slated for late 2025, but today’s smooth rollout cements Ethereum’s momentum after three years of incremental tweaks.
BeInCrypto contacted Bitfinex analysts for insight on the Pectra Upgrade. In their opinion, Pectra brings both opportunities and challenges for Ethereum Layer 2s.
While it boosts efficiency and lowers costs, it may also concentrate validator power and reduce Layer 2 fee revenues.
According to the analysts, this shift could impact decentralization and incentives, pushing Layer 2s to adapt through innovation and user-focused design.
“Ultimately, the Pectra upgrade represents a double-edged sword for Ethereum’s Layer 2s,” Bitfinex analysts told BeInCrypto.
Others like Nicolai Sondergaard, Research Analyst at Nansen, offer a more measured outlook. Speaking to BeInCrypto, Sondergaard said Pectra enhances Ethereum’s Layer-2 ecosystem by doubling blob capacity and raising calldata costs.
According to Sondergaard, this makes blobs the standard for rollup data, with lower fees and smoother UX on dApps.
He said DeFi and NFTs benefit from smarter wallets, gas sponsorship, and cheaper transactions, while onboarding and voting in DAOs and social apps become easier.
“Gasless voting or simplified onboarding becomes more practical with the new wallet capabilities. Meanwhile, the upgrade doesn’t introduce backward-incompatible changes, meaning existing contracts continue functioning as-is,” Sondergaard concluded.
Meanwhile, while the technical changes are mostly invisible to users, major exchanges like Binance and Coinbase implemented temporary service pauses as a precaution.
Binance and Coinbase Halt Key Services
Binance exchange said deposits and withdrawals of 14 tokens would not be available starting Wednesday at 09:45 (UTC).
“Starting at approximately 2025-05-07 09:45 (UTC), Binance will suspend the deposits and withdrawals of token(s)…to support the Ethereum network upgrade and hard fork to ensure the best user experience,” read the announcement.
With this news, the following tokens will not be available for depositing and withdrawing on Binance. Services will resume once the tokens are deemed stable and the volatility inspired by the Pectra Upgrade has eased.
Ethereum (ETH)
Polygon (POL)
Arbitrum (ARB)
Metis (METIS)
Optimism (OP)
Scroll (SCR)
zkSync Era (ZKSYNC)
Cyber (CYBER)
Base (BASE)
Metal DAO (MTL)
Manta Network (MANTA)
Celo (CELO)
Starknet (STRK)
Worldcoin (WLD)
Binance suspends deposits and withdrawals for 14 tokens. Source: Binance announcement
This suspension comes as the exchange looks to support the Ethereum network upgrade and hard fork, ensuring the best user experience.
Notably, while Binance halts deposit and withdrawal functions for these tokens, trading on their networks will remain operational.
Coinbase also announced a similar move, pausing some operations to ensure a smooth and secure transition.
“To ensure user fund safety, we will temporarily pause Ethereum deposits and withdrawals from 2:50 AM to 3:45 AM PT,” Coinbase stated in a post.
However, the initiation of new staking requests on the Coinbase exchange will be delayed during that time. Normalcy will resume after 3:45 AM PT without affecting existing staked positions.


 ! Testing of the newly activated EIPs continues.