Solana Labs co-founder Anatoly Yakovenko has addressed the controversy surrounding the blockchain network’s recently deleted ad. The advertisement, which aimed to promote the upcoming Solana Accelerate conference, faced harsh criticism for its portrayal of gender issues.
The ad, now taken down, sparked backlash from the community, especially for its tone-deaf approach to gender identity. The Solana team has since been forced to manage the aftermath, with investors and users questioning the impact on the project’s public image.
Solana Labs Co-Founder Responds to Backlash
Solana Labs co-founder Anatoly Yakovenko has responded to the backlash in a post on X. He said he was sorry for the lack of sensitivity that was used in the advert and for not considering how such a piece can hurt minority groups. “The ad was bad, and it’s still gnawing at my soul,” Yakovenko said, following the mistake which had been made. He also confessed that at first, he had minimized the situation and did not speak out about it as it deserved to be.
Yakovenko went on to also express gratitude to the developers and artists in the Solana ecosystem who openly seceded the ad; some did it publicly while others privately. He effectively also appericated their collaboration in pointing out such content.
Nonetheless, Yakovenko sought to cool down the tensions, stating that Solana Labs would keep true to its objectives: decentralization and open-source software. He noted that the Solana Foundation would not interfere with culture wars and would stick to the principles on which Solana was established.
Marketing Missteps and Community Reaction
This ad was widely regarded as provocative as it presented a character called “America” speaking about ideas of invention during a therapy session. Instead of giving him theories about technological development, the therapist advised him to stick to matters like gender and pronoun.
In the end, the ad concluded with the character stating that he was going to ‘invent technologies not genders. The depiction was also considered by many as being sexist and an awkward response to the present culture and political correctness.
The response was immediate, with many people in the crypto-sphere expressing their disgust on social networks. Some of the critics felt that the ad was vulgar and insensitive towards some of the vices in the society towards Solana. Subsequently, the company removed the video, however, by that time the video had received millions of viewers and thousands of comments. Some questioned the Solana marketing team for not thinking past such a message, especially during the current political climate of gender issues.
Solana Price Trends Amid the Controversy
Following the controversy, many investors have been closely monitoring the impact on Solana’s market performance. While Solana remains one of the largest blockchain networks, the incident has raised concerns over potential consequences for SOL’s price. As of March 19, Glassnode’s URPD (Unrealized Realized Price Distribution) chart suggests key support and resistance levels that could be affected by this negative publicity.
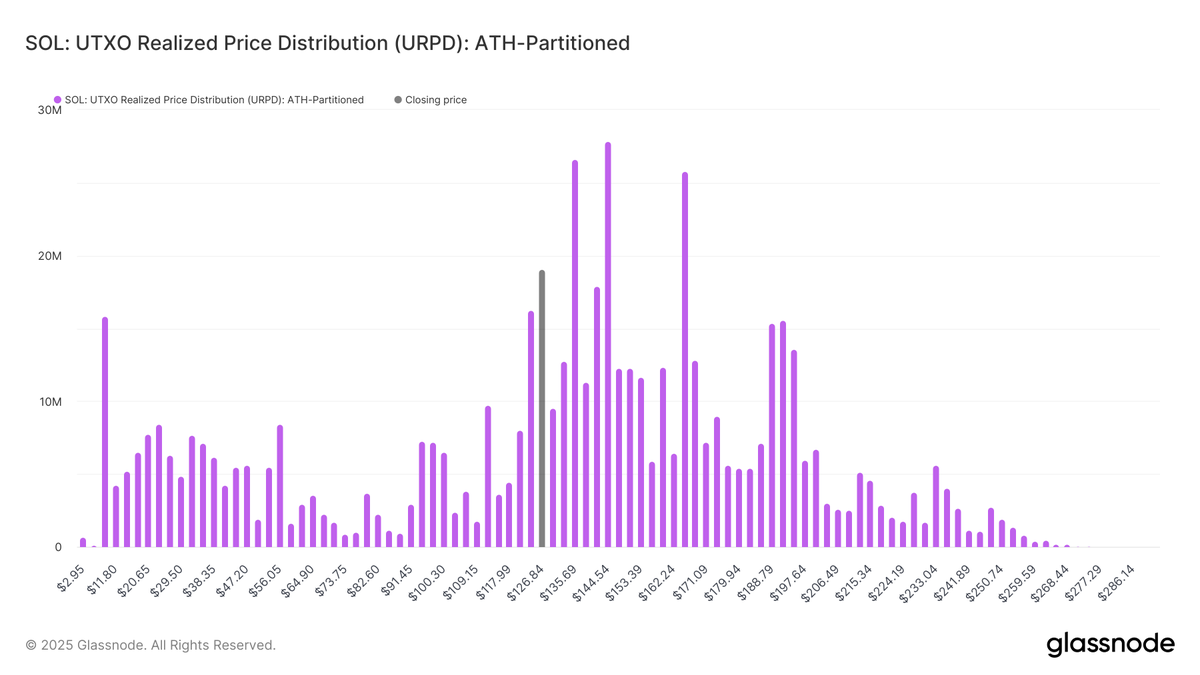
The first strong support level is $112.10 according to Glassnode where 9.7 million SOL (approximately 1.67% of the total) is stored. This level proves important, in the light of the fact long-term investors might be willing to support the stock after acquiring stakes hence this presents a cost base. On this context, the $94, $97, and $100 levels support around 21 million SOL which is 3.5% of the total supply and breakdown of any of these levels may lead to bearish pressure.
On the upside, there is resistance around $135, where 26.6 million SOL is concentrated, and particularly at $144, where 27 million SOL (nearly 5% of supply) is held. These levels could provide significant selling pressure, as many investors who bought at or near these levels may look to exit at break-even, adding additional selling pressure on the price.
The metrics used to measure outcomes can be misleading when evaluating blockchain performance. As more blockchain networks emerge, the public needs clear, efficiency-focused metrics, rather than exaggerated claims, to differentiate between them.
In a conversation with BeInCrypto, Taraxa Co-Founder Steven Pu explained that it’s becoming increasingly difficult to compare blockchain performance accurately because many reported metrics rely on overly optimistic assumptions rather than evidence-based results. To combat this wave of misrepresentation, Pu proposes a new metric, which he calls TPS/$.
Why Does the Industry Lack Reliable Benchmarks?
The need for clear differentiation is growing with the increasing number of Layer-1 blockchain networks. As various developers promote the speed and efficiency of their blockchains, relying on metrics that distinguish their performance becomes indispensable.
However, the industry still lacks reliable benchmarks for real-world efficiency, instead relying on sporadic sentimental waves of hype-driven popularity. According to Pu, misleading performance figures currently saturate the market, obscuring true capabilities.
“It’s easy for opportunists to take advantage by driving up over-simplified and exaggerated narratives to profit themselves. Every single conceivable technical concept and metric has at one time or another been used to hype up many projects that don’t really deserve them: TPS, finality latency, modularity, network node count, execution speed, parallelization, bandwidth utilization, EVM-compatibility, EVM-incompatibility, etc.,” Pu told BeInCrypto.
Pu focused on how some projects exploit TPS metrics, using them as marketing tactics to make blockchain performance sound more appealing than it might be under real-world conditions.
Examining the Misleading Nature of TPS
Transactions per second, more commonly known as TPS, is a metric that refers to the average or sustained number of transactions that a blockchain network can process and finalize per second under normal operating conditions.
However, it often misleadingly hypes projects, offering a skewed view of overall performance.
“Decentralized networks are complex systems that need to be considered as a whole, and in the context of their use cases. But the market has this horrible habit of over-simplifying and over-selling one specific metric or aspect of a project, while ignoring the whole. Perhaps a highly centralized, high-TPS network does have its uses in the right scenarios with specific trust models, but the market really has no appetite for such nuanced descriptions,” Pu explained.
Pu indicates that blockchain projects with extreme claims on single metrics like TPS may have compromised decentralization, security, and accuracy.
“Take TPS, for example. This one metric masks numerous other aspects of the network, for example, how was the TPS achieved? What was sacrificed in the process? If I have 1 node, running a WASM JIT VM, call that a network, that gets you a few hundred thousand TPS right off the bat. I then make 1000 copies of that machine and call it sharding, now you start to get into the hundreds of millions of ‘TPS’. Add in unrealistic assumptions such as non-conflict, and you assume you can parallelize all transactions, then you can get “TPS” into the billions. It’s not that TPS is a bad metric, you just can’t look at any metric in isolation because there’s so much hidden information behind the numbers,” he added.
The Taraxa Co-founder revealed the extent of these inflated metrics in a recent report.
The Significant Discrepancy Between Theoretical and Real-World TPS
Pu sought to prove his point by determining the difference between the maximum historical TPS realized on a blockchain’s mainnet and the maximum theoretical TPS.
Of the 22 permissionless and single-shard networks observed, Pu found that, on average, there was a 20-fold gap between theory and reality. In other words, the theoretical metric was 20 times higher than the maximum observed mainnet TPS.
Taraxa Co-founder finds 20x difference between the Theoretical TPS and the Max Observed Mainnet TPS. Source: Taraxa.
“Metric overestimations (such as in the case of TPS) are a response to the highly speculative and narrative-driven crypto market. Everyone wants to position their project and technologies in the best possible light, so they come up with theoretical estimates, or conduct tests with wildly unrealistic assumptions, to arrive at inflated metrics. It’s dishonest advertising. Nothing more, nothing less,” Pu told BeInCrypto.
Looking to counter these exaggerated metrics, Pu developed his own performance measure.
Introducing TPS/$: A More Balanced Metric?
Pu and his team developed the following: TPS realized on mainnet / monthly $ cost of a single validator node, or TPS/$ for short, to fulfill the need for better performance metrics.
This metric assesses performance based on verifiable TPS achieved on a network’s live mainnet while also considering hardware efficiency.
The significant 20-fold gap between theoretical and actual throughput convinced Pu to exclude metrics based solely on assumptions or lab conditions. He also aimed to illustrate how some blockchain projects inflate performance metrics by relying on costly infrastructure.
“Published network performance claims are often inflated by extremely expensive hardware. This is especially true for networks with highly centralized consensus mechanisms, where the throughput bottleneck shifts away from networking latency and into single-machine hardware performance. Requiring extremely expensive hardware for validators not only betrays a centralized consensus algorithm and inefficient engineering, it also prevents the vast majority of the world from potentially participating in consensus by pricing them out,” Pu explained.
Pu’s team located each network’s minimum validator hardware requirements to determine the cost per validator node. They later estimated their monthly cost, paying particular attention to their relative sizing when used to compute the TPS per dollar ratios.
“So the TPS/$ metric tries to correct two of the perhaps most egregious categories of misinformation, by forcing the TPS performance to be on mainnet, and revealing the inherent tradeoffs of extremely expensive hardware,” Pu added.
Pu stressed considering two simple, identifiable characteristics: whether a network is permissionless and single-sharded.
Permissioned vs. Permissionless Networks: Which Fosters Decentralization?
A blockchain’s degree of security can be unveiled by whether it operates under a permissioned or permissionless network.
Permissioned blockchains refer to closed networks where access and participation are restricted to a predefined group of users, requiring permission from a central authority or trusted group to join. In permissionless blockchains, anyone is allowed to participate.
According to Pu, the former model is at odds with the philosophy of decentralization.
“A permissioned network, where network validation membership is controlled by a single entity, or if there is just a single entity (every Layer-2s), is another excellent metric. This tells you whether or not the network is indeed decentralized. A hallmark of decentralization is its ability to bridge trust gaps. Take decentralization away, then the network is nothing more than a cloud service,” Pu told BeInCrypto.
Attention to these metrics will prove vital over time, as networks with centralized authorities tend to be more vulnerable to certain weaknesses.
“In the long term, what we really need is a battery of standardized attack vectors for L1 infrastructure that can help to reveal weaknesses and tradeoffs for any given architectural design. Much of the problems in today’s mainstream L1 are that they make unreasonable sacrifices in security and decentralization. These characteristics are invisible and extremely hard to observe, until a disaster strikes. My hope is that as the industry matures, such a battery of tests will begin to organically emerge into an industry-wide standard,” Pu added.
Meanwhile, understanding whether a network employs state-sharding versus maintaining a single, sharded state reveals how unified its data management is.
State-Sharding vs. Single-State: Understanding Data Unity
In blockchain performance, latency refers to the time delay between submitting a transaction to the network, confirming it, and including it in a block on the blockchain. It measures how long it takes for a transaction to be processed and become a permanent part of the distributed ledger.
Identifying whether a network employs state-sharding or a single-sharded state can reveal much about its latency efficiency.
State-sharded networks divide the blockchain’s data into multiple independent parts called shards. Each shard operates somewhat independently and doesn’t have direct, real-time access to the complete state of the entire network.
By contrast, a non-state-sharded network has a single, shared state across the entire network. All nodes can access and process the same complete data set in this case.
Pu noted that state-sharded networks aim to increase storage and transaction capacity. However, they often face longer finality latencies due to a need to process transactions across multiple independent shards.
He added that many projects adopting a sharding approach inflate throughput by simply replicating their network rather than building a truly integrated and scalable architecture.
“A state-sharded network that doesn’t share state, is simply making unconnected copies of a network. If I take a L1 network and just make 1000 copies of it running independently, it’s clearly dishonest to claim that I can add up all the throughput across the copies together and represent it as a single network. There are architectures that actually synchronize the states as well as shuffle the validators across shards, but more often than not, projects making outlandish claims on throughput are just making independent copies,” Pu said.
Based on his research into the efficiency of blockchain metrics, Pu highlighted the need for fundamental shifts in how projects are evaluated, funded, and ultimately succeed.
What Fundamental Shifts Does Blockchain Evaluation Need?
Pu’s insights present a notable alternative in a Layer-1 blockchain space where misleading performance metrics increasingly compete for attention. Reliable and effective benchmarks are essential to counter these false representations.
“You only know what you can measure, and right now in crypto, the numbers look more like hype-narratives than objective measurements. Having standardized, transparent measurements allows simple comparisons across product options so developers and users understand what it is they’re using, and what tradeoffs they’re making. This is a hallmark of any mature industry, and we still have a long way to go in crypto,” Pu concluded.
Adopting standardized and transparent benchmarks will foster informed decision-making and drive genuine progress beyond merely promotional claims as the industry matures.
Bitcoin price consolidated around the $85,000 support level on Friday, April 18, despite escalating sell-offs in the broader US stock market. On-chain divergence data highlights a sharp investor pivot toward Bitcoin since Trump’s “Liberation Day” tariff announcement on April 2.
After a volatile start to the month, Bitcoin (BTC) has shown resilience this week. Despite sharp swings in global financial markets, as the US-China trade war escalates, BTC has managed to hold firmly above the $80,000 level.
Bitcoin price performance, April 18 2025 | Source: Coingecko
According to CoinGecko data at press time, Bitcoin trades at $84,500, indicating a return to calm and stability. The recent price action suggests that weaker holders have exited the market, allowing long-term investors to retake control and solidify BTC’s floor
Bitcoin has outperformed the S&P 500 Since Liberation Day Tariffs
Beyond retail market reactions, broader macro trends show Bitcoin has decisively outperformed traditional equities in the two weeks since Trump’s latest trade war initiative. Following Nvidia’s $
Bitcoin price vs. S&P 500 data | Source: Santiment
5.5 billion tariff-linked charge, US tech stocks took a steep hit, while BTC remained largely unmoved.
Santiment data reveals that the BTC vs. S&P 500 divergence coefficient dropped from 0.16% on April 2 to 0.083% by April 18—marking a 48.1% outperformance by Bitcoin in just two weeks. This metric reflects increasing capital rotation into BTC as investors seek shelter from tariff-induced equity market turbulence.
With strong US Jobless Claims data and rising political pressure for rate cuts, BTC’s bullish positioning may extend further, especially if macro conditions remain favorable for alternative assets like Bitcoin.
Bitcoin Price Analysis: BTC Poised for Breakout Toward $87,000?
Bitcoin is trading around $84,540, consolidating just below the midline of the Bollinger Bands on the daily chart.
After recovering from early April’s drop to $77,900, currently the lower Bollinger Band support, BTC price has gradually climbed with diminishing volatility. The upper Bollinger Band now caps resistance at $87,424, while the middle band, at $82,680, serves as a key pivot zone.
Bitcoin Price Analysis
Volume Delta remains neutral at 193, suggesting neither bulls nor bears hold dominance, but the narrowing bands signal an incoming volatility expansion.
Bitcoin price forecast today indicates a potential upward breakout as price action stabilizes above the Bollinger midline and consolidates in tight daily ranges. Despite a red candle today, recent green-bodied candles suggest bulls are regaining control. A break above $85,500 would open room toward $87,400 and potentially $88,000.
Conversely, failure to hold above $82,680 risks a retrace to $80,000 and $77,900. However, barring unexpected sell pressure, the path of least resistance remains upward. The low-volume pullback hints at profit-taking rather than trend reversal.
Ethereum price surged 12% in four days, overtaking Solana and XRP as Trump’s policy shift boosted risk appetite across global markets.
Ethereum’s Undervalued Status Powers Late Rally Over SOL and XRP
Ethereum price broke above $1,825 on April 25, marking its highest level in 50 days. Despite a sluggish start to the week, ETH now posts a 12% gain on the weekly timeframe, overtaking top Layer-1 rivals Solana (SOL) and XRP.
A major driver of Ethereum’s late rally was its undervalued status. At the start of the week, ETH struggled for traction, consolidating below $1,600 for a 14-day stretch between April 9 and April 23.
While ETH remained stuck under the $1,620 resistance, Bitcoin (BTC), XRP, and Solana had already broken major psychological barriers—$90,000, $2.20, and $150 respectively—earlier in the week.
Investors sitting on sidelined capital viewed ETH as undervalued relative to the broader market.Rapid inflows pushed Ethereum price from $1,600 on April 22 to $1,825 by Saturday, April 26—a 12% surge in just four days.
Ethereum price overtakes Solana and XRP on Weekly Timeframe, April 26 | Coingecko
Ethereum’s late rally now places it ahead of Solana and XRP in weekly performance, with the latter two posting 5.3% and 6.9% gains, respectively, according to CoinGecko data as of April 26.
Bullish Investors Stake 91,000 ETH Amid Rumors of Institutional Migration From Ethereum to Solana
Trends observed on the Ethereum 2.0 staking network further affirm the narrative that investors piled into ETH following Trump’s tariff rollback hints earlier this week.
According to official Beacon Chain data, Ethereum has witnessed a consistent flow of new deposits since April 22.
As seen on Beaconcha.in, total ETH staked stood at 34,055,790 on April 22.
Ethereum staking deposits as of April 26 | Beaconcha.in
Following Trump’s announcement of a call with Chinese President Xi Jinping, deposits steadily climbed, reaching 34,146,222 ETH at press time on April 26.
This reflects an increase of 90,432 ETH—equivalent to approximately $164 million at current market prices.
Increased staking typically impacts asset prices positively for two key reasons: First, it reduces the circulating supply of tradable ETH on exchanges, tightening liquidity during periods of strong demand.
This supply shock helped ETH outpace rivals SOL and XRP on the weekly timeframe, despite its slow start.
Second, rising staking participation signals continued confidence among Ethereum’s core developers and large investors in the network’s long-term viability.
Such moves often encourage neutral traders and new entrants to take long positions.
Additionally, Ethereum staking enforces time constraints on liquidity.
According to validator platform Figment.io, withdrawals from the Beacon Chain can take up to nine days.
This lock-up period means the $164 million in new staking deposits will not be available for instant sell-offs, helping to establish strong short-term support for ETH even if broader market sentiment softens next week.
Ethereum Price Forecast Today: ETH Eyes $1,950 if Momentum Holds Above $1,800
Ethereum price is hovering above $1,802 at press time on April 26, as bulls look to set a strong bullish cluster above the key psychological $1,800 level.
The Keltner Channel indicator shows ETH rebounding from near the lower band at $1,511, with ETH price action now targeting the midline resistance at $1,928.
Volume Delta confirms bullish momentum, printing a positive 47,260 ETH on the latest session, the highest in two weeks.
The Relative Strength Index (RSI) has bounced sharply from oversold territory at 31.74 to 39.58, suggesting strengthening bullish divergence.
Ethereum Price Forecast Today
Ethereum price forecast today suggests a continuation toward $1,928 if buyers maintain dominance. A daily close above $1,850 would validate a trend shift toward the Keltner Channel midline, with $1,950 emerging as the next major resistance.
Conversely, failure to hold $1,800 could expose ETH to renewed selling pressure, with immediate downside risk to $1,700 where prior consolidation occurred.
However, considering the improving Etheruem market volume dynamics and RSI recovery, odds now slightly favor a bullish continuation into early May.