Fidelity’s bid to launch a Solana ETF has been delayed again. The US Securities and Exchange Commission (SEC) confirmed the delay on July 7, 2025. The filing, submitted by Cboe BZX Exchange, is part of a proposed rule change to list and trade the Fidelity Solana Fund. SEC Initiates Review of Fidelity’s Solana ETF Proposal
CRO, the native coin of the Cronos Chain, is the top-performing crypto asset in today’s market, surging by 17% amid renewed bullish momentum.
The rally comes amid a broader uptick in trader sentiment and renewed investor enthusiasm following news that Donald Trump’s Media & Technology Group has filed for a new exchange-traded fund (ETF) featuring BTC, ETH, SOL, XRP, and CRO.
Trump Media’s Crypto ETF Gives CRO a Seat at the Big Table
On Tuesday, Trump Media & Technology Group filed for a new ETF called the “Truth Social Crypto Blue Chip ETF,” which will hold a portfolio of five cryptocurrencies: BTC, ETH, SOL, XRP, and CRO.
According to the SEC filing, 85% of the fund’s allocation would go to BTC and ETH, with SOL receiving 8%, CRO 5%, and XRP 2%.
Including CRO in this high-profile fund marks a potential turning point for the asset. The ETF will enhance its legitimacy and draw increased attention from retail and institutional players, pushing its value up as time passes.
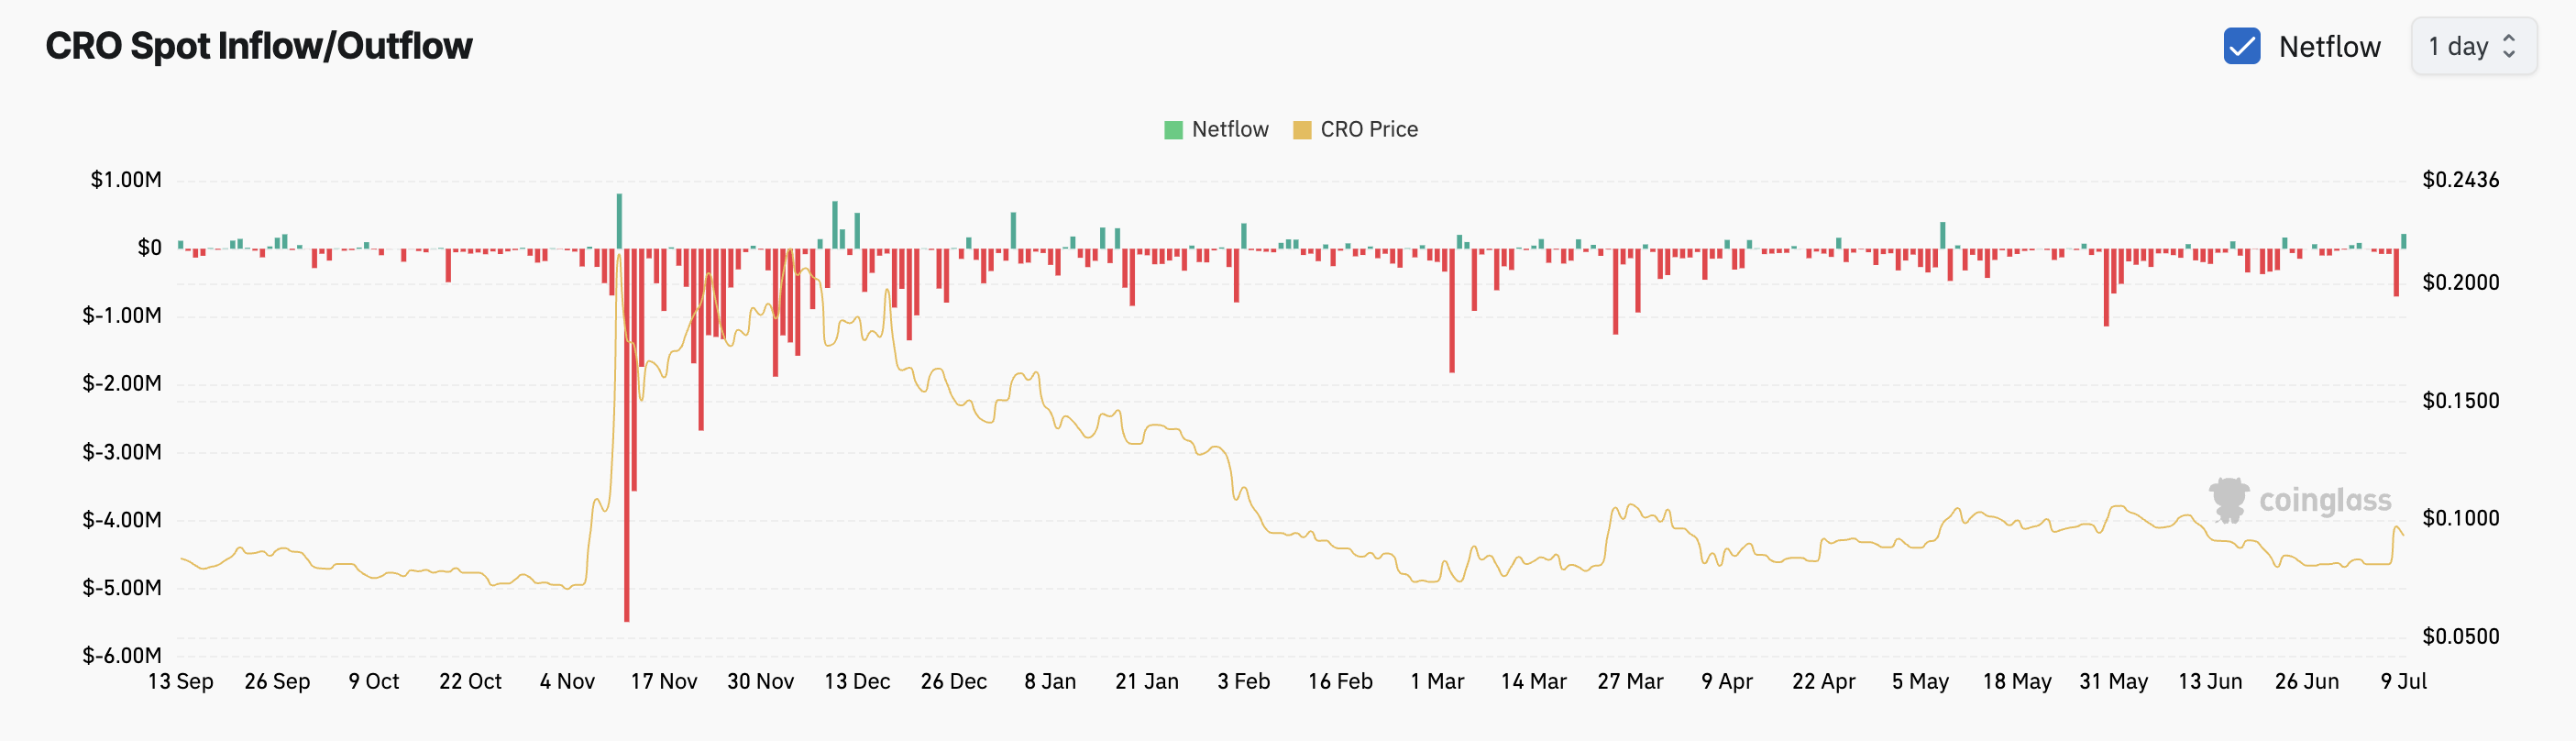
ETF News Triggers First Spot Inflow in One Week
Excitement surrounding the ETF announcement has sparked renewed interest in CRO, driving up demand over the past 24 hours. According to data from Coinglass, CRO has just recorded its first daily net inflow into the spot market since July 3.
This marks a shift in momentum, signaling that the token’s double-digit price surge is fueled by actual buy-side pressure rather than speculative swings.
When an asset sees a spike in spot net inflow, more capital enters the market to purchase its tokens/coins than exits it through sales. For CRO, the return to positive spot net inflows suggests that investors are actively accumulating the token in response to its inclusion in the proposed ETF. This reinforces the upward momentum and hints at the potential for a sustained rally.
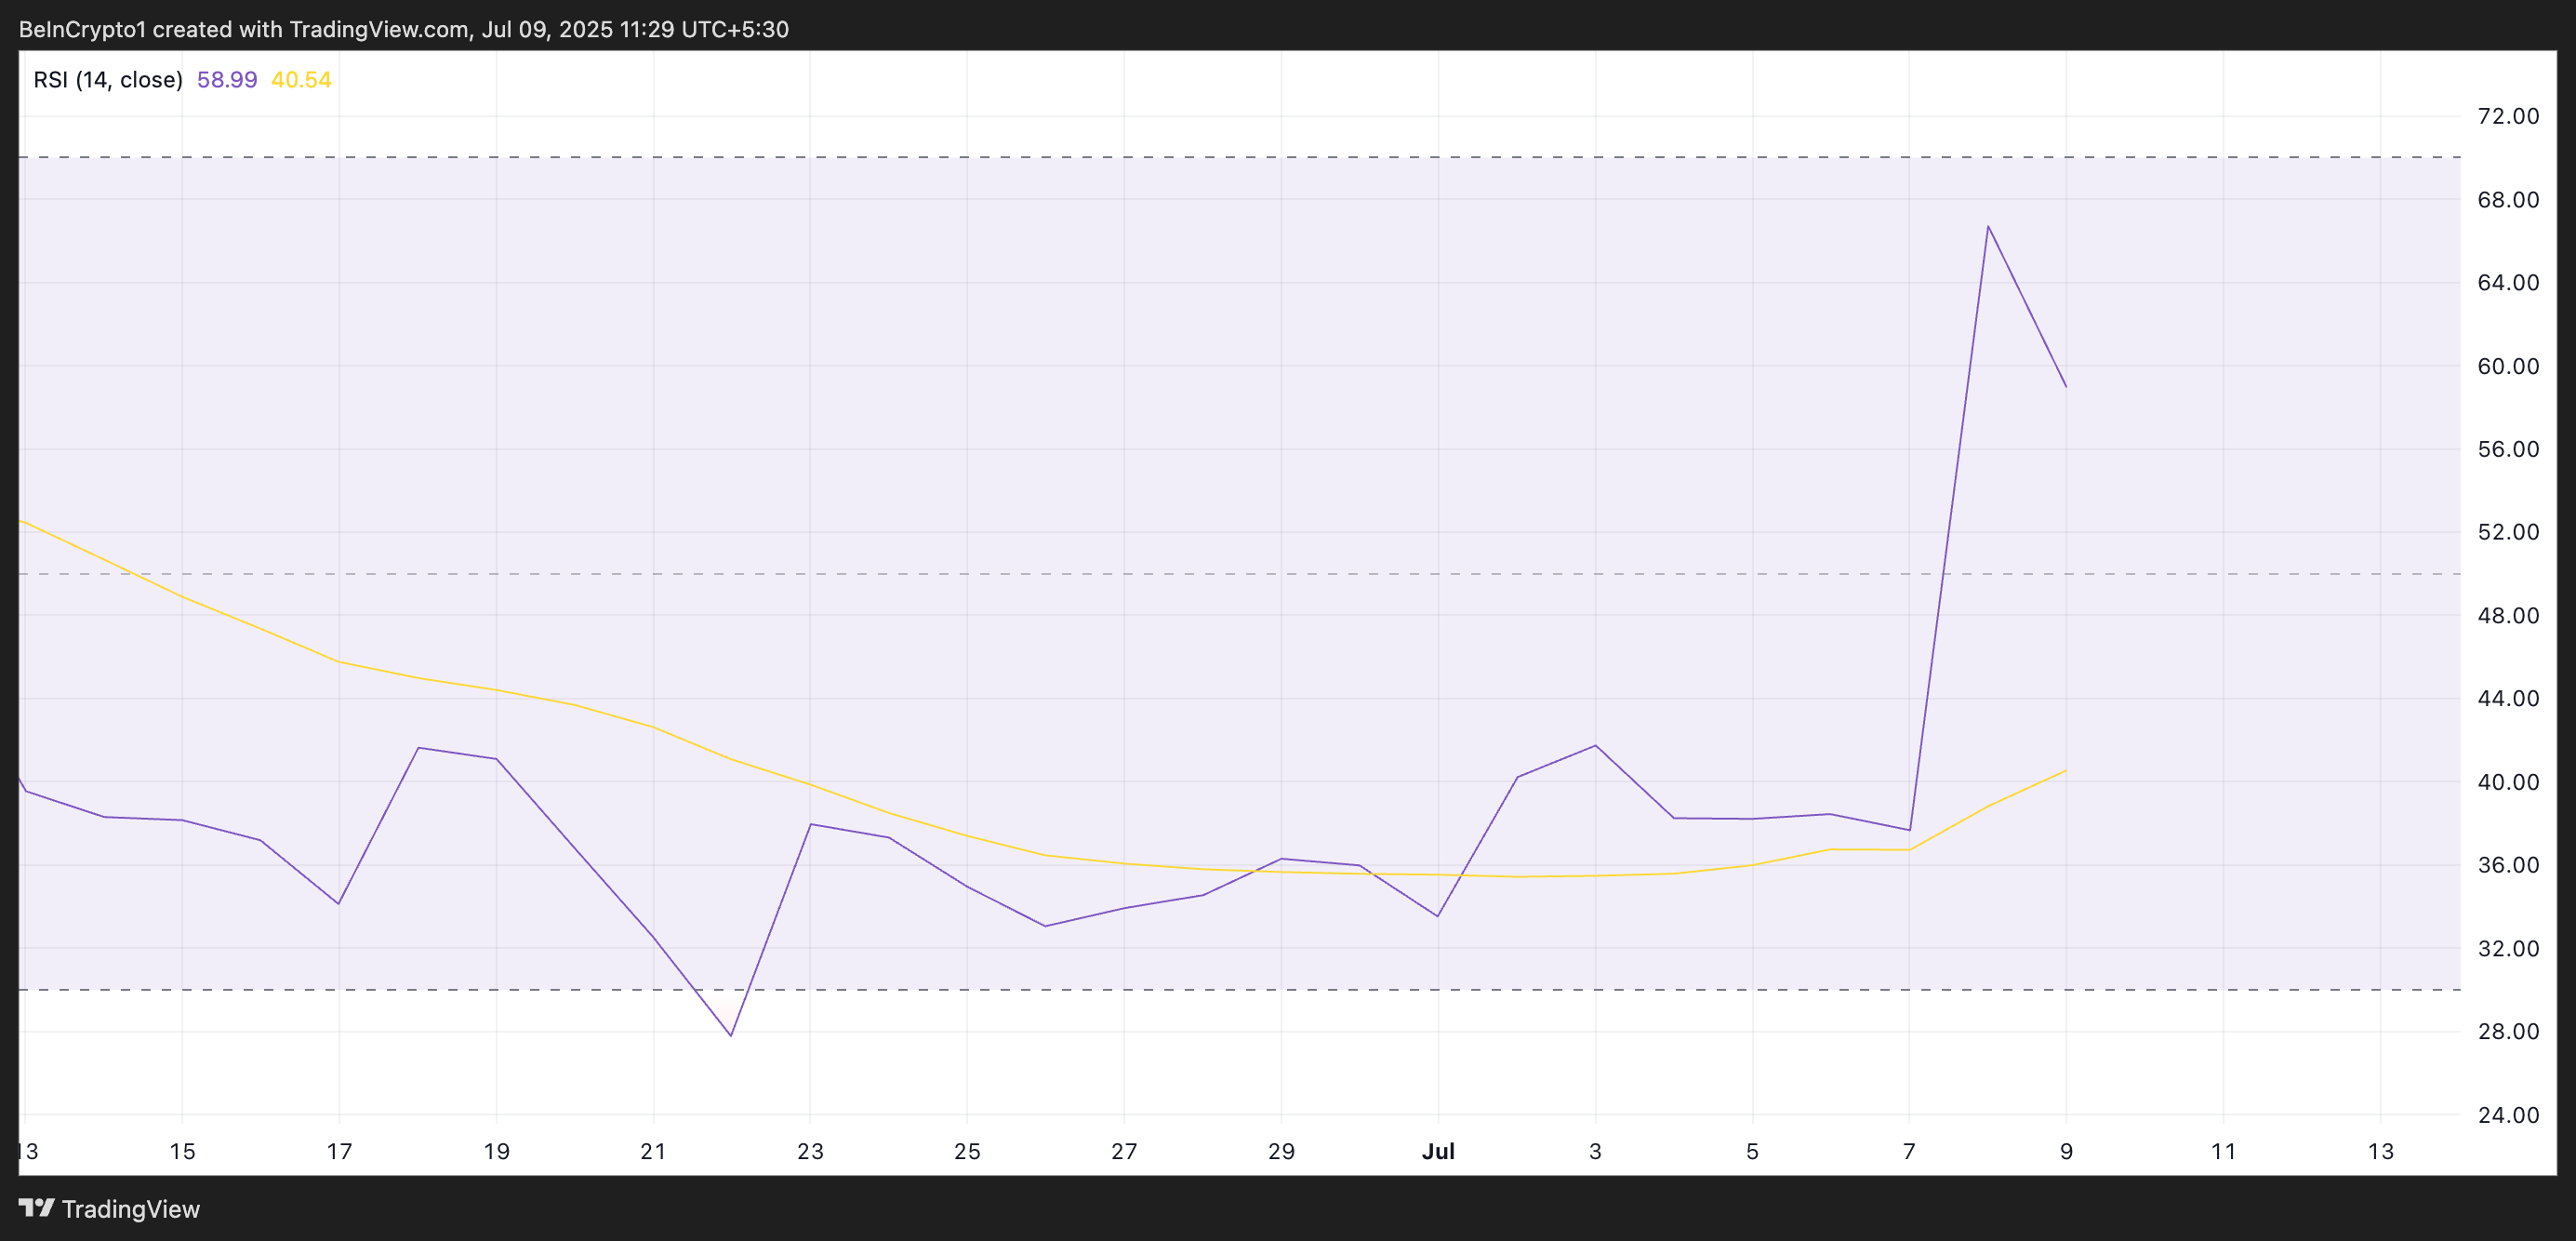
Moreover, CRO’s Relative Strength Index (RSI) suggests that buying pressure is far from exhausted. As of this writing, this key momentum indicator, which measures an asset’s overbought and oversold market conditions, is at 58.99.
The RSI indicator ranges between 0 and 100. Values above 70 suggest that the asset is overbought and due for a price decline, while values under 30 indicate that the asset is oversold and may witness a rebound.
CRO RSI readings indicate market participants prefer accumulation over distribution. If this trend continues, its price could continue to rise.
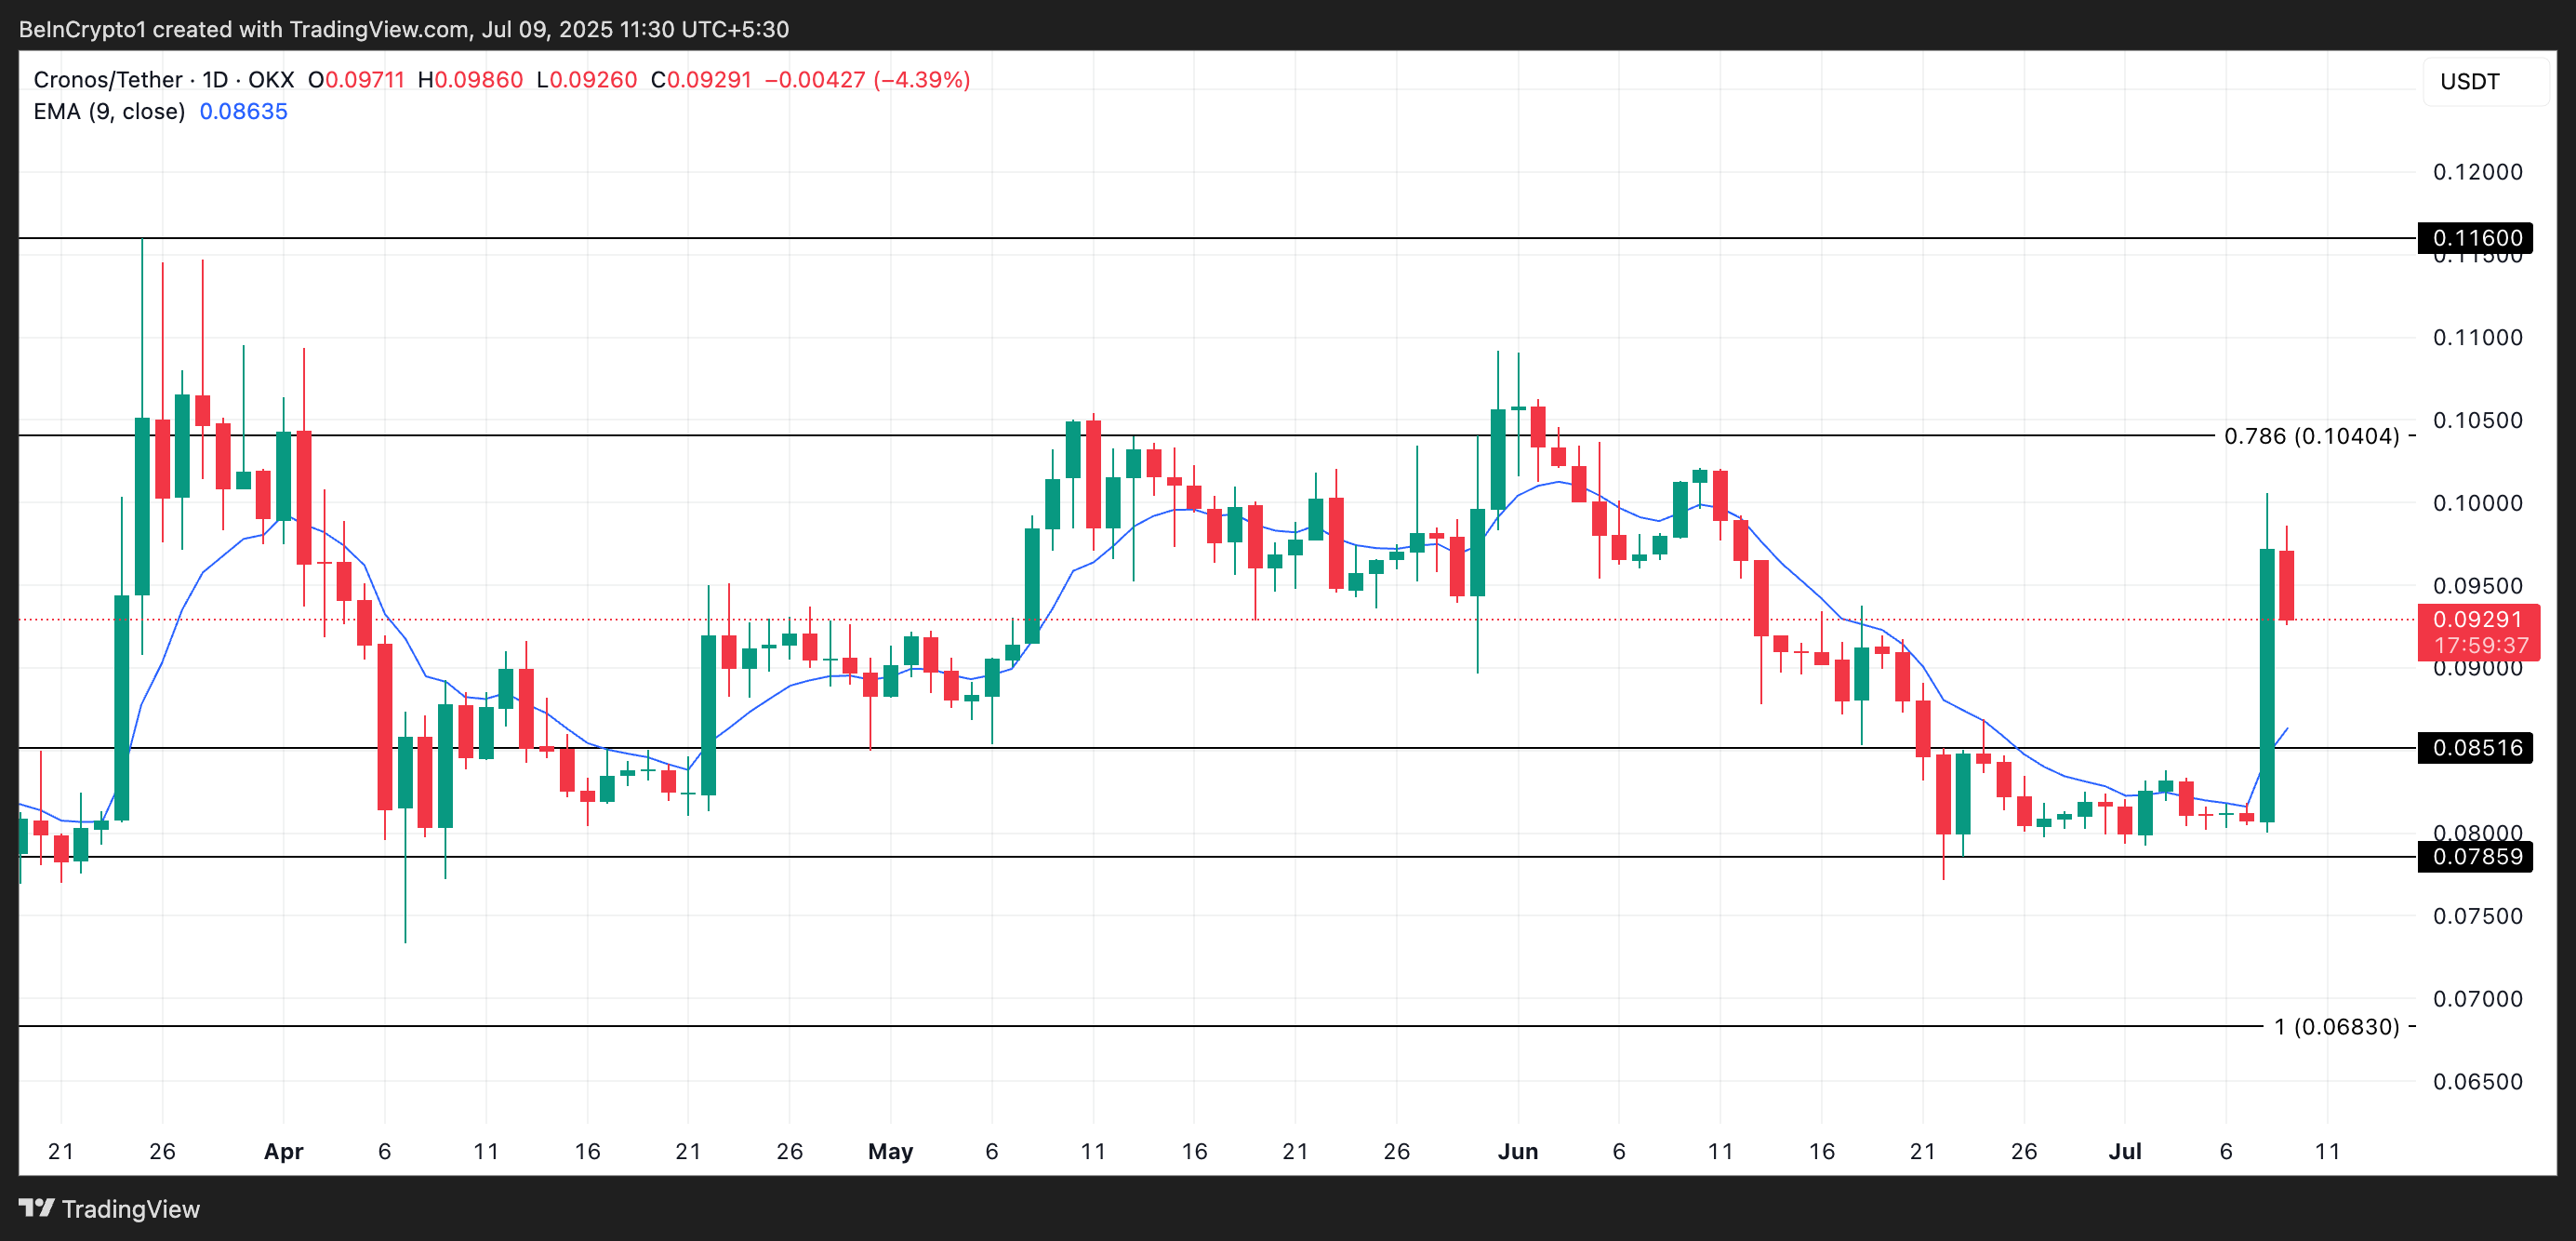
CRO Eyes $0.116 as Price Breaks Above 20-Day EMA
Readings from the CRO/USD one-day chart show the altcoin trading above its 20-day exponential moving average (EMA), indicating the bullish strength in the market.
An asset’s 20-day EMA tracks its average price over the past 20 trading days. When its price climbs above this level, it indicates a shift towards a bullish trend. It suggests that the short-term price momentum is turning positive, with recent prices trading higher than the average price over the past 20 days.
If the bullish trend holds, CRO could attempt to break above $0.0104. If successful, its price could extend its gains toward $0.116.
Bitcoin is on the move again, now trading near $109K and hitting a $2.11 trillion market cap. But what’s driving these big price changes? A new update from Glassnode, a leading blockchain data firm, helps explain. It shows how the two main types of buyers, long-term believers and first-time investors are play very different roles in the market.
And yes, emotions are still a big part of the story, too.
Why Conviction Buyers Matter at Turning Points
Glassnode’s latest analysis looks at investor behavior using spending patterns on Bitcoin, Ethereum, and ERC-20 tokens. According to the data, conviction buyers and first-time buyers play very different roles.
Conviction buyers are long-term believers. They don’t get shaken during downturns. In fact, Glassnode shows that these buyers usually appear around market bottoms, when fear is at its highest. In bull markets, they help by buying the dips, preventing steep pullbacks, and adding support during minor corrections.
Understanding who is behind price moves is critical to navigating market cycles. This new visualization, based on spending patterns, reveals how investor behavior shapes trend reversals and continuation – available across $BTC, $ETH, and #ERC20 tokens. For example:pic.twitter.com/sDsLQ0Cvml
But conviction alone isn’t enough to push prices higher. For that, you need something else, fresh demand.
First-Time Buyers Push Prices Higher
To get a strong rally, Glassnode says you need “First-Time Buyers.” These are people who are buying Bitcoin or Ethereum for the first time. When lots of new buyers come in, they bring fresh money into the market, and that’s what often causes prices to rise fast.
For example, from July to December 2024 and again from March to May 2025, Glassnode saw a big jump in these new buyers. Both times, Bitcoin’s price went up quickly afterward. This shows how powerful new demand can be.
Emotions Still Rule the Market
Even though charts and data are helpful, most traders still act based on emotion. Many retail traders follow fear, hype, or social media buzz. On the other hand, professional market makers use this emotional trading to their advantage.
That’s why Glassnode created something called the “FOMOmeter.” It helps track when traders are getting too excited or too scared.
The post Glassnode’s New Data Reveals the Hidden Hands Behind Crypto Price Pump appeared first on Coinpedia Fintech News
Bitcoin is on the move again, now trading near $109K and hitting a $2.11 trillion market cap. But what’s driving these big price changes? A new update from Glassnode, a leading blockchain data firm, helps explain. It shows how the two main types of buyers, long-term believers and first-time investors are play very different roles …
The notorious “50x ETH” whale, who previously cost Hyperliquid $4M, is back in action—this time going all-in on Chainlink (LINK). Within the last 45 minutes, the trader deposited 2.875M USDC into Hyperliquid to open a LINK long position with 10x leverage.
Since February 7, this high-risk trader has pocketed $16.4M by flipping leveraged positions on ETH, BTC, HYPE, and YGG. Now, all eyes are on whether this LINK bet will deliver another payday or end in liquidation. However, his past trades have not only brought him massive profits but also raised concerns about the risks of extreme leverage on decentralized trading platforms.
On March 14, the whale opened long positions on LINK worth approximately $31 million using 10x leverage on Hyperliquid and GMX, two major perpetual trading platforms. On top of that, he accumulated around $12 million in spot LINK. However, on-chain data shows that he has been gradually selling portions of his LINK holdings back into stablecoins, possibly securing profits or adjusting his exposure.
The ETH Trade That Shook Hyperliquid
This comes just days after his massive $200 million ETH long position on March 12, which led to millions in losses for Hyperliquid’s liquidity providers. The trade resulted in a $4 million deficit for the platform’s liquidity pool but landed the trader $1.8 million in profits. Over the past month, his total earnings from Hyperliquid alone have soared to $17 million, according to Web3 analytics firm Lookonchain.
The incident highlighted the risks of leveraged trading, where traders can control huge positions with little capital. While some thought the whale exploited a loophole, Hyperliquid confirmed it was all within the rules—just an extreme case they hadn’t accounted for. To prevent future disruptions, the platform tightened its collateral requirements on March 13.
Hyperliquid’s Growing Dominance
Controversy aside, Hyperliquid continues to dominate decentralized derivatives trading. Since launching in 2024, it has taken 70% of the market, outpacing GMX and dYdX, as noted by VanEck. Adding to its momentum, the platform recently hit a major milestone of $1 trillion in lifetime trading volume, solidifying its spot among the top decentralized exchanges.
What’s Next for Chainlink?
Chainlink’s price has been all over the place. It shot up by over 150% after Trump won the election but has since dropped from nearly $30 in December to under $14 now. But with big traders like the ETH 50x whale jumping in, many are wondering if LINK is about to make another big move. Right now, it has a market value of $8.7 billion and is still an important player in the DeFi world.
The post Chainlink Price Prediction: Can the 50x ETH Whale Trigger a LINK Rally? appeared first on Coinpedia Fintech News
The notorious “50x ETH” whale, who previously cost Hyperliquid $4M, is back in action—this time going all-in on Chainlink (LINK). Within the last 45 minutes, the trader deposited 2.875M USDC into Hyperliquid to open a LINK long position with 10x leverage. Since February 7, this high-risk trader has pocketed $16.4M by flipping leveraged positions on …