While most DeFi protocols chase the same categories, such as blue-chip tokens, staking protocols, and liquid stablecoins, a different type of asset activity is growing behind the scenes. People hold NFTs, LP tokens, meme coins, and tokenized real-world assets in their wallets that represent value, but most of them sit unused because few platforms are built to support them.
Paddle Finance was designed for this gap: a lending and trading protocol built to unlock liquidity from non-standard assets. It operates on Base and Berachain, where activity is accelerating. Berachain alone has reached $2.69 billion in TVL. While others chase volume in familiar categories, PaddleFi focuses on helping users make use of what they already hold.
Why Berachain Fits the Model
There’s no shortage of new L1s and L2s, but Berachain stands apart in how it ties liquidity to real utility. Its Proof of Liquidity (PoL) model rewards protocols for real on-chain activity rather than passive staking, making it a strong match for products built around asset movement and user interaction.
Berachain has also become home to a fast-growing NFT ecosystem, especially among more degen communities. Projects like Steady Teddys, Bullas, Mibera, and Yeet are drawing in active participants. These collections are already being used within PaddleFi for borrowing, OTC trading, and community-focused liquidity programs.
On the technical side, Berachain uses Ethereum-compatible tools, lowering friction for deployment. But what sets it apart is its alignment with platforms like PaddleFi that serve assets outside the ERC-20 standard—assets that often emerge organically from community-driven culture, not top-down design.
What PaddleFi Actually Does
Most DeFi platforms were built around standard tokens, and that makes sense as for a long time, those were the only assets with enough liquidity to be usable. But that’s no longer the case. NFTs now hold real on-chain value, RWAs are being tokenized, and meme coins often have strong market caps and communities. These assets still get limited support, but PaddleFi is designed specifically for them.
It offers:
- NFT lending through peer-to-peer and instant loan models
- Trustless OTC trading for NFTs, RWAs, and tokens without going through centralized platforms or brokers.
- Basket collateral for multiple assets to be packaged into a single loan or trade.
This structure gives users more flexibility without needing to sell or split up what they own. It also creates access for groups that often get left out—collectors, small token holders, and early-stage RWA participants.
$2.55 Million TVL and Growing
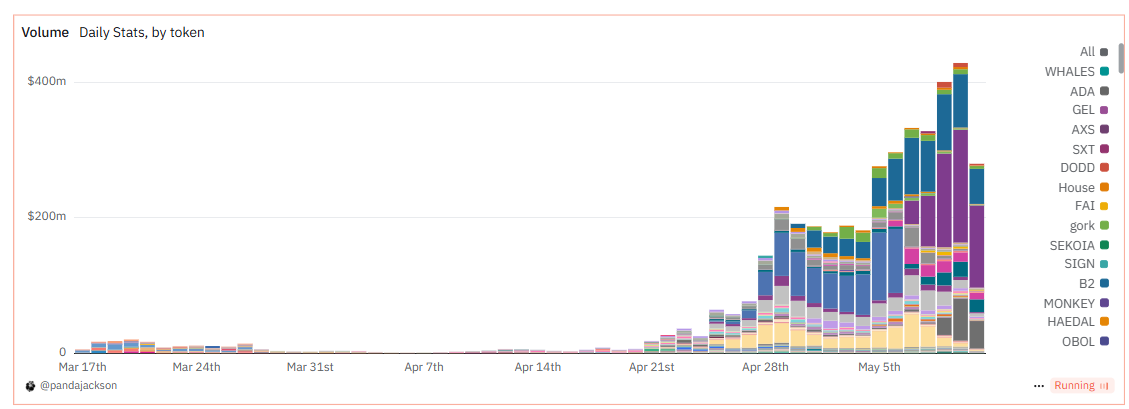
PaddleFi’s traction on multichain is measurable. As of now, the protocol holds over $2.55 million in assets locked across its contracts. In just April, it has already processed more than $3 million in volume, with growing usage in lending and OTC functions. That’s a meaningful signal in an ecosystem still in its early stages, especially considering the complexity of the assets being supported.
And the activity isn’t coming from generalized DeFi users; it’s coming from NFT-native and degen communities on Berachain. Many of the assets being used on PaddleFi aren’t tokens you’ll find on major exchanges. They’re “middle-class” NFTs—collections with strong engagement, but not always headline prices, low-float meme tokens, and in-development real-world asset projects that are experimenting with early liquidity.
This fits naturally with Berachain’s design, a chain built around activity, not polish. Where value is more about how assets are used than how they look, PaddleFi offers clear utility for communities that want to do more than just hold.
Filling a Gap That’s Easy to Overlook
Berachain already has protocols that cover the basics: Kodiak for swaps, Infrared for staking, and Honey for stablecoin liquidity. What’s been missing is a way to use assets that don’t fit into those buckets.
That’s where PaddleFi fits in. It connects overlooked assets like NFTs and RWAs to usable tools. NFT holders can borrow without selling. RWA investors can access capital without waiting for centralized approval. Smaller tokens can be traded directly without needing a formal market.
PaddleFi doesn’t aim to replace other dApps; it adds functionality around asset types that usually get ignored. And in a chain like Berachain, where liquidity is high but fragmented, that role matters. PaddleFi helps bring more of that capital into circulation.
The Bigger Picture
If you zoom out, what PaddleFi is doing is simple: it’s building tools for assets that don’t yet have default infrastructure. But the implications are larger. As the definition of “on-chain assets” continues to expand, the platforms that support the long tail, rather than only the top 10 tokens, will be the ones that grow alongside the space.
PaddleFi is betting that the future of DeFi won’t just be about liquidity, but also about how many types of assets you can make liquid. And so far, that bet is paying off.
With Berachain scaling quickly and its Proof of Liquidity (PoL) model rewarding real usage, PaddleFi is well-positioned to go deeper. The upcoming launch of NFT-backed money markets will give collections another way to tap into DeFi building blocks, and protocols like PaddleFi are key to making that possible.
This combination of infrastructure and community alignment is proving durable. It’s a glimpse of what the next phase of DeFi infrastructure might look like: fast, flexible, and built for assets that don’t follow a template but still belong in the same system.
The post Paddle Finance launch on Berachain: Liquidity Tools for Assets Most Protocols Ignore appeared first on BeInCrypto.