In a week full of major developments across cryptocurrency and global markets, Ripple made a notable gesture to the Bitcoin community, large corporations added billions in Bitcoin to their balance sheets, and President Trump reignited trade tensions with new tariffs. These events come as the digital asset industry pushes for unity and regulatory clarity, with more institutions now diversifying into both Bitcoin and XRP. Ripple Donates ‘Skull of Satoshi’ to Bitcoin Museum Ripple CEO Brad Garlinghouse announced the donation of the “Skull of Satoshi” to the Bitcoin community. The sculpture will be displayed at the Bitcoin Museum in Nashville. The 11-foot artwork, created by Benjamin Von Wong with Greenpeace USA, was built from discarded electronics and was originally part of an environmental campaign. The art piece was first shown in March 2023 during the “Change the Code, Not the Climate” campaign. It was meant to criticize the energy use of… Read More at Coingape.com
In early May 2025, the Ethereum (ETH) market witnessed contrasting actions from large investors, commonly known as whales.
These opposing behaviors from whales present investors with both risks and opportunities.
Contrasting Ethereum Whales’ Actions
On one hand, several Ethereum whales are accumulating ETH in large quantities. An ETH whale purchased 3,029.6 ETH valued at $5.74 million. However, this whale currently faces a temporary loss of $142,000 as the price has dropped to $1,842 per ETH.
On May 1, 2025, Lookonchain reported that multiple whale addresses accumulated thousands of ETH within two hours. These actions indicate that some major investors remain confident in ETH’s long-term potential despite short-term price volatility.
On the other hand, selling pressure from Ethereum whales is significant. On May 2, 2025, OnchainLens reported that a whale deposited 2,680 ETH on Kraken, incurring an estimated loss of around $255,000.
Meanwhile, analysts revealed that another whale transferred 3,000 ETH to Kraken within 10 minutes on the same day, signaling a strong intent to sell.
10 minutes ago, a whale 0xaDd deposited 3k $ETH (~$5.53M) into #Kraken.
Those $ETH were bought since ICO and have been dormant in 3 years before depositing.
Just now, he still has 2k $ETH (~$3.69M) in his wallet.
Notably, a whale who received 76,000 ETH during the 2015 ICO sold 6,000 ETH, potentially securing a profit of $10.92 million.
Additionally, on May 1, 2025, on-chain data showed a whale increasing their short position by borrowing an additional 4,000 ETH. This whale is bringing their total short position to 10,000 ETH, equivalent to approximately $18.4 million.
These moves highlight a clear divergence in Ethereum whale strategies, with accumulation and selling creating significant pressure on ETH’s price.
Market Context and Investor Sentiment
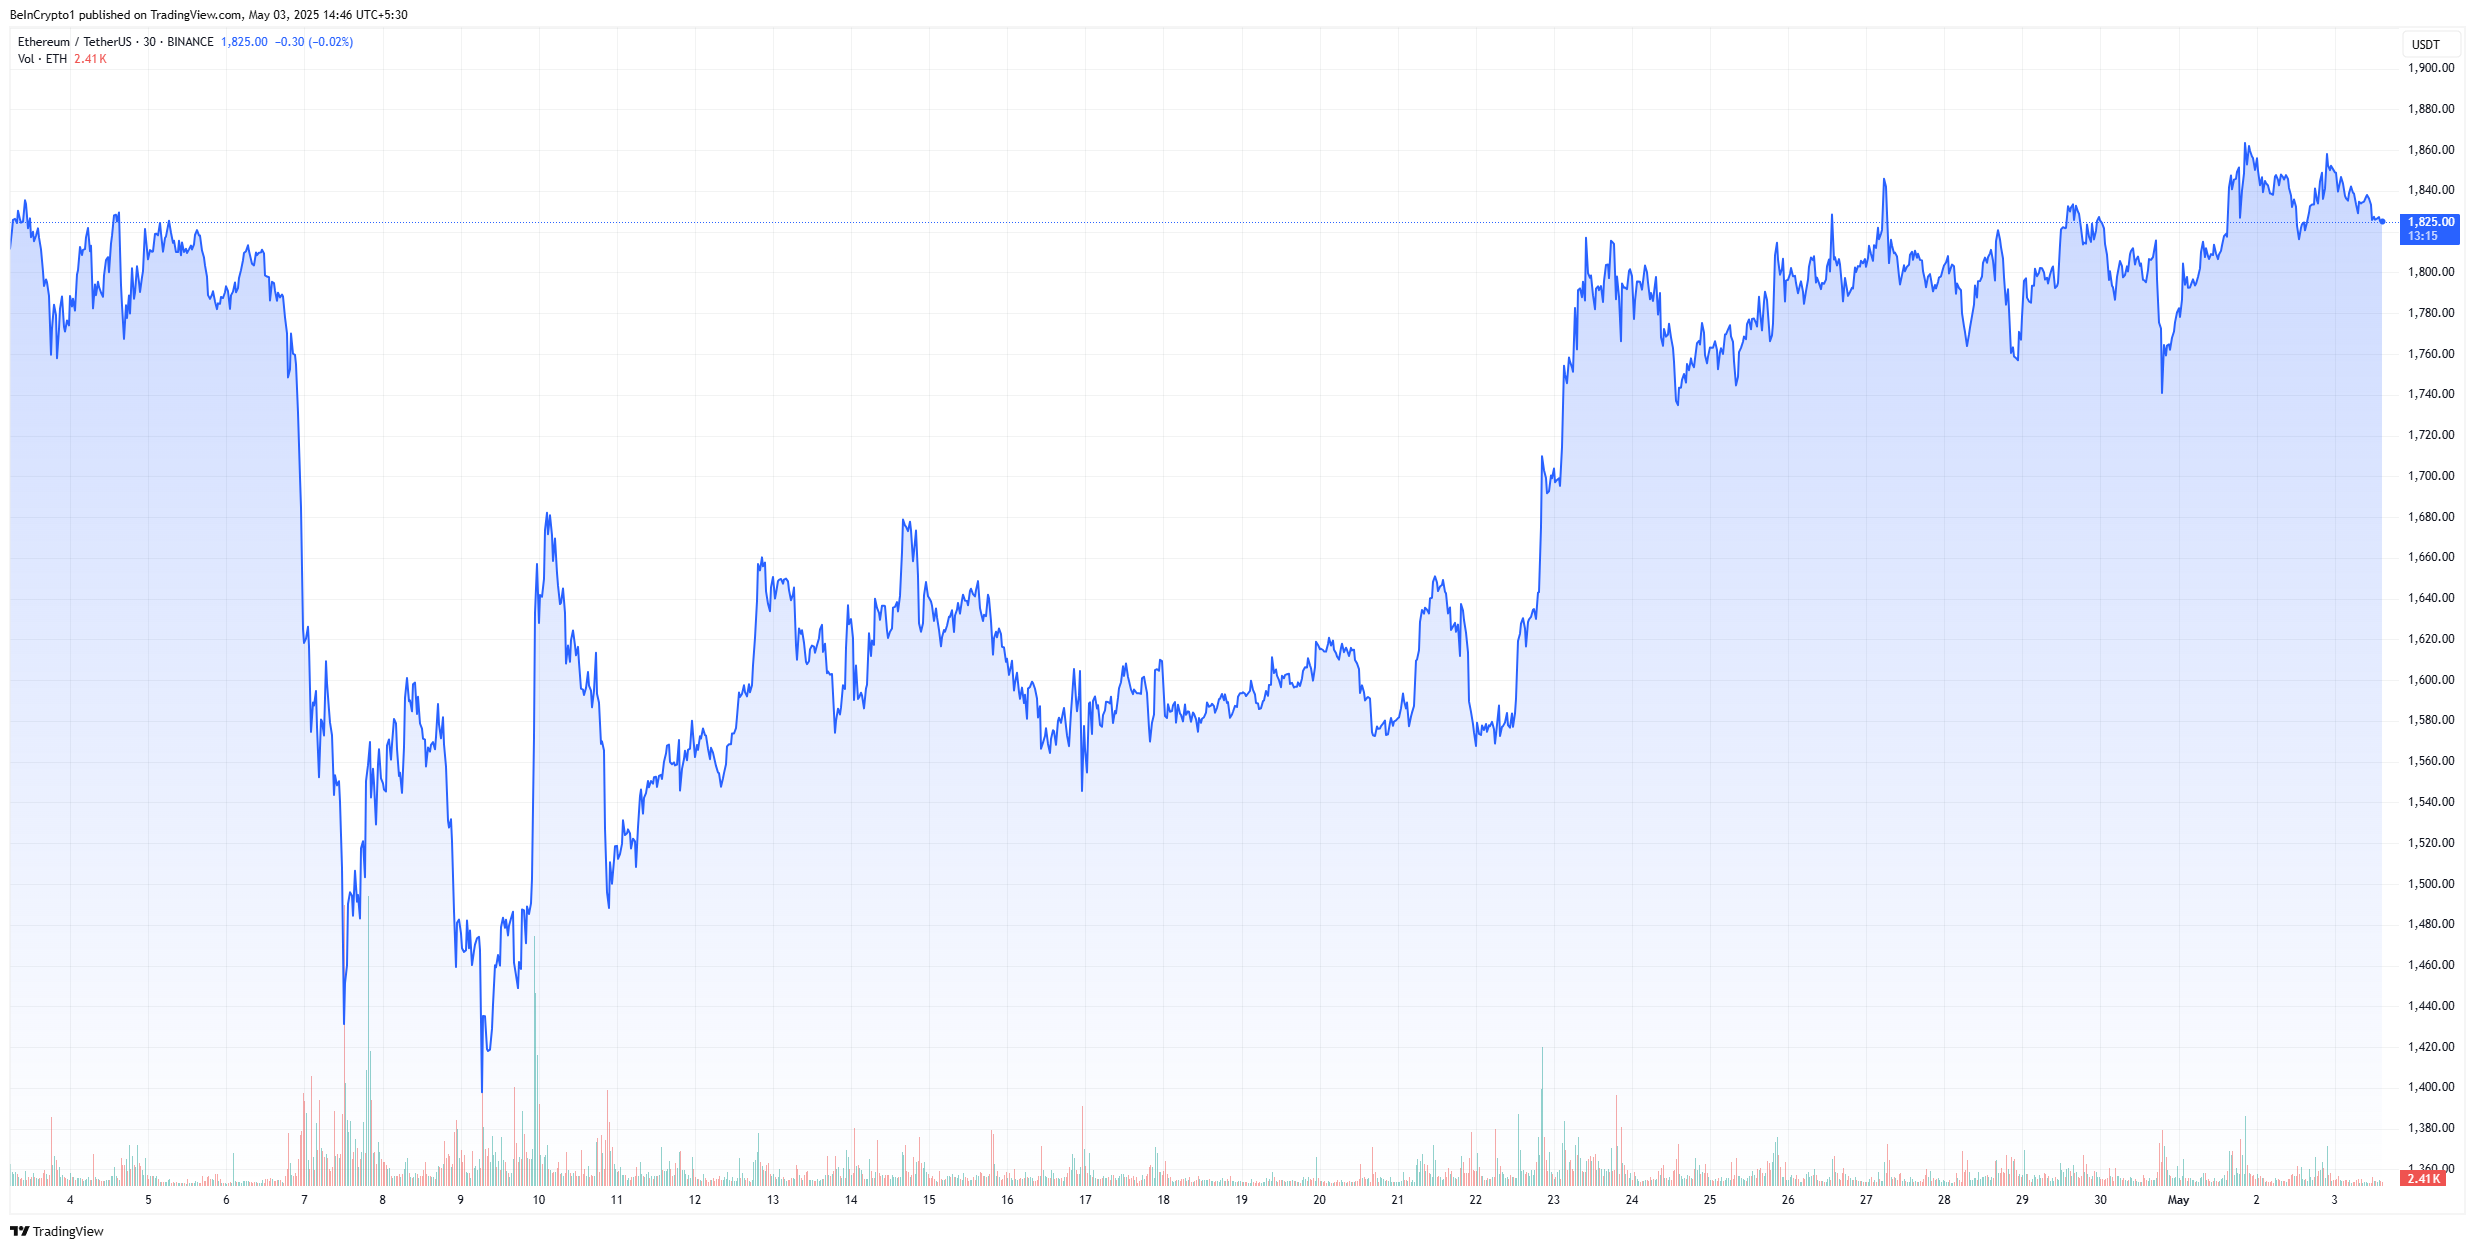
The volatility in whale behavior coincides with a crypto market influenced by various factors. According to BeInCrypto, ETH’s price gained 10% in a week but slightly decreased in the last 24 hours. It is hovering around $1,842—a notable decline from its March 2025 peak of $2,500.
Ethereum Price Chart in the Past Month. Source: TradingView
Despite this, market sentiment shows some positive signs. Ethereum investment products also saw US$183m inflows last week following an 8-week run of outflows. The Ethereum spot ETF had a total net inflow of US$6.4932 million yesterday. This reflects sustained long-term interest from institutions, even amid short-term selling pressure from whales.
Furthermore, a whale’s large 10,000 ETH short position suggests expectations of a near-term price decline, potentially amplifying downward pressure if market sentiment turns negative.
Meanwhile, retail investors appear to be affected by this uncertainty, with ETH trading volume on exchanges dropping 10% over the past 24 hours.
Risks and Opportunities
The opposing actions of whales place investors at a crossroads of risks and opportunities. On the risk side, the selling pressure from whales, particularly the significant short position, could lower ETH’s price in the short term, especially given the overbought market conditions.
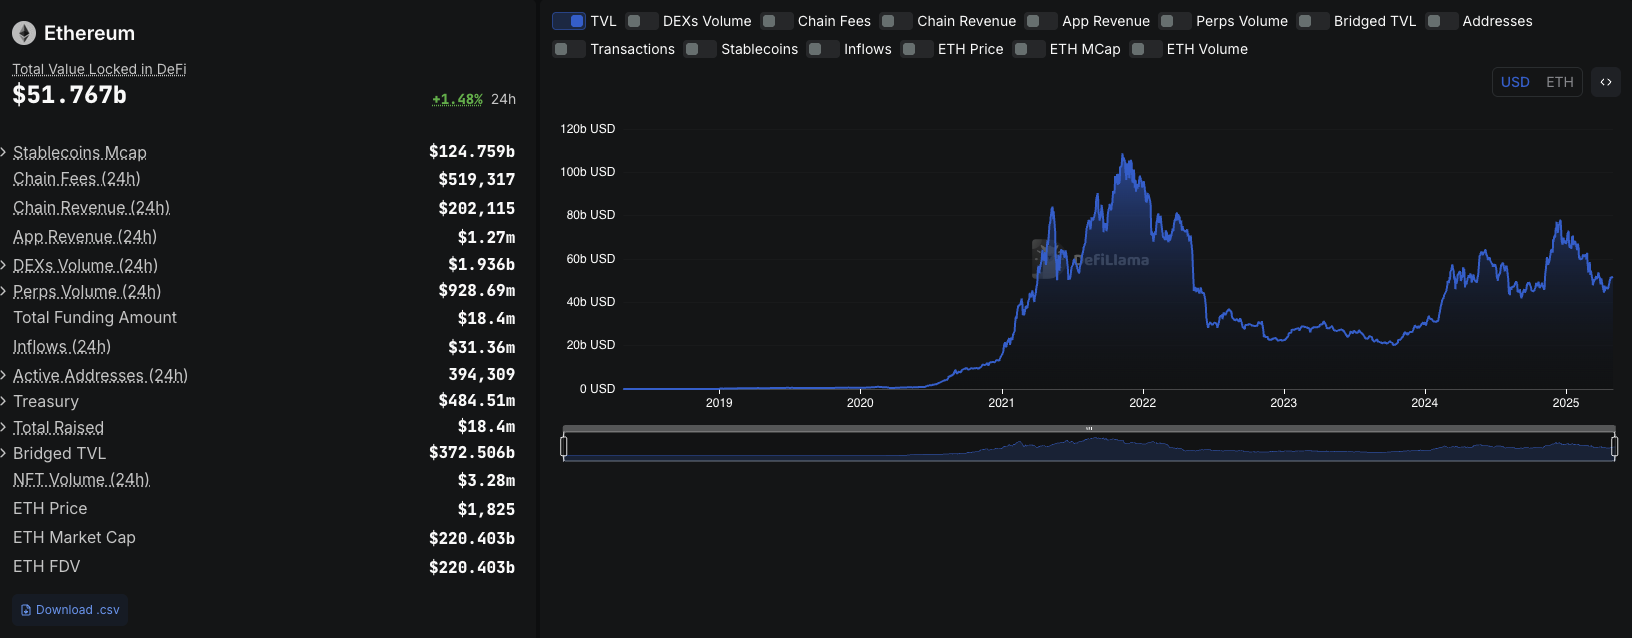
However, opportunities also abound. Whales’ accumulation of thousands of ETH reflects long-term confidence in Ethereum’s potential, particularly as the network continues to lead in DeFi, with a total value locked (TVL) of $52 billion in May 2025, according to DefiLlama.
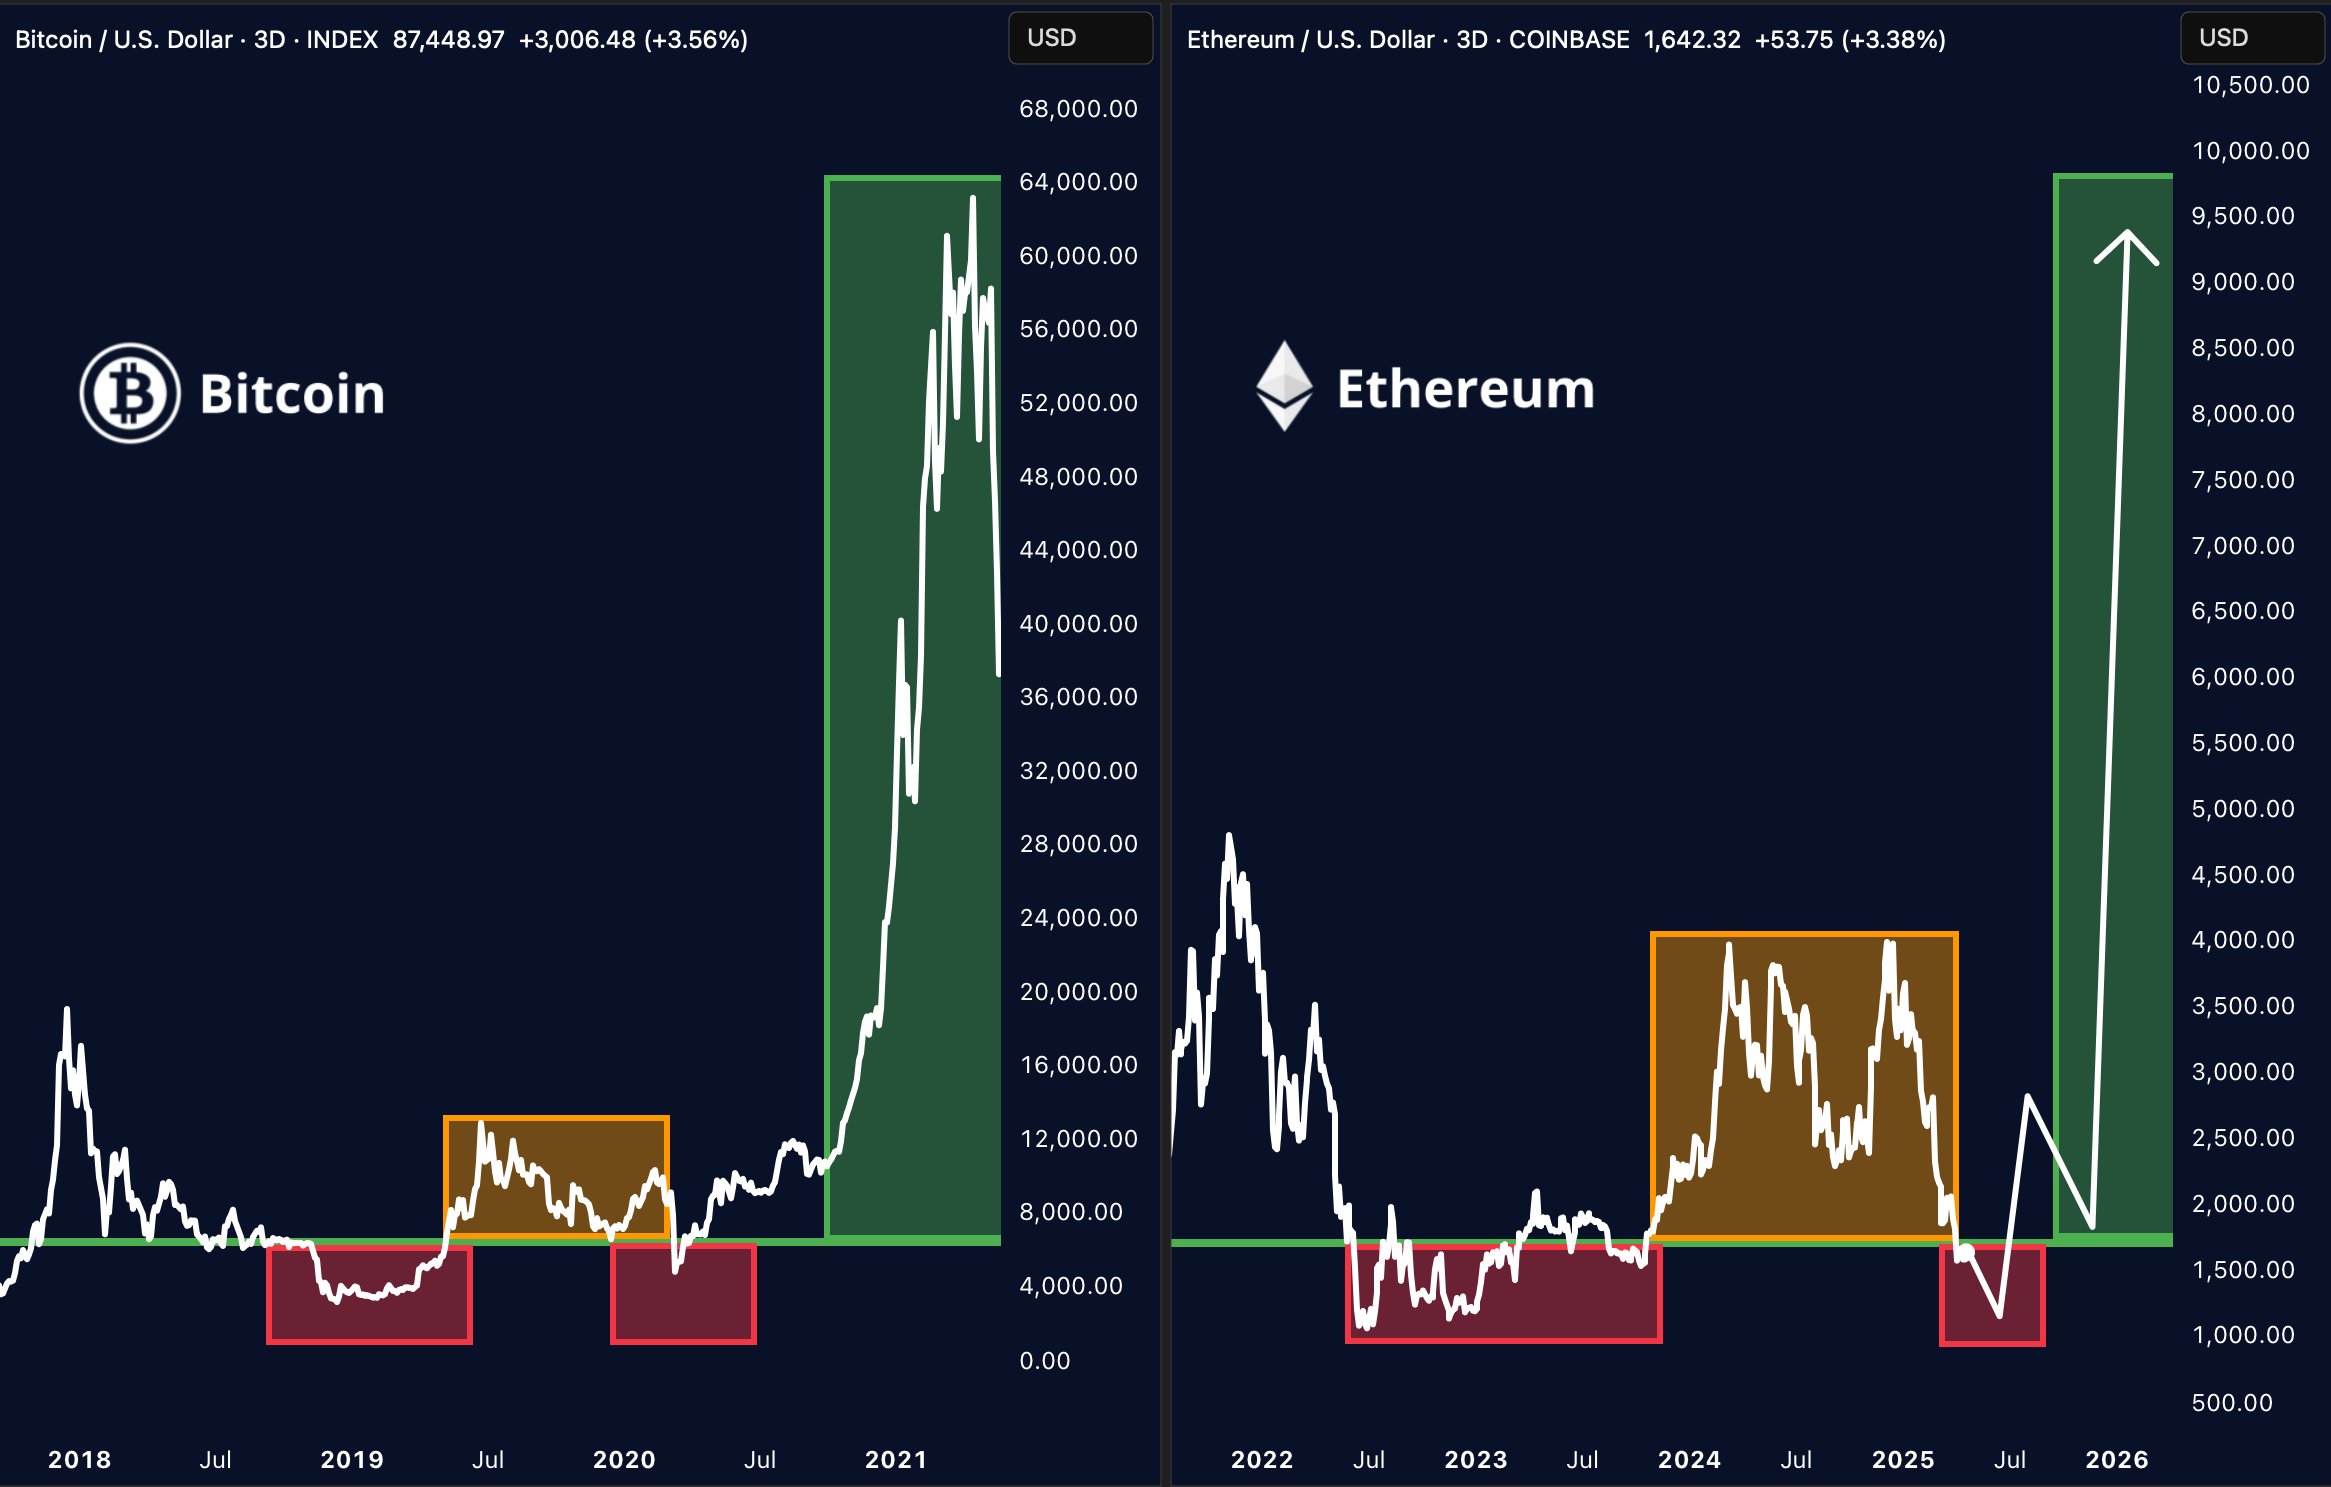
Analyst Merlijn has shown that Ethereum’s current price structure is similar to that of Bitcoin in 2020. Accordingly, he believes that Ethereum will witness a strong boom if history repeats itself.
Ethereum is showing the same structure. Source: Merlijn
Ethereum risks losing developers to Solana, which is gaining momentum due to better startup support and a streamlined user experience.
Yet, technical upgrades like Ethereum 2.0 and the growth of Layer 2 solutions such as Arbitrum and Optimism also support ETH’s long-term development.
Investors might view the current lower price levels as an opportunity to accumulate, but they should closely monitor whale activities and technical indicators to mitigate correction risks.
Years ago, XRP traded under a penny, shrugged off by many who didn’t fully grasp its long-term value. Now it ranks among the top tokens in the world, despite early doubt. Today, a new player is catching attention for a similar reason: solid utility, early-stage entry, and asymmetric upside. That project is Mutuum Finance (MUTM), priced at just $0.03 in Phase 5 of its presale, with over $11.7 million raised and 60% of tokens in this phase already sold. With more than 12,700 holders and deep DeFi fundamentals, Mutuum Finance (MUTM) is now being discussed in the same breath as XRP’s early rise.
That isn’t just community hype. One notable investor who previously held a six-figure XRP portfolio has now placed $12,000 into Mutuum Finance (MUTM) at $0.03 during Phase 5 of the presale. That allocation secured them 400,000 MUTM tokens, and with the $0.06 listing price locked in, this investor is already set to double their position to $24,000 by launch day.
Analysts have projected targets of $1 to $2 within the first few post-launch months. At $1, the same 400,000 tokens would be worth $400,000—a 33x return on the original $12,000 buy-in. At $2, that value becomes $800,000—a 66x return. And at $3, the investor would be holding $1.2 million, marking a 100x gain from the Phase 5 entry point.
A Custom Lending Platform for the Whole Market, Not Just Blue Chips
Unlike traditional DeFi platforms that focus only on blue-chip coins like ETH or BTC, Mutuum Finance (MUTM) is targeting both ends of the spectrum by launching with two core lending engines. The peer-to-peer (P2P) model is built to support more volatile or illiquid tokens—like DOGE, SHIB, and other meme coins—by allowing lenders and borrowers to negotiate customized terms directly. This opens up new borrowing and earning channels for token holders who’ve typically been sidelined by major protocols.
Lenders will be able to select the terms they’re comfortable with—interest rates, loan durations, and repayment conditions—without the need for a centralized intermediary. Borrowers will post overcollateralized positions, and lenders will accept or reject those terms based on their own risk profile. This design brings real freedom into the lending space, offering an alternative to one-size-fits-all models.
Security Measures and Institutional Trust Growing Fast
One key element helping Mutuum Finance (MUTM) gain momentum is its proactive approach to smart contract safety. The protocol has been fully audited by CertiK and is now running a $50,000 Bug Bounty Program, rewarding any white-hat developers who can identify weaknesses before launch. The bounty includes rewards across four tiers—from low severity to critical—ensuring all aspects of the system are rigorously examined. Combined with a Skynet Score of 77 and a Token Scan Score of 95, the project has built real confidence across institutional desks and high-net-worth DeFi users.
Investors are already acting on that trust. A former Avalanche (AVAX) holder recently moved $18,000 into Mutuum Finance (MUTM) during this phase, positioning for a clean 3x return post listing. In another case, a $25,000 whale from Phase 1 is now up to $75,000 in paper gains and targeting another 300% post launch. These are not passive bets—they’re conviction-driven entries by traders who recognize early value in scalable DeFi models with on-chain transparency.
And while many presales are merely token offerings waiting for development, Mutuum Finance (MUTM) is preparing to launch its beta platform at the same time as its token goes live. The team has outlined a roadmap that includes Layer-2 integration for faster, lower-cost usage, passive income through mtTokens, and the rollout of a decentralized stablecoin that will always target a $1 peg. That stablecoin will only be minted when loans are initiated with overcollateralized assets, and it will be burned upon repayment or liquidation—creating both stability and deflationary pressure within the ecosystem.
As adoption grows, part of the protocol’s revenue will be used to buy MUTM tokens on the open market, sending them to mtToken stakers in dividend distribution cycles. This system will reward holders with long-term vision while creating upward pressure on the token price, especially as more users engage with the lending and borrowing functions.
The listing price of Mutuum Finance (MUTM) is set at $0.06, meaning investors who buy in now at $0.03 already stand to double their capital by Phase 11. But many are aiming far beyond. XRP once turned pennies into fortunes for early believers, and this $0.03 DeFi token now has the same ingredients: utility, demand, and a launch window narrowing by the day.
For more information about Mutuum Finance (MUTM) visit the links below:
The post Liked by Investors: This $0.03 Coin Has the Same Upside Potential as XRP (XRP) in Early Days appeared first on Coinpedia Fintech News
Years ago, XRP traded under a penny, shrugged off by many who didn’t fully grasp its long-term value. Now it ranks among the top tokens in the world, despite early doubt. Today, a new player is catching attention for a similar reason: solid utility, early-stage entry, and asymmetric upside. That project is Mutuum Finance (MUTM), …
After a relief rebound in the last two days, Pi Network (PI) has approached a crucial pivotal stage that will decide its fate for the coming weeks. The large-cap altcoin, with a fully diluted valuation of about $16.3 billion and a daily average trading volume of about $405 million, has rebounded around 8 percent in the past two days to trade about $1.48 on Wednesday, March 12, during the early European session.
As a result, Pi coin was the top trending crypto asset on Coingecko in the past 24 hours, signaling its rising popularity among speculative traders.
Pi Coin Price Prediction Today
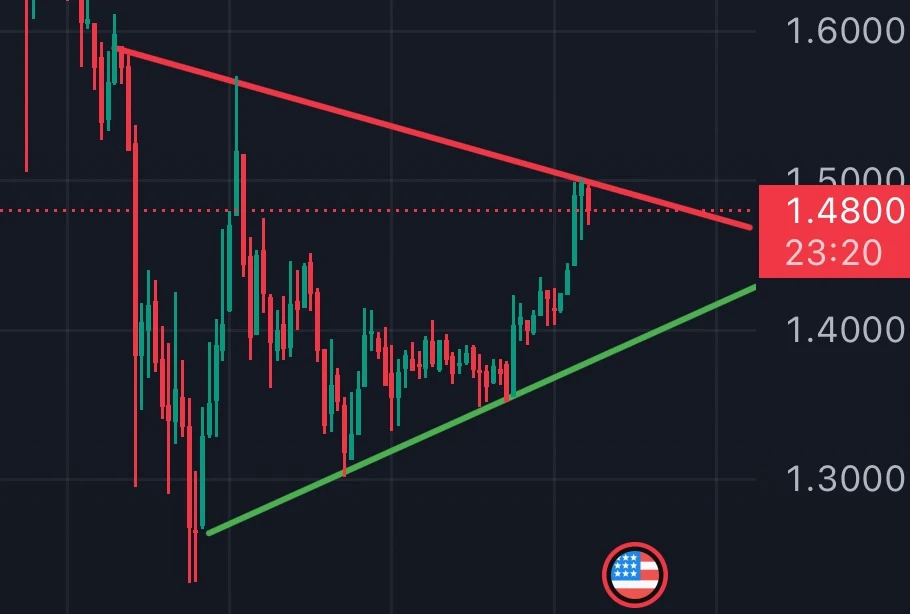
In the 1-hour time frame, Pi price has been consolidating in a symmetrical triangular pattern for the past four days. Following the reliefs rebound in the past two days, Pi price is now retesting the upper border of the symmetrical triangular pattern.
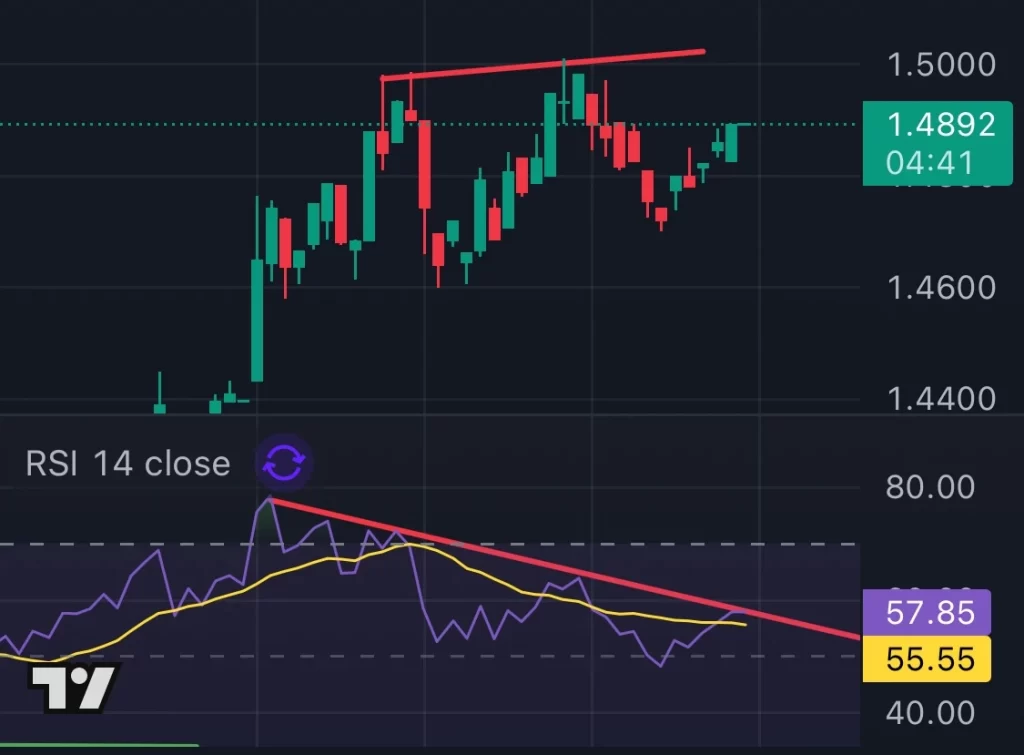
As Coinpedia previously noted, Pi price has already confirmed a reversal pattern, which was characterized by head and shoulders formation coupled with a bearish divergence of the daily Relative Strength Index (RSI). Consequently, the odds of a reversal toward a lower low remain high in the coming days.
Moreover, zooming into the 5-minute time frame shows a clearer picture of the bearish sentiment. Notably, Pi price has been forming a potential double-top coupes with a bearish RSI in the five-minute candlestick. Consequently, a consistent drop below $1.46 will eventually lead to a further decline towards the lower border of the symmetrical triangular pattern.
However, a consistent close above the upper border of the symmetrical triangular pattern will lead to bullish sentiment in the coming days.
Never Miss a Beat in the Crypto World!
Stay ahead with breaking news, expert analysis, and real-time updates on the latest trends in Bitcoin, altcoins, DeFi, NFTs, and more.
The post Pi Coin Price Prediction for March 12 appeared first on Coinpedia Fintech News
After a relief rebound in the last two days, Pi Network (PI) has approached a crucial pivotal stage that will decide its fate for the coming weeks. The large-cap altcoin, with a fully diluted valuation of about $16.3 billion and a daily average trading volume of about $405 million, has rebounded around 8 percent in …